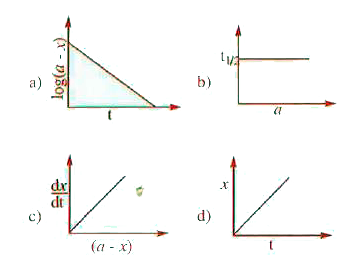
Which of the following graphs represent a first order reaction (a=initial concentration of reactant, x=concentration of reactant consumed, t=time)
 Solution in Telugu
(i),(ii),(iv)
(iii),(iv)
(ii),(iii)
(i),(ii)
The correct Answer is:A
For a first order reaction
Rate =−Δ[A]Δt=k[A]
It is a straight line plot with negative slope when cocentration of reactant is considered as in (i) and half-life for first order is independent from concentration, as in plot (ii).
Topper's Solved these Questions
Similar Questions
The energy of an electron in the 3rd orbit of H- atom ( in J ) is approximately.
View SolutionFrom the following energy levels of hydrogen atom, the values of E∞ and E3 in J are, respectively
_______ E∞= ........
_______ E3= ........
_______ E2=−0.545×10⁻¹⁸J
_______ E1=−2.18×10⁻¹⁸J
View SolutionIn a zero-order reaction, if the initial concentration of the reactant is doubled, the time required for half the reactant to be consumed
View SolutionThe half life of a first order reaction is 30 min and the initial concentration of the reactant is 0.1 M . If the initial concentration of reactant is doubled ,then the half life of the reaction will be
View SolutionWhat will be the nature of the graph showing the concentration of the reactant and time of a first order reaction ?
View SolutionThe initial concentration of the reactant in a first order reaction is a . It takes time t for the completion of noth fraction of the reaction. Will it take time 2t for the completion of the same fraction if the initial concentration of the reactant is made twice ?
View SolutionHow does the initial concentration of the reactant in a first order reaction very with time ?
View SolutionShow that the time of a first order reaction takes for 'the nth' fraction of the initial concentration of its reactant to converted into product does not depend on the initial concentration of the reactant.
View SolutionFor a zero order reaction, the initial concentration of the reactant =[A]0 and after time 't' from the initiation of the reaction, the concentration =[A] . What will be the nature of the graph of '[A]' vs 't,
View SolutionPlot a graph of concentration of a reactant at time t, [ (a-x)] against time for a first order reaction .Here a = initial concentration of the reactant an x = change in concentration of the reactant at any time 1 during the reaction.
View SolutionFor a first order reaction, the concentration of reactant :
View SolutionWhich of the following is/are correct for the first order reaction ? (a is initial concentration of reactant, x is concentration of the reactant reacted and t is time)

View SolutionWhich of the following graphs represent a first order reaction (a=initial concentration of reactant, x=concentration of reactant consumed, t=time)

View SolutionC_(o) =initial concentration of the reactant C_(t) = concentration of the reactant at time t, k=rate constant of the reaction. Then the equation applicable for a first order reaction is
View SolutionFor a first order reaction, if ‘a’ is the initial concentration of reactant, then the half life time is
View Solution

