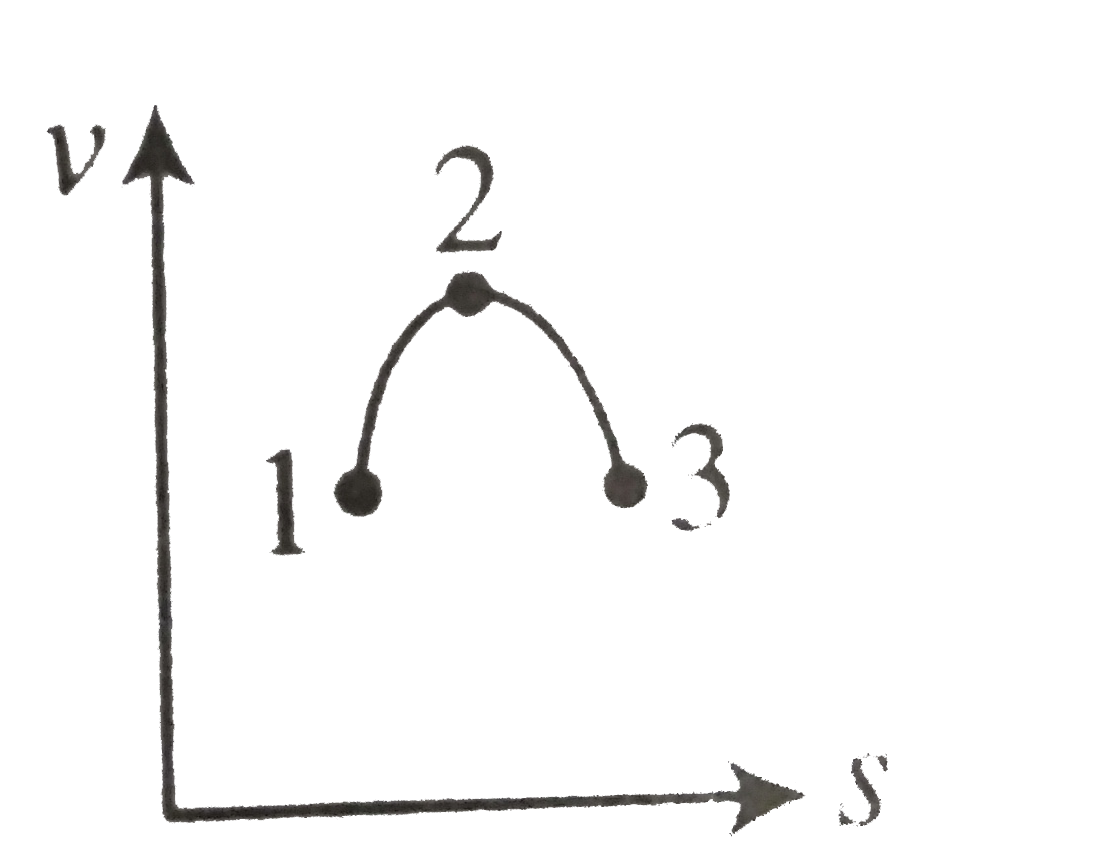
Figure shows the velocity-displacement curve for an object moving along a straight line. At which of the points marked is the object speeding up?
1
2
1 and 3
1 and 2
The correct Answer is:A
a=vdvdx=v× (slope of tangent in v- x graph )
Note : v is positive at all the point, So, the sign of acceleration depends on the slope.
At point 1 : slope >0⇒a>0andv>0 ⇒ speed increases.
At point 2 : Slope =0⇒a=0
At point 3: Slope =0⇒a<0andv>0⇒ Speed decreases.
Note : At point 2, velocity is attaining a maximum value as it decreases, later.
Similar Questions
Knowledge Check
The given figure shows the velocity versus time curve for a car traveling along a straight line. Which of the following statements is false ?
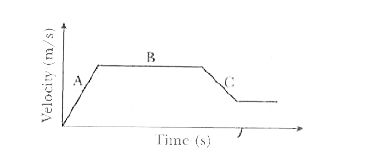 ANet forces act on the car during intervals A and C.BOpposing forces may be acting on the car during interval B.COpposing forces may be acting on the car during interval C.DThe magnitude of the net force acting duriing interval A is less then that during C.
Velocity displacement graph of a particle moving in a straight line is as shown in figure.
 Amagnitude of acceleration of particle is decreasingBmagnitude of acceleration of particlre is increasingCacceleration versus displacement graph straight lineDacceleration versus displacement graph is parabola
The figure shows velocity-time graph of a particle moving along a straight line. Identify the correct statement.
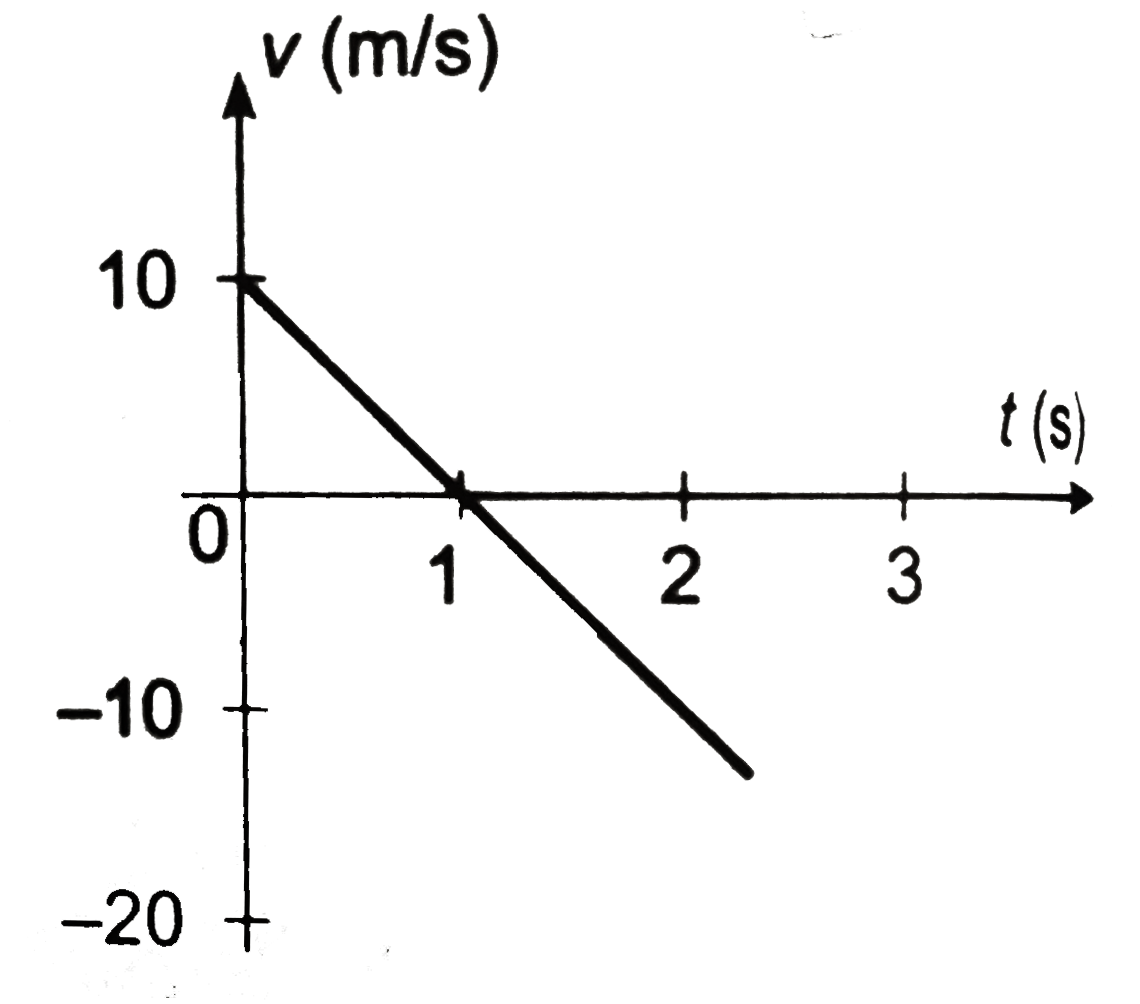 AThe particle starts from the originBThe particle crosses it initial position at t=2sCThe average speed of the particle in the time interval, 0≤t≤2s is zeroDAll of the above
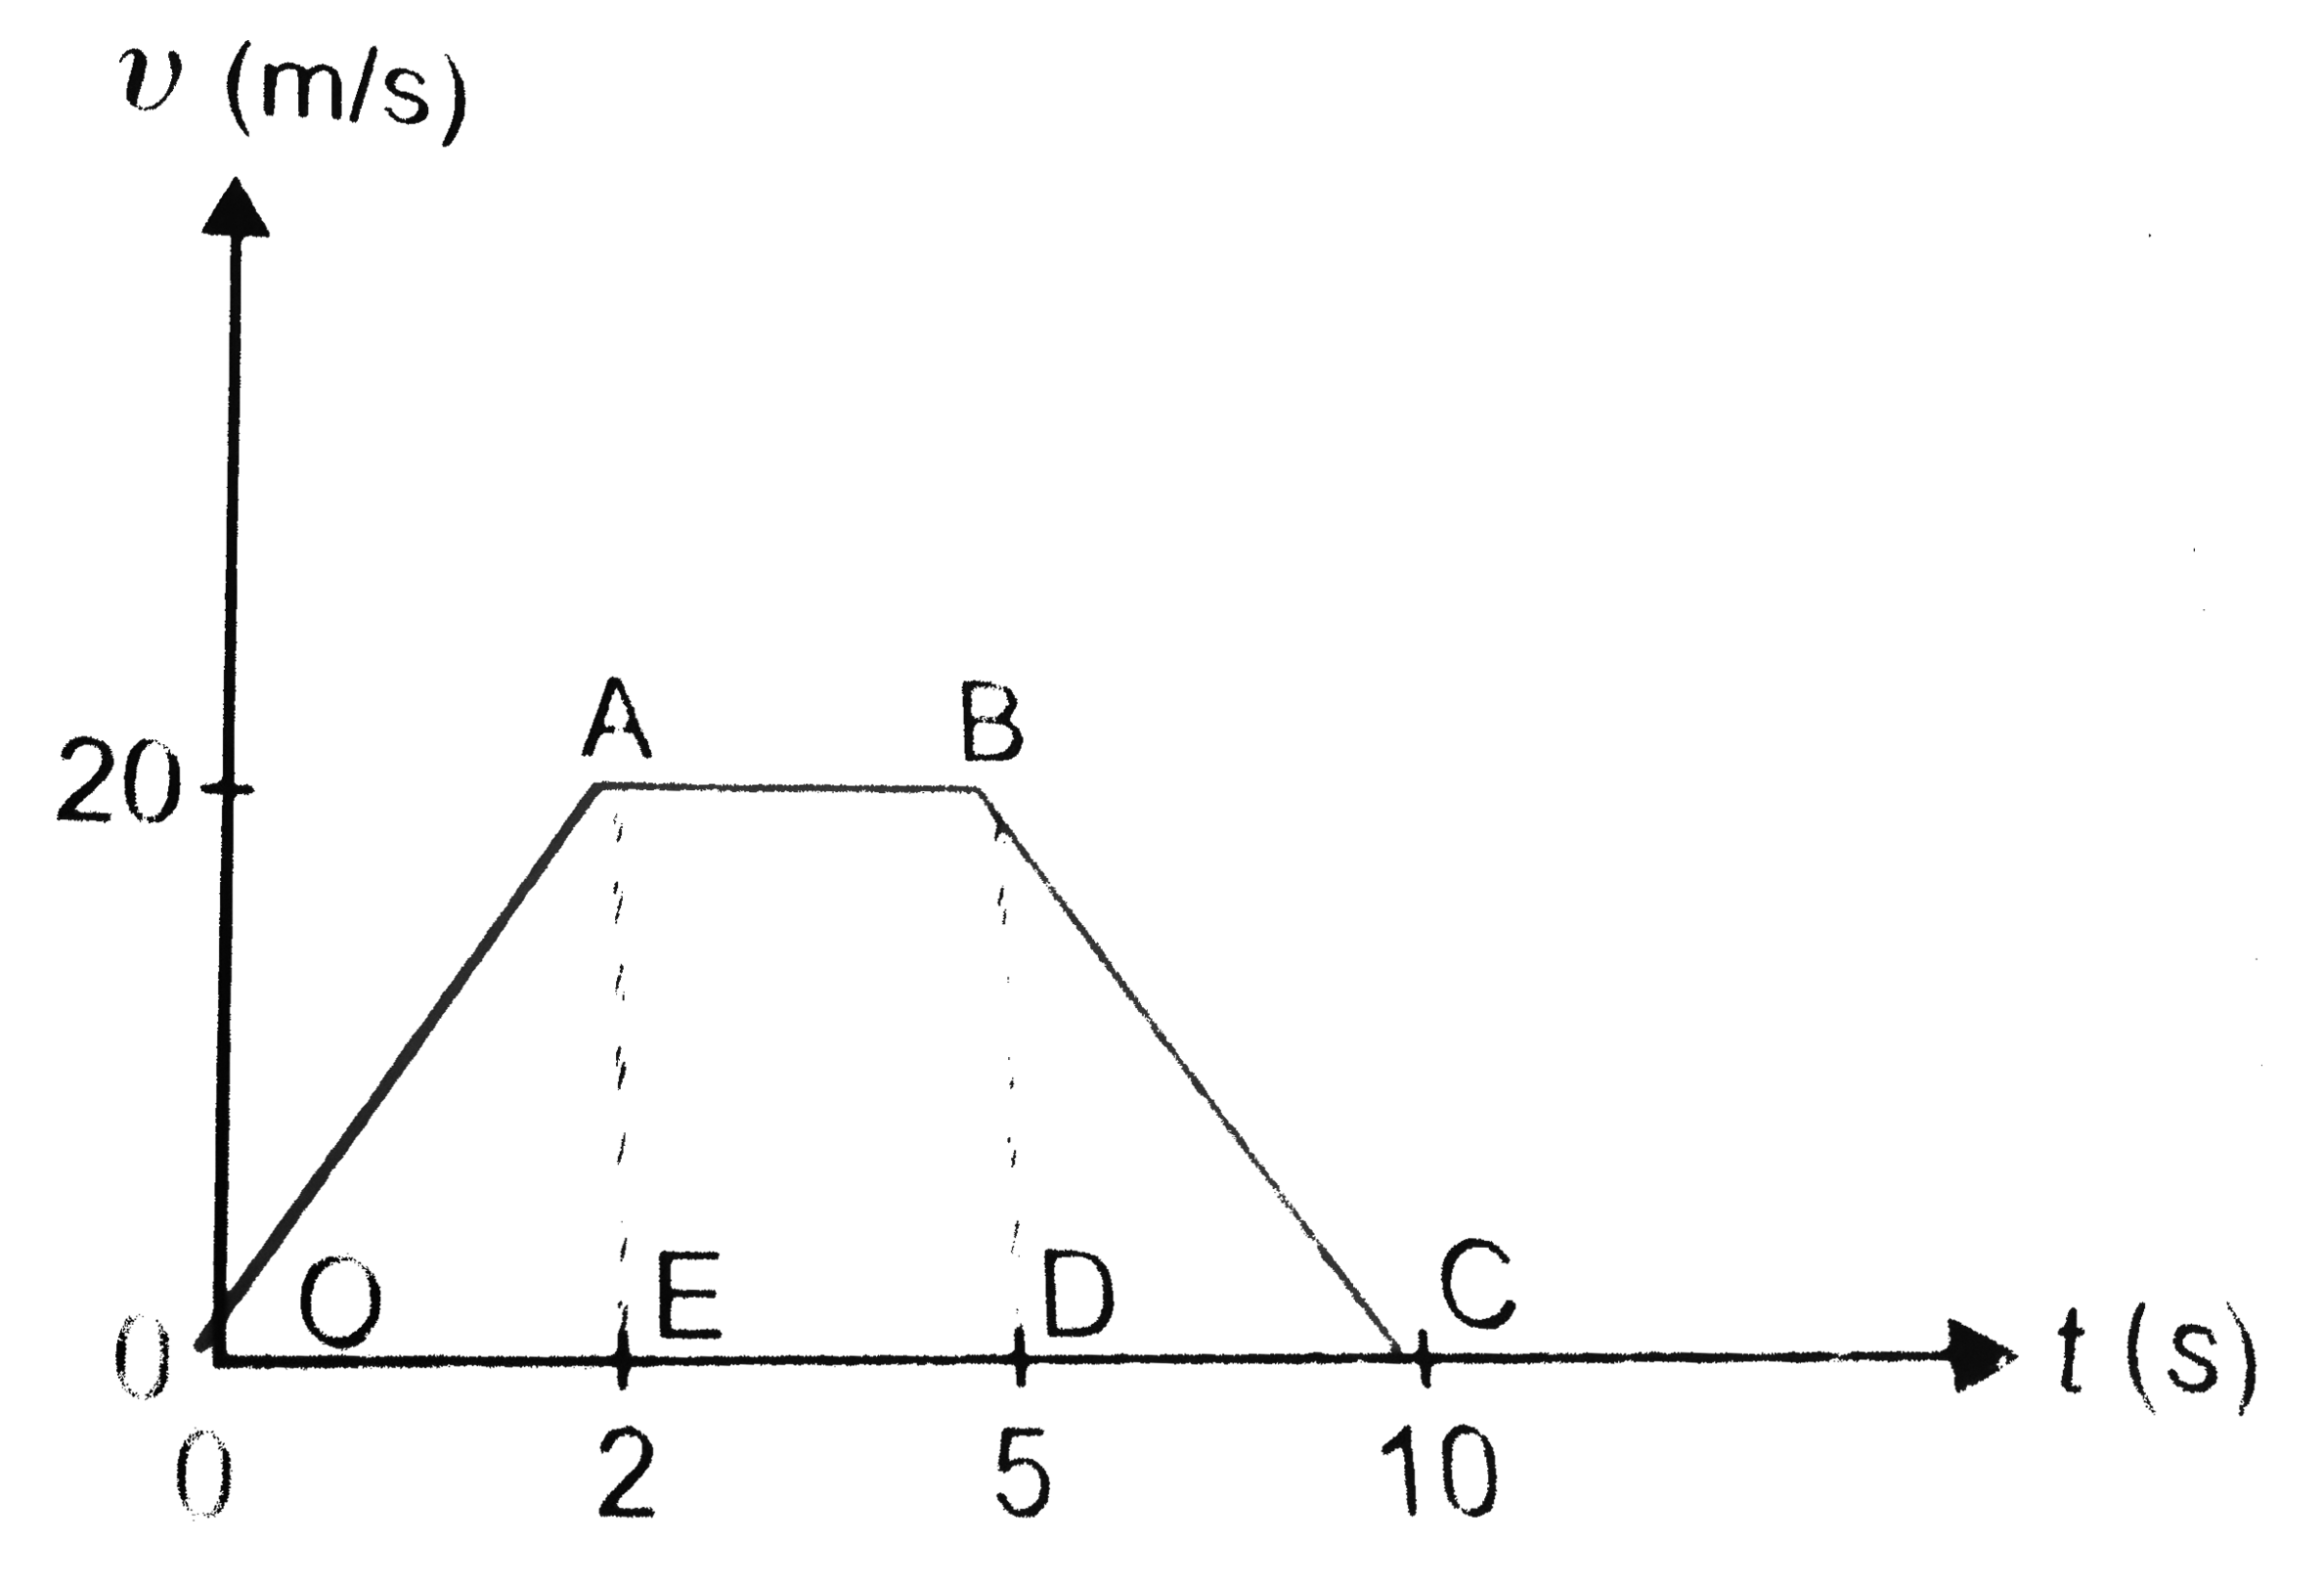
The velocity (u)-time (t) graph of an object moving along a straight line is as shown is Fig. 2 (b) . 30. Calculate the distance covered by object between (i)t=0→t=5s (ii) t=0→t=10s.
 .
.
View SolutionThe velocity (u)-time (t) graph of an object moving along a straight line is as shown is Fig. 2 (b) . 30. Calculate the distance covered by object between (i)t=0→t=5s (ii) t=0→t=10s.
 .
.
View SolutionThe figure shows a velocity-time graph of a particle moving along a straight line
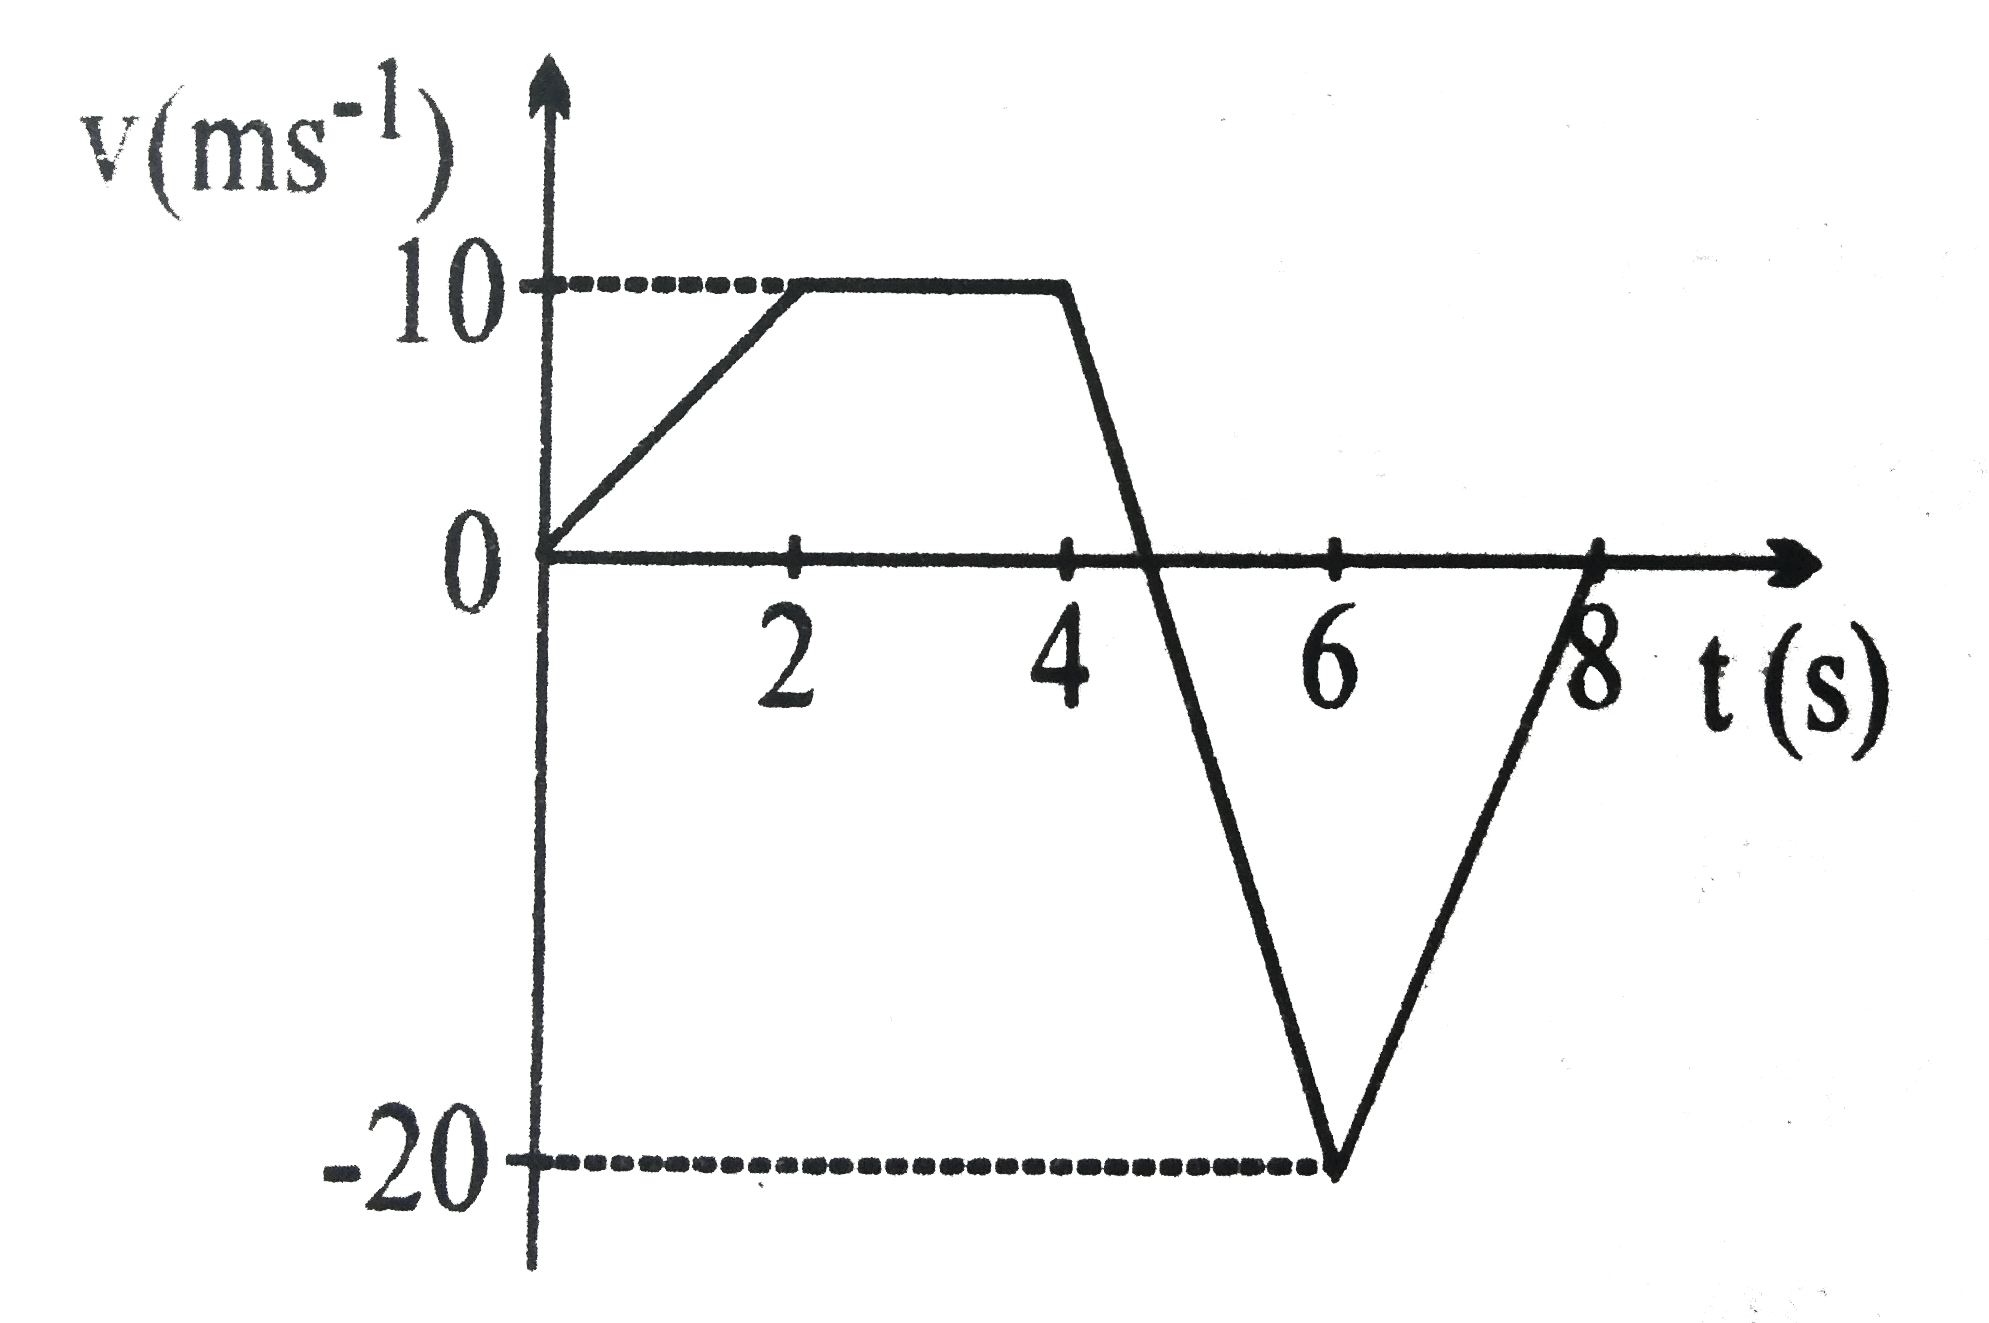
The maximum displacement of the particle is
View Solution
The velocity displacement graph of a particle moving along a straight line is shown in figure.
Then the acceleration displacement graph is.
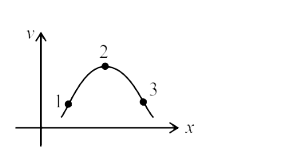
View SolutionThe v-x graph for a particle moving along a straight line is shown in the figure. At which of the points marked, the acceleration is negative?
View Solution