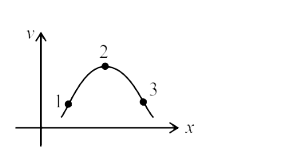
The v-x graph for a particle moving along a straight line is shown in the figure. At which of the points marked, the acceleration is negative?
A
1
B
3
C
1 and 2
D
3 and 2
Video Solution
Text Solution
The correct Answer is:B
Acceleration , a=vdvdx
v>0 always. , dvdx<0at3 ⇒a<3
|
Similar Questions
Knowledge Check
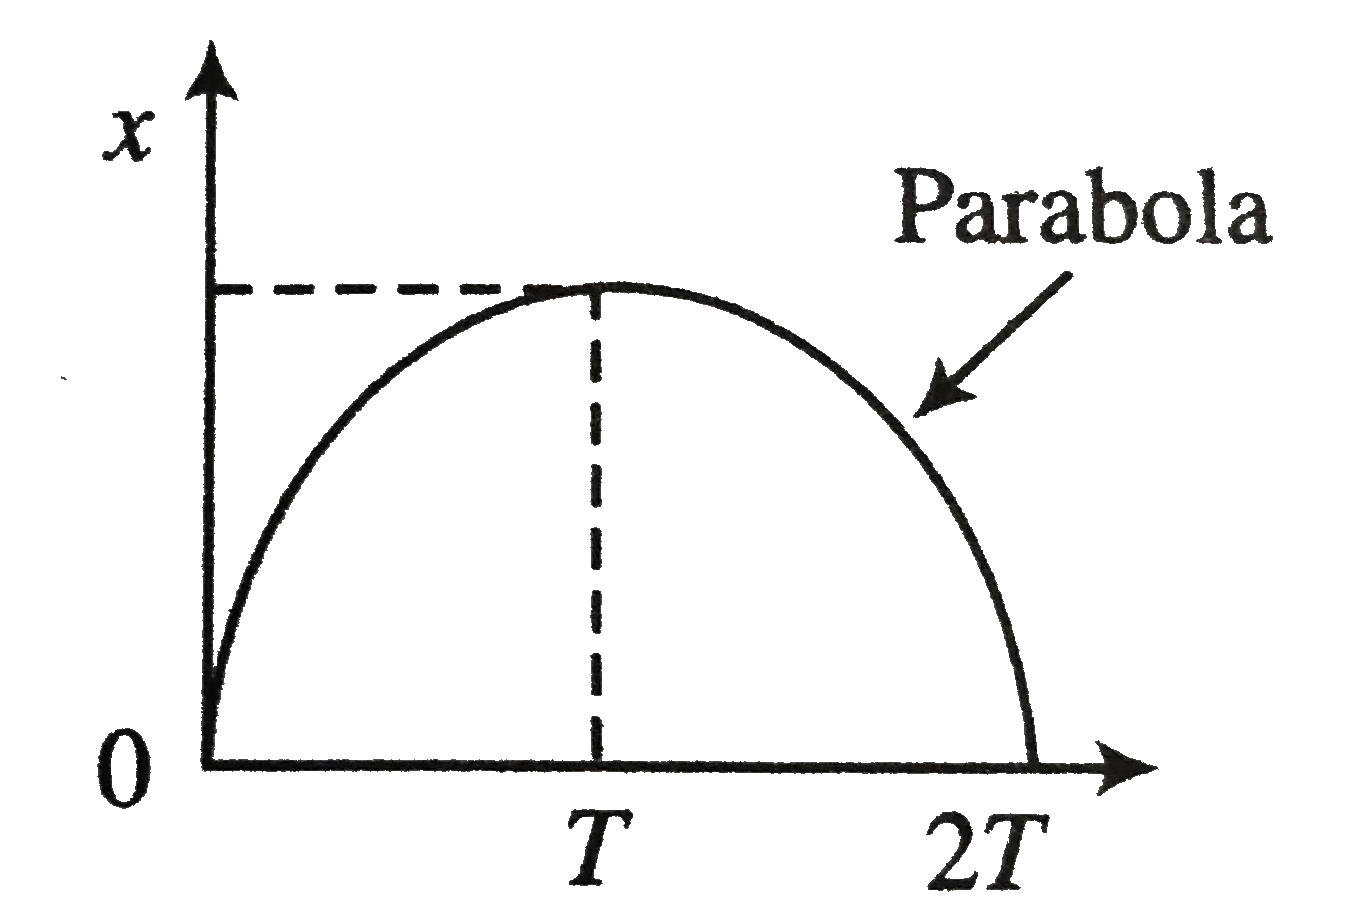
Displacement time graph of a particle moving in a straight line is a shown in figure.
 Ain region A acceleration is positiveBin region B acceleration is negativeCin region C acceleration is positiveDin region D acceleration is negative
The x-t graph of a particle moving along a straight line is shown in figure

The v-t graph of the particle is correctly shown byA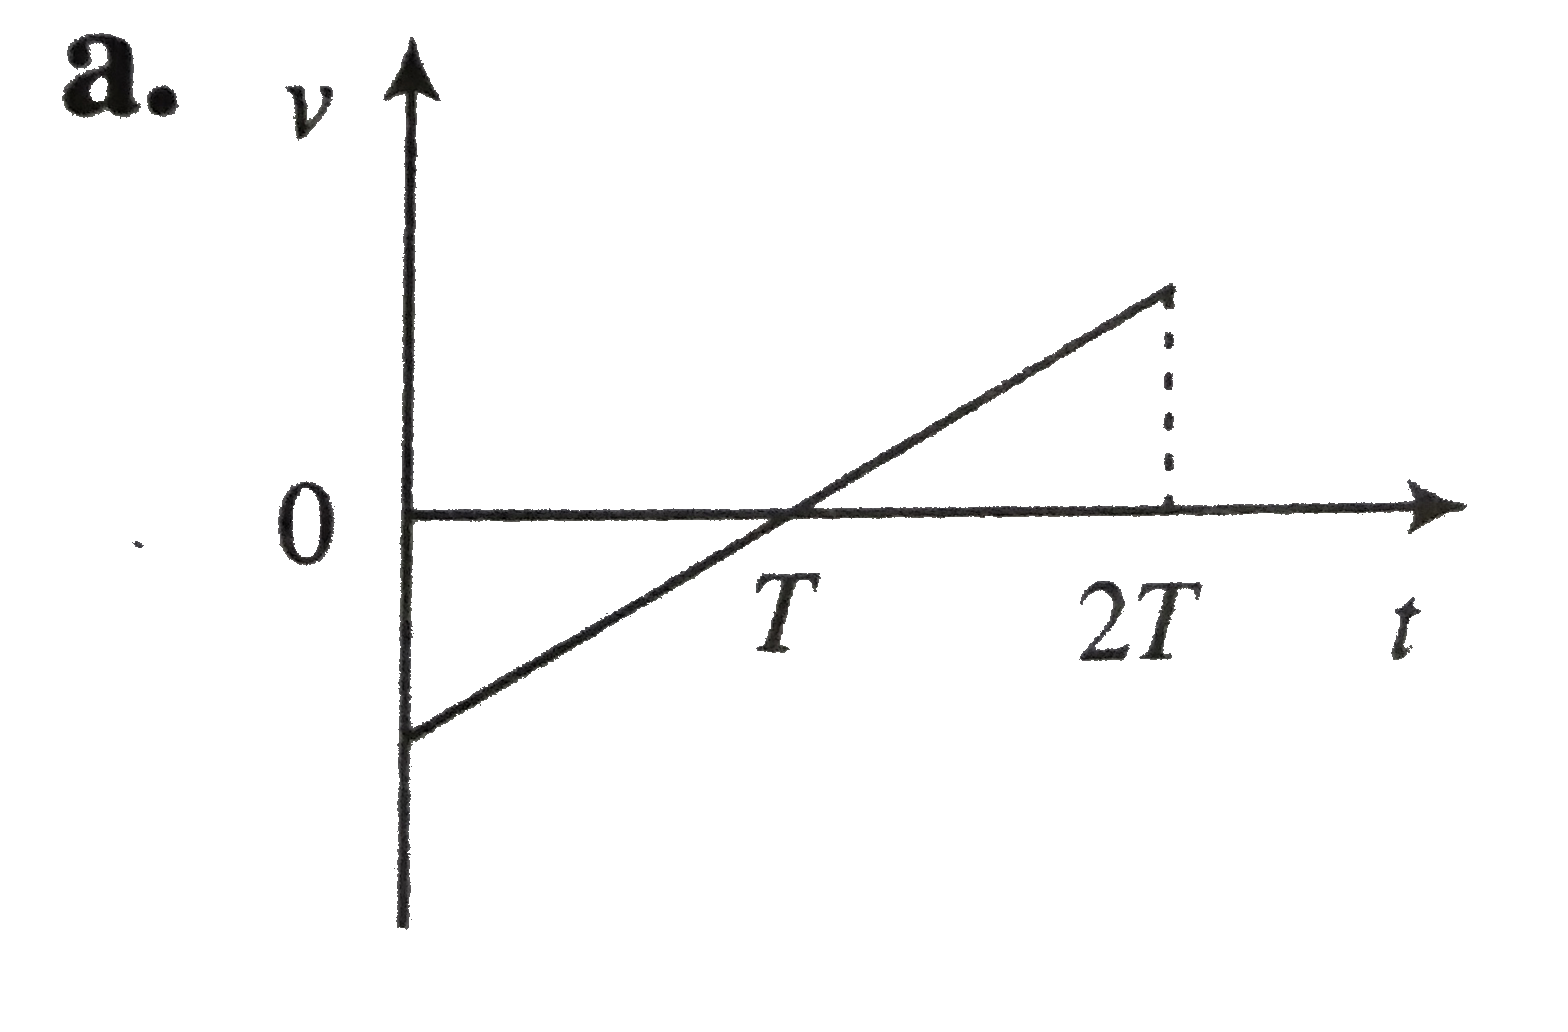 B
B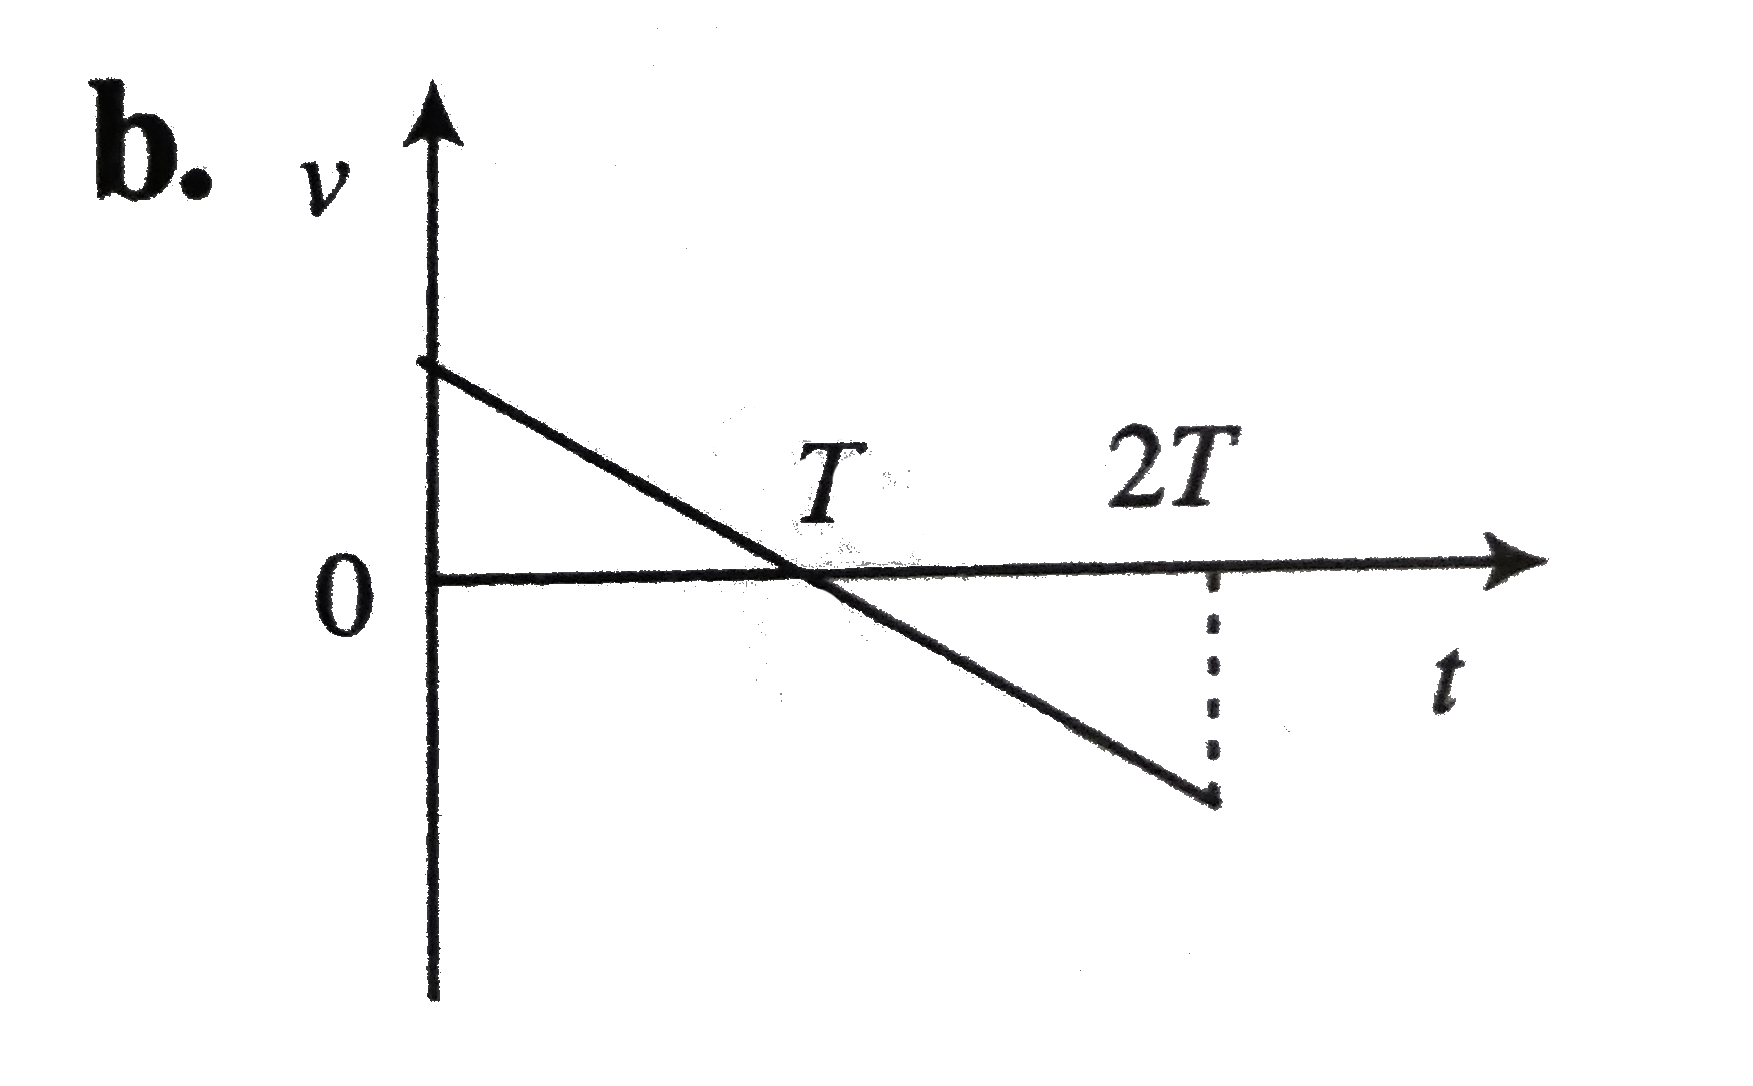 C
C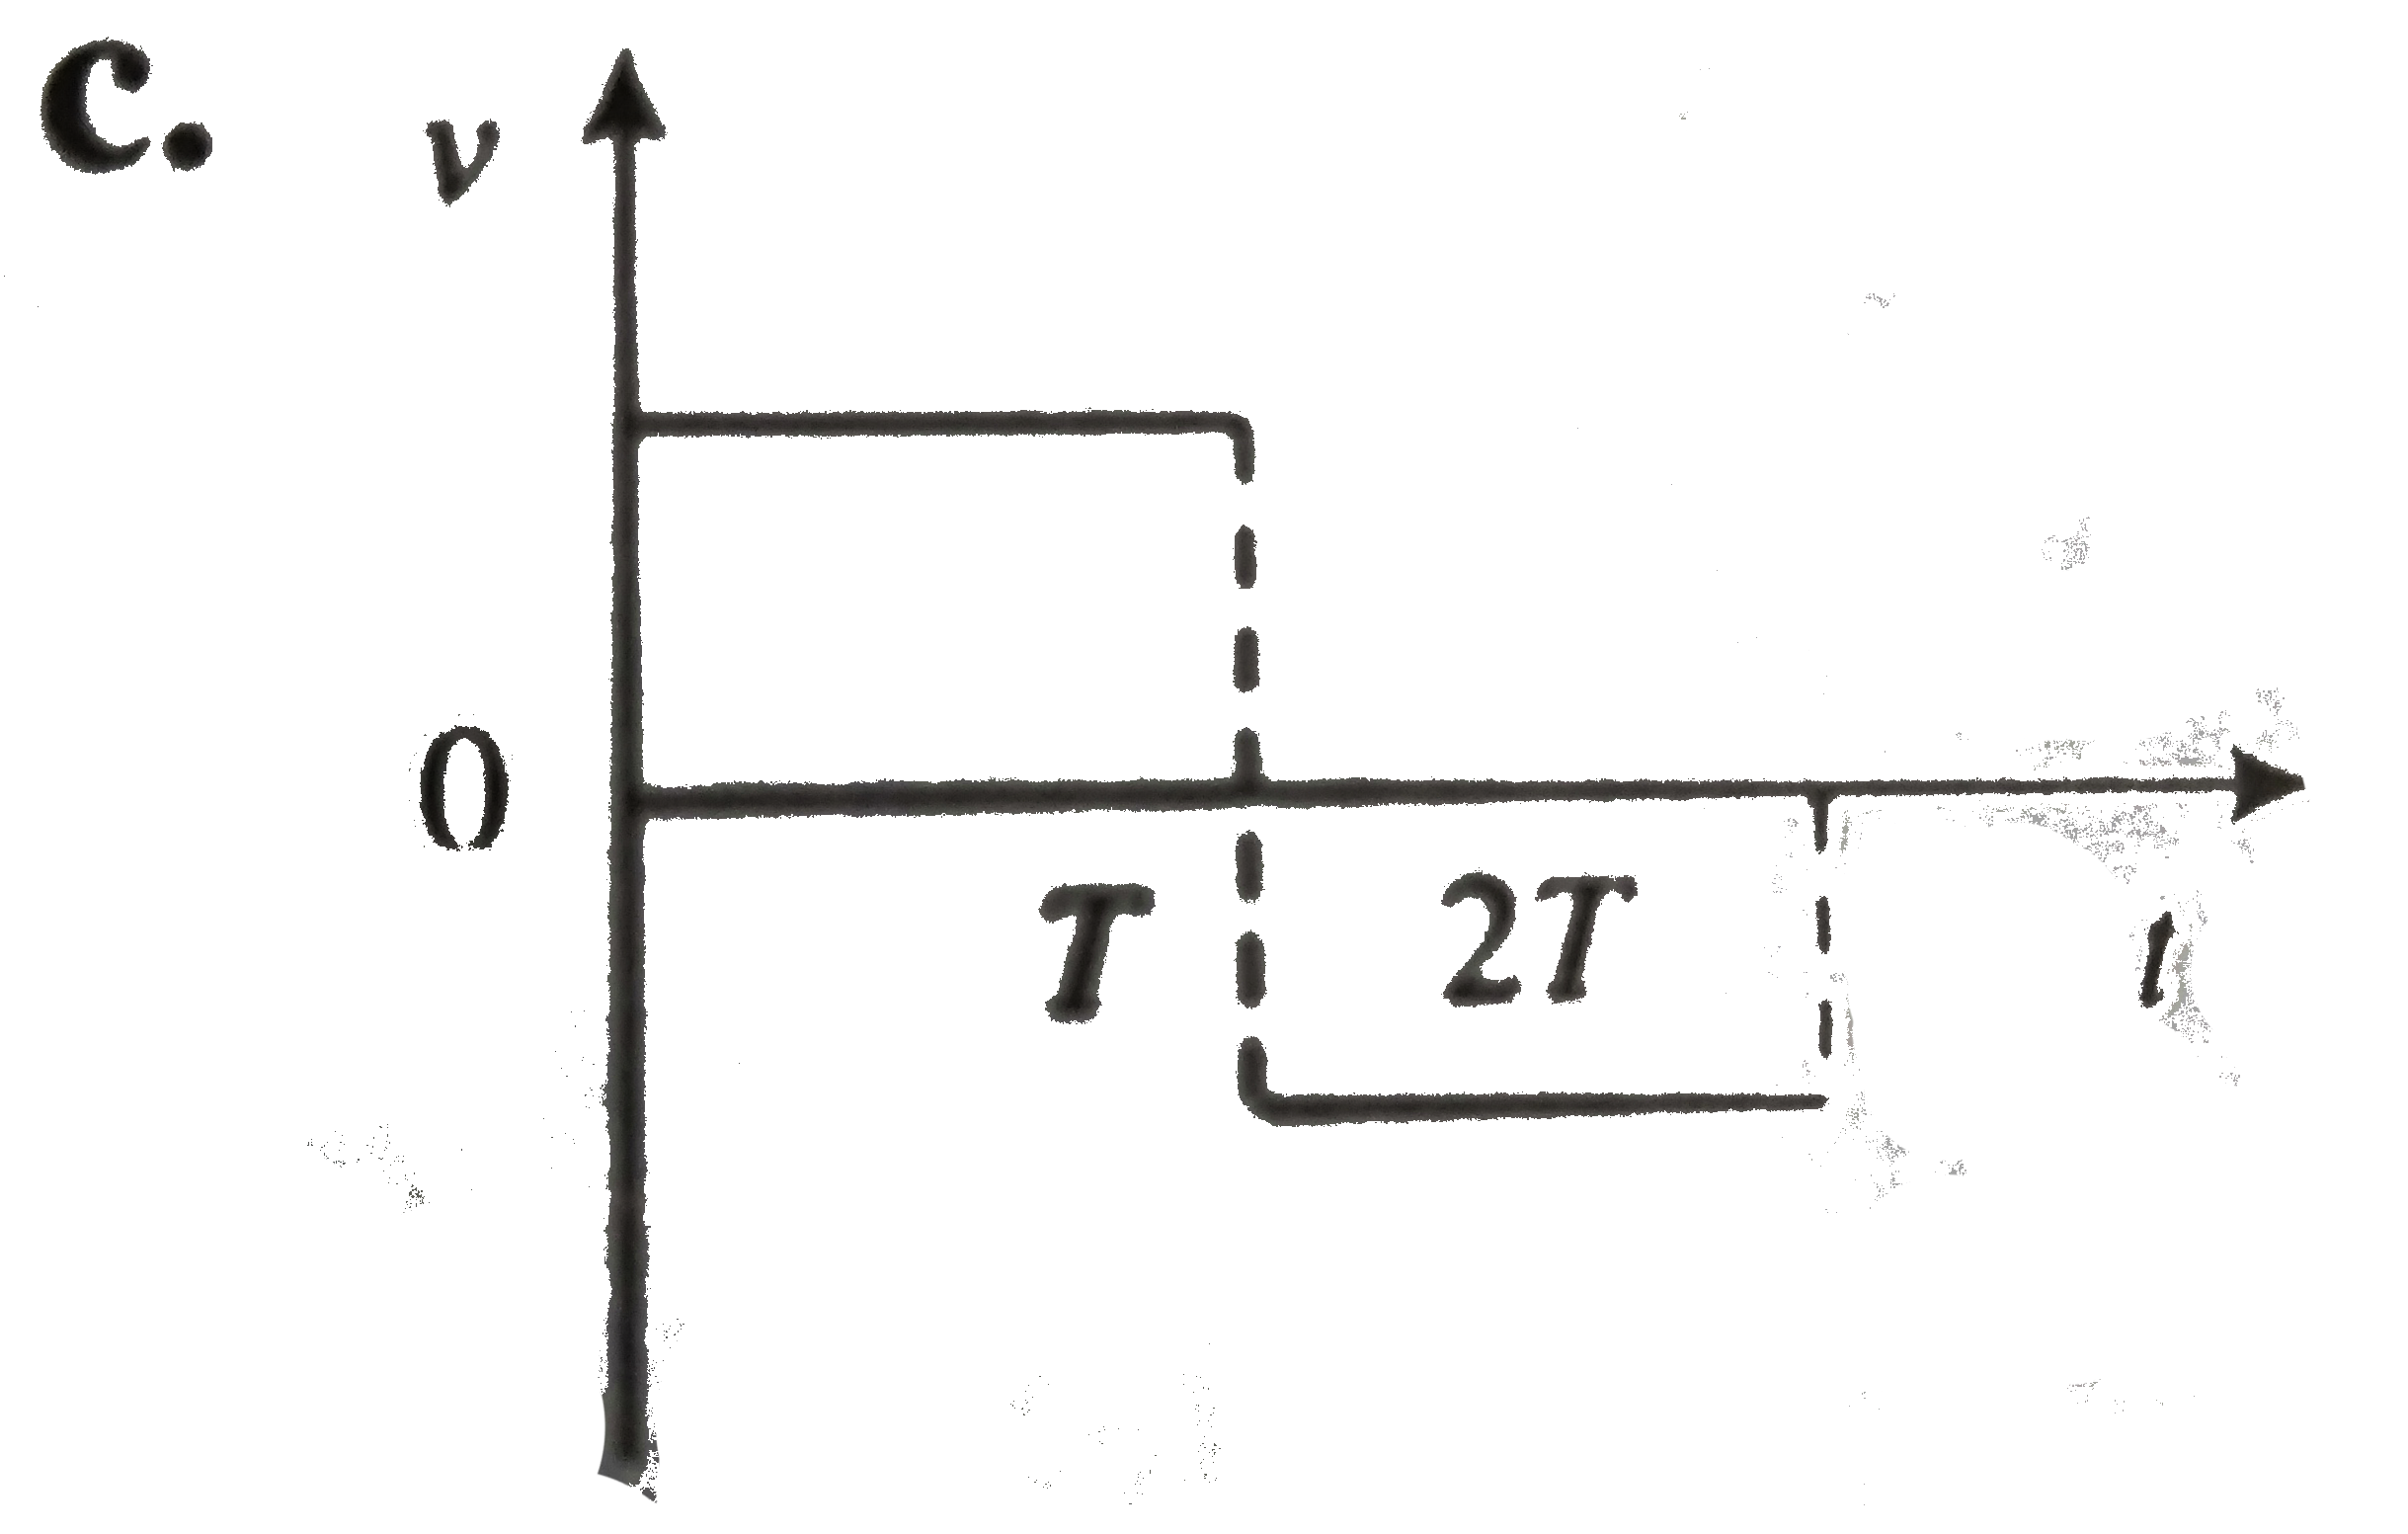 D
D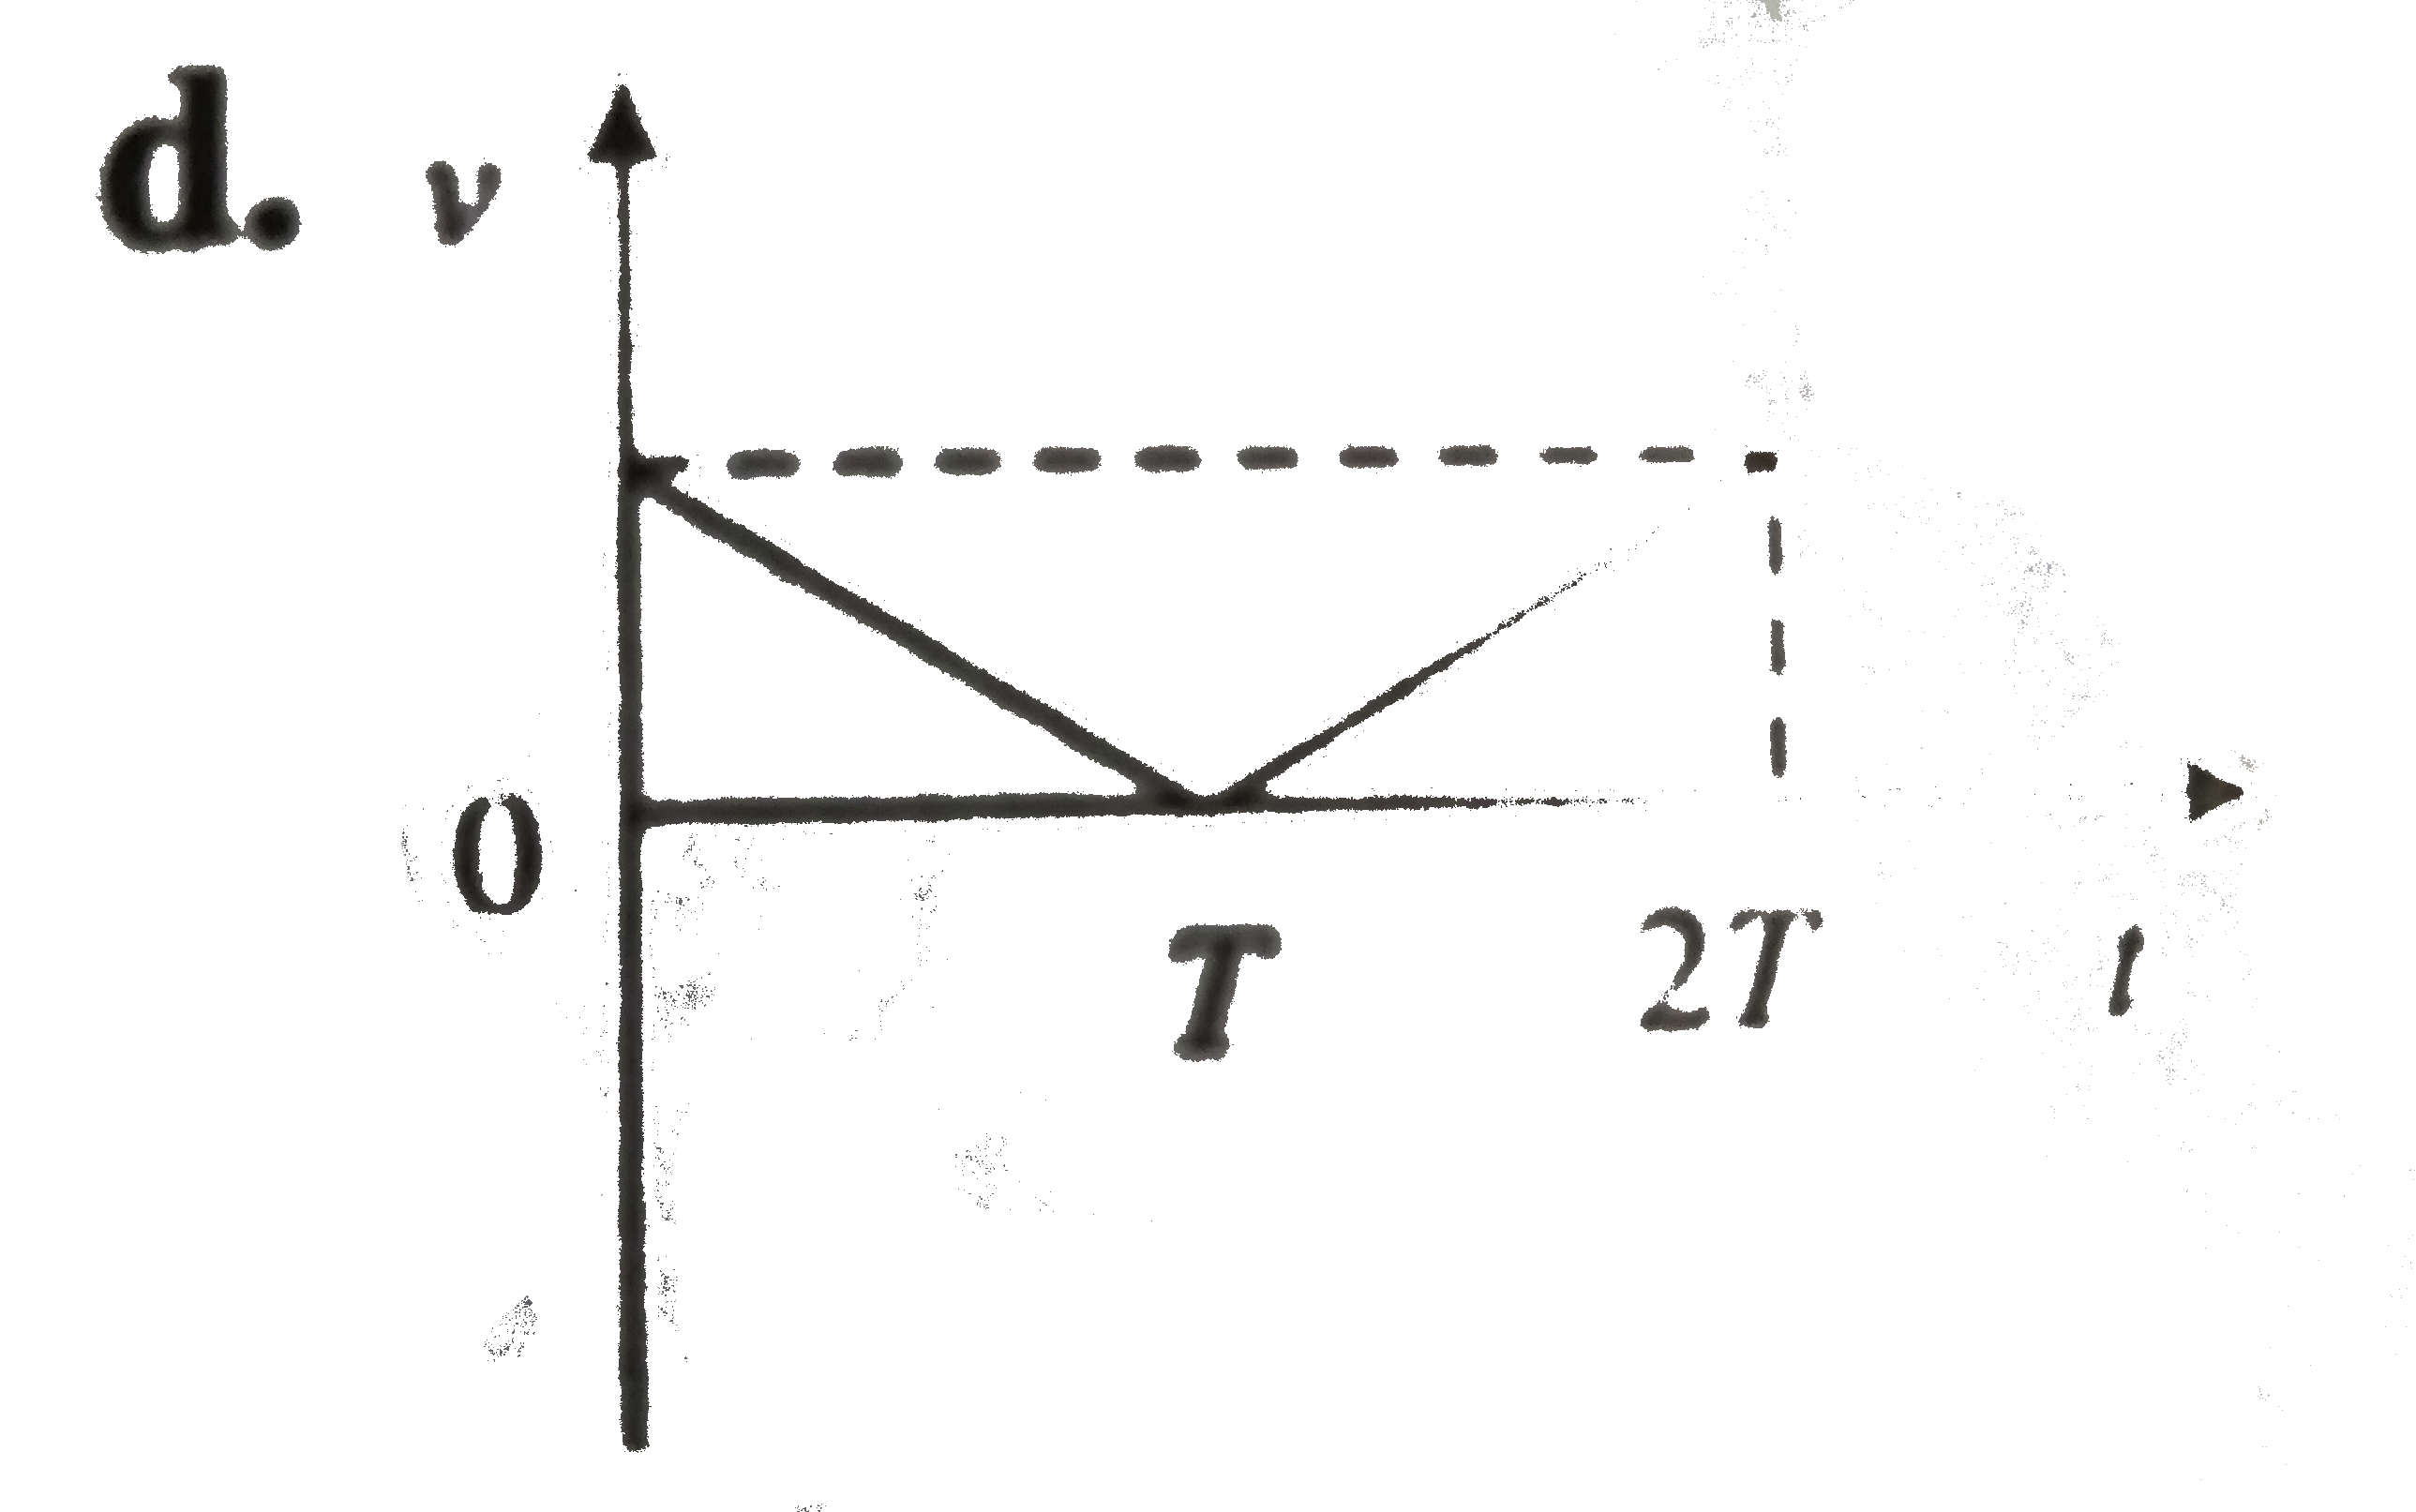
The x−t graph of particle moving along a straight line is shown in figure
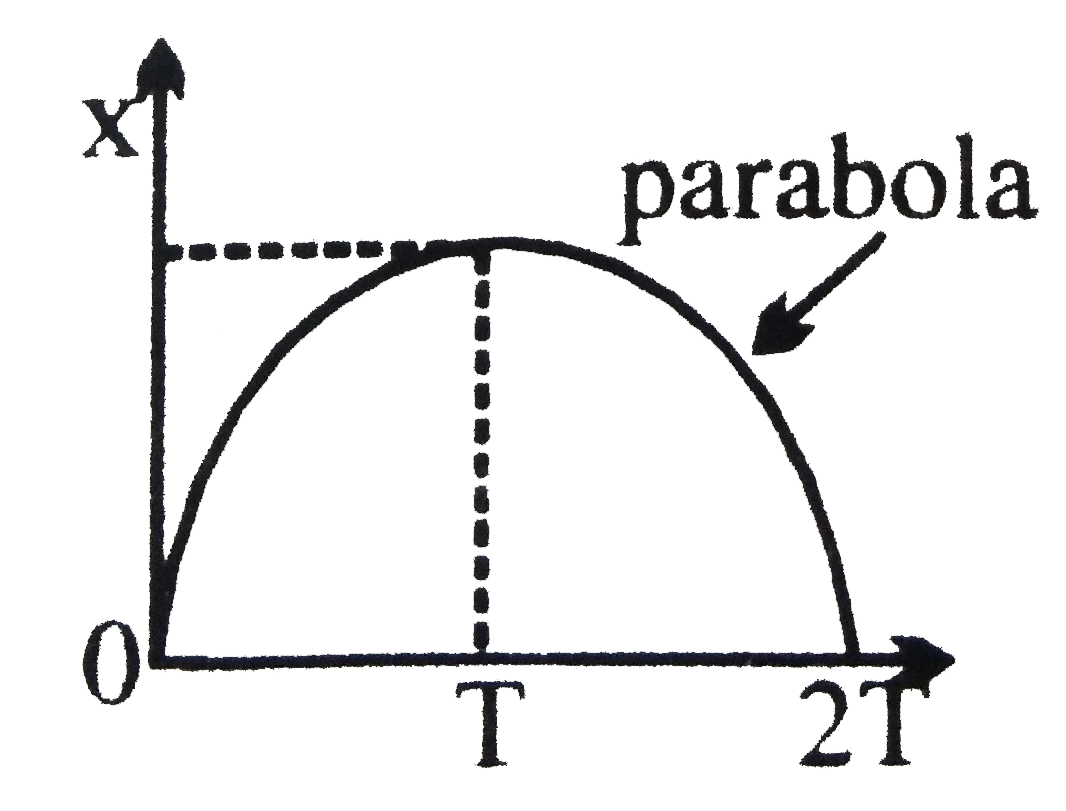
The a−t graph of the particle is correctly shown byA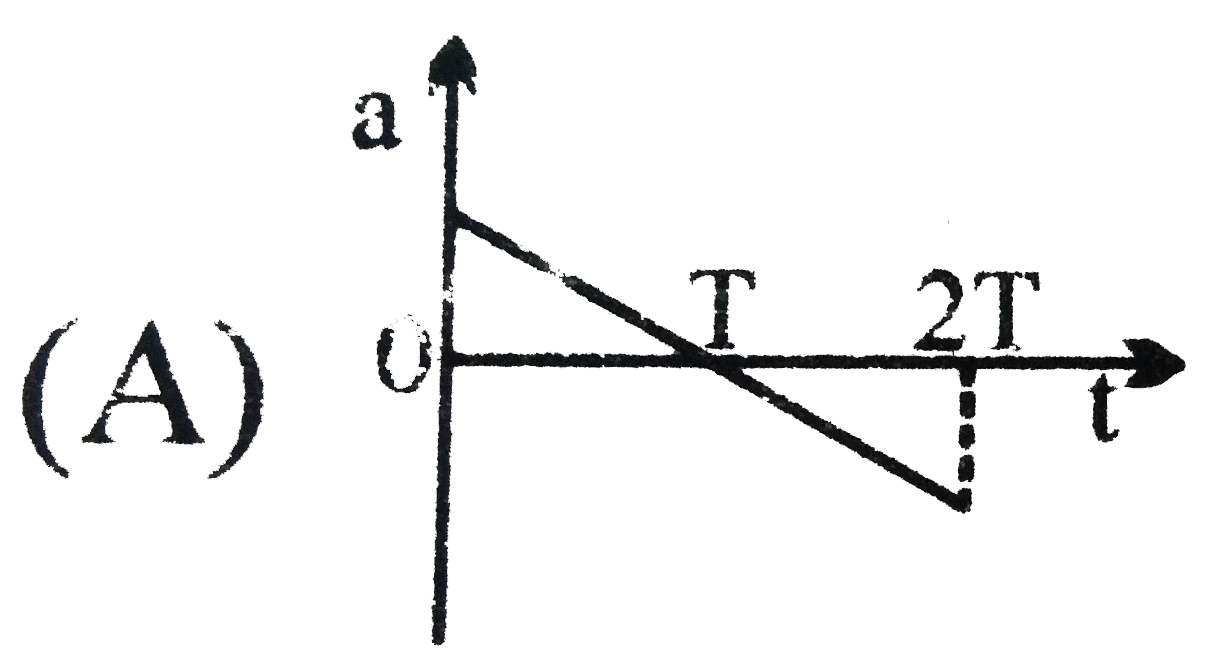 B
B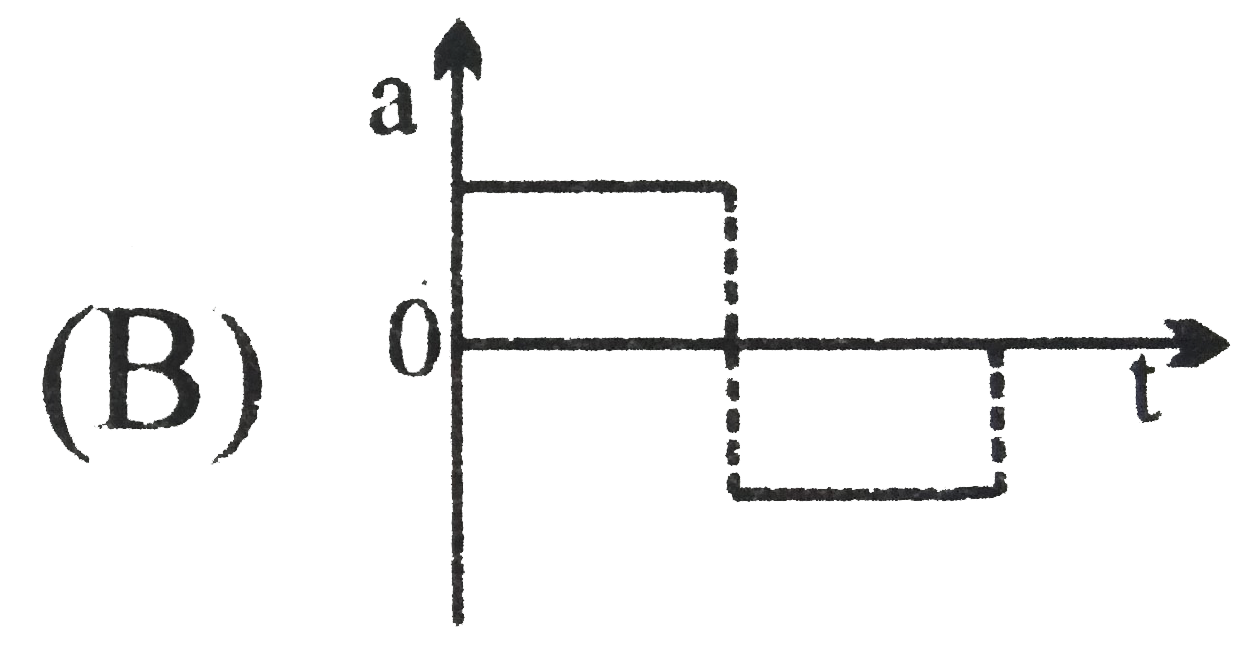 C
C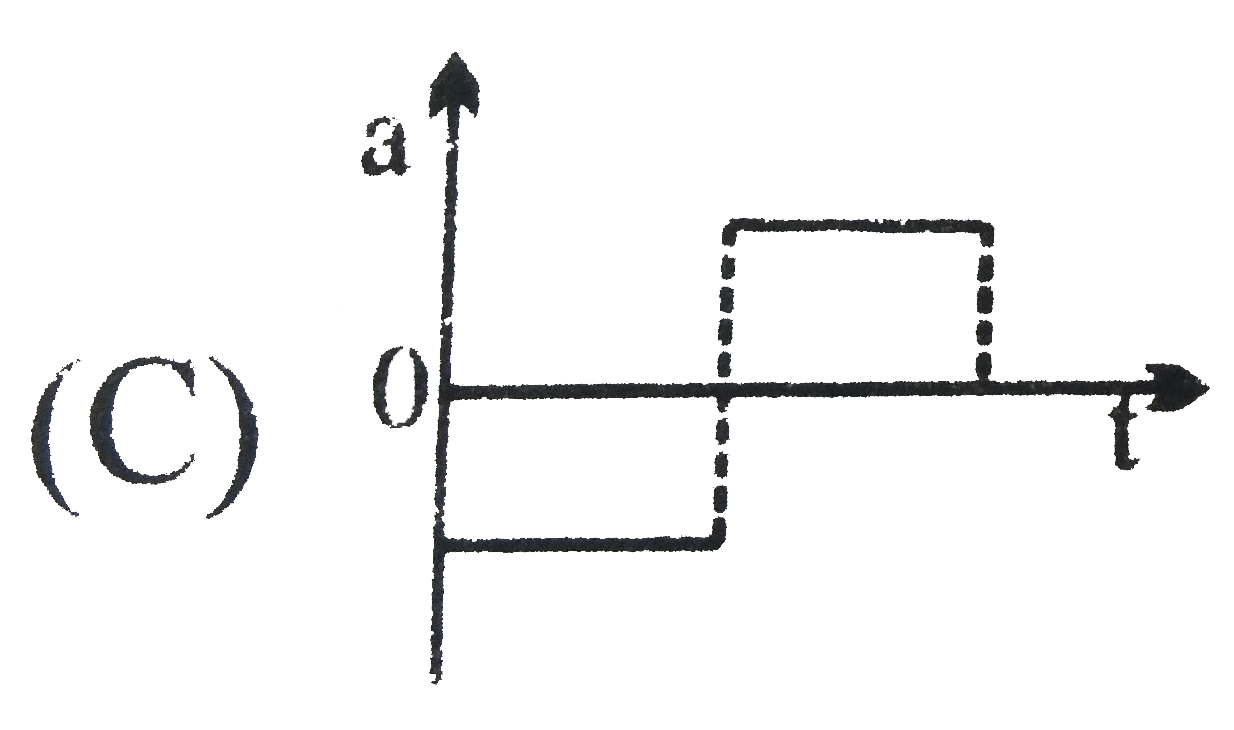 D
D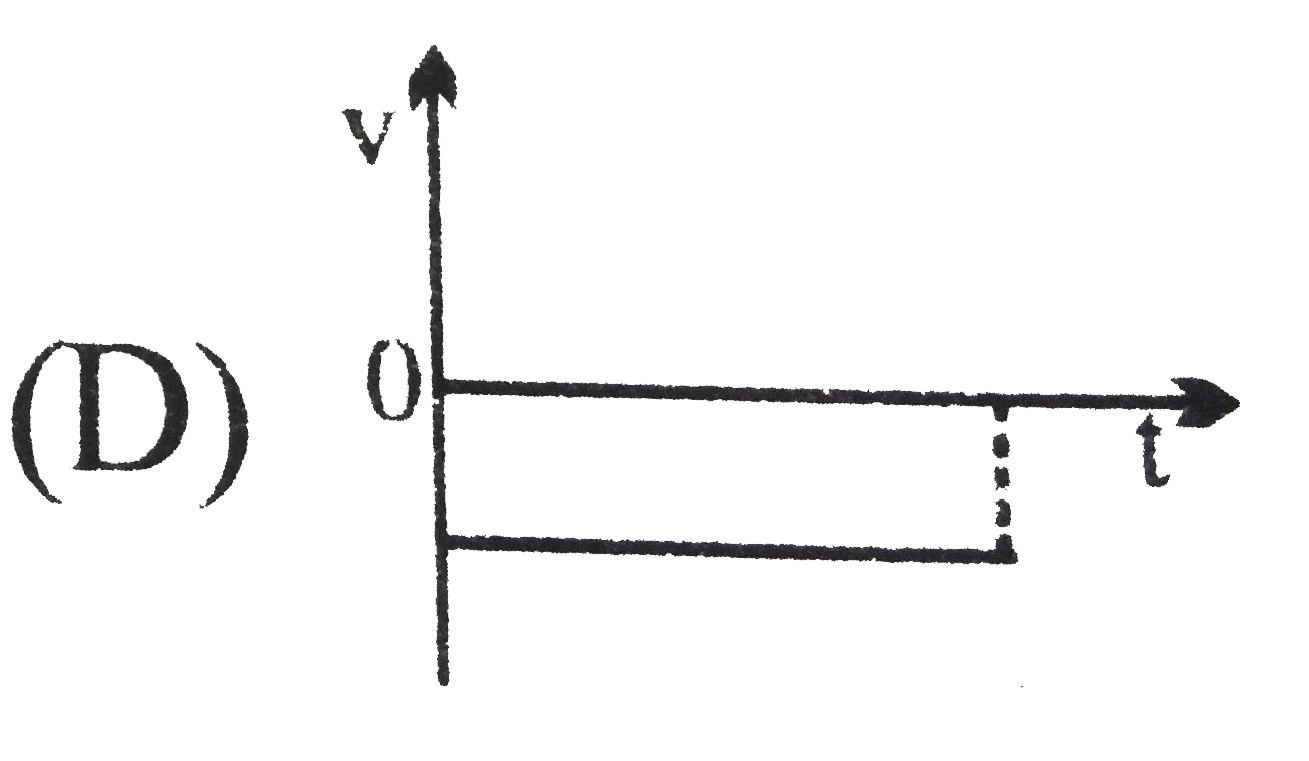

The velocity displacement graph of a particle moving along a straight line is shown in figure.
Then the acceleration displacement graph is.
View SolutionVelocity displacement graph of a particle moving in a straight line is as shown in figure.

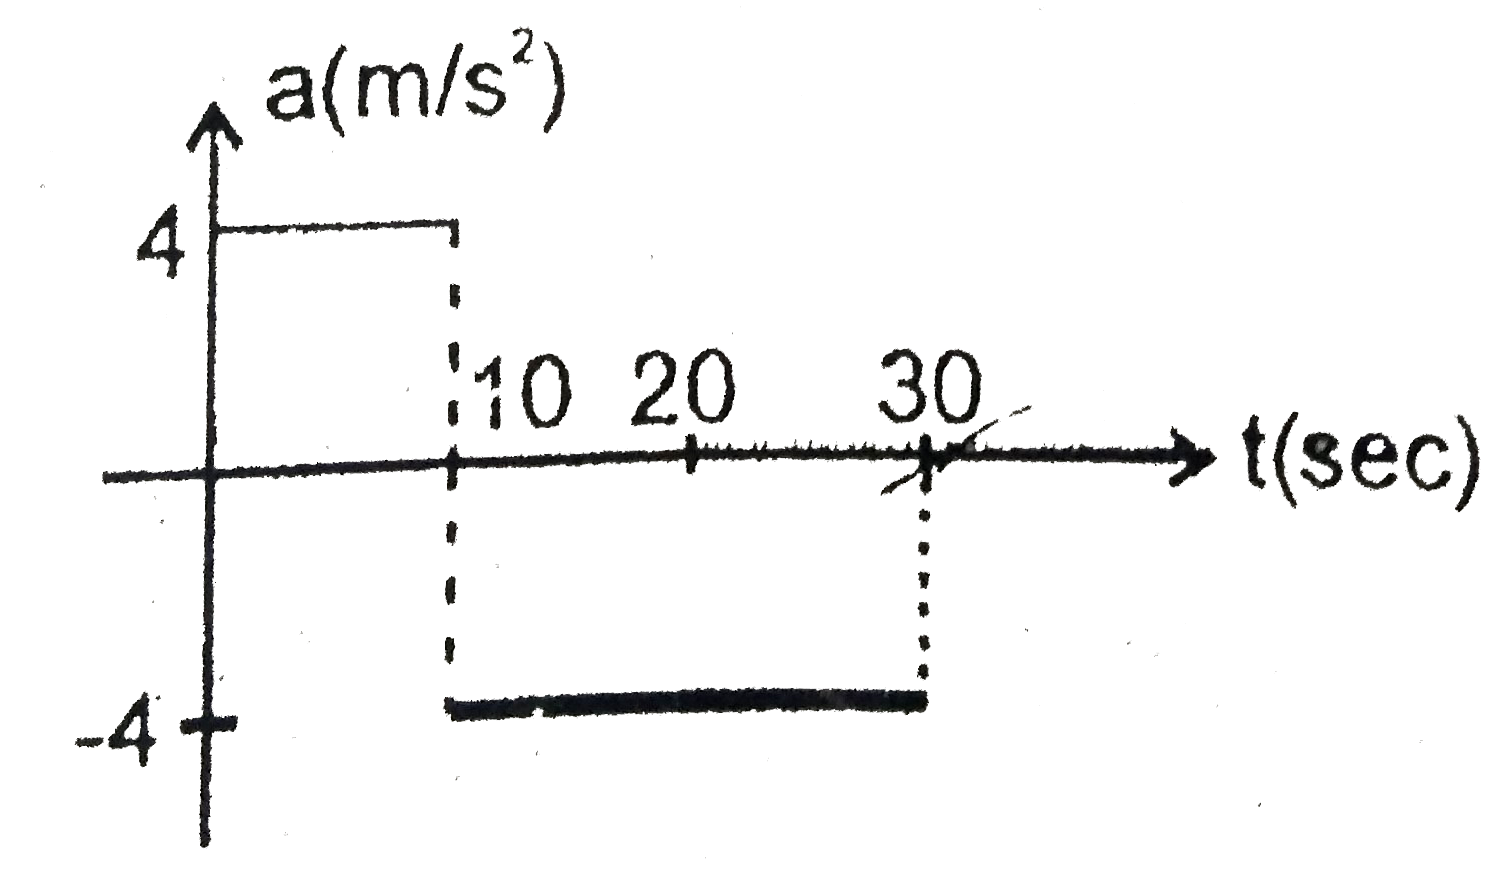
View SolutionThe acceleration versus time graph for a particle moving along a straight line is shown in the figure. If the particle starts from rest at t = 0, then its speed at t = 30 sec will be :
View SolutionThe x−t graph of particle moving along a straight line is shown in figure
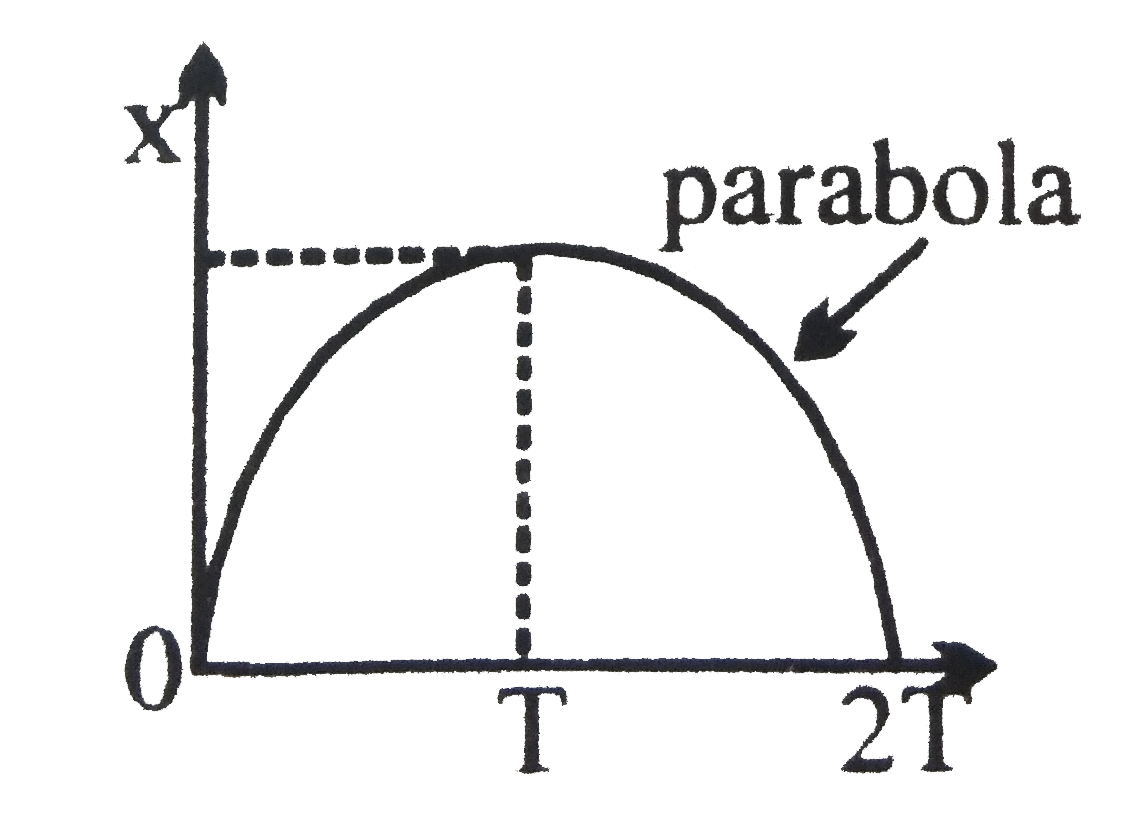
The v−t graph of the particles is correctly shown by
View SolutionThe x-t graph of a particle moving along a straight line is shown in figure
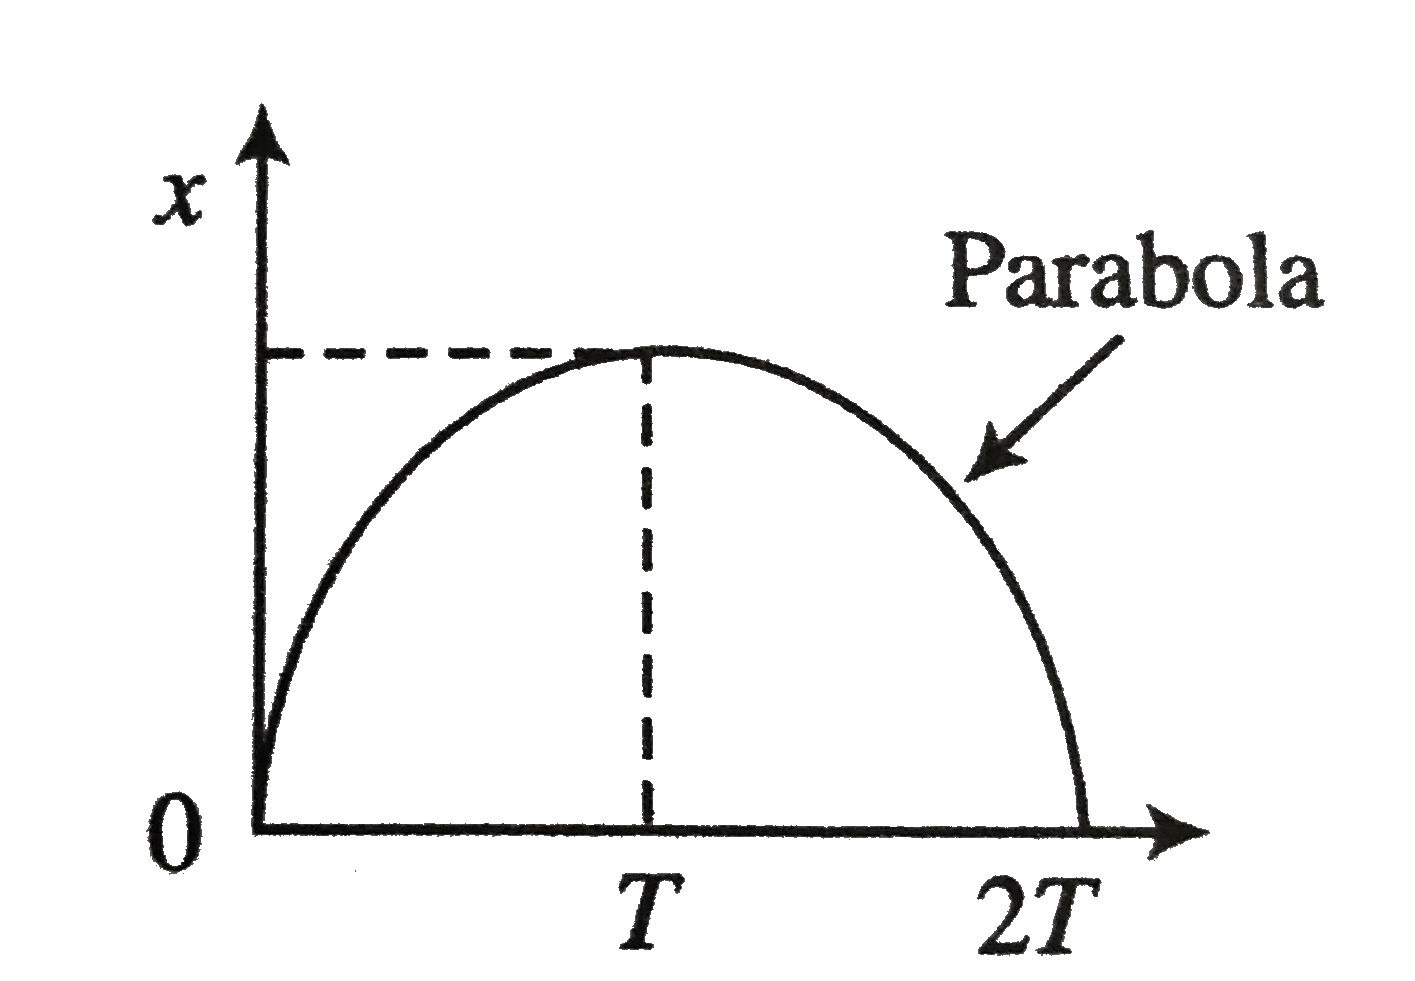
The speed-time graph of the particle is correctly shown by
View Solution


