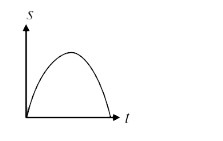
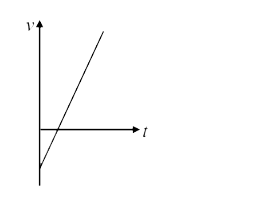
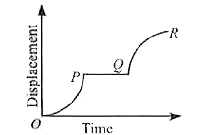
The graph of displacement vs time for a particle moving along a straight line is as shown. The best option for the corresponding velocity - time graph will be:
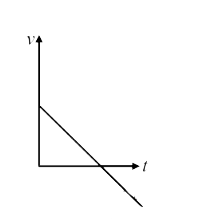
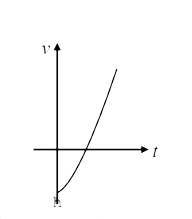
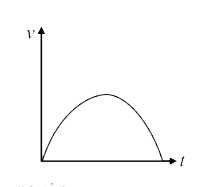
The correct Answer is:A
Slope of displacement time graph is velocity. As we can see from the original graph, slope is initially positive. It decreases with time, becomes zero, and then becomes negative. Therefore, the velocity will also be initially positive,decrease to zero and then become negative. This means that (A) is the most appropriate option.
Similar Questions
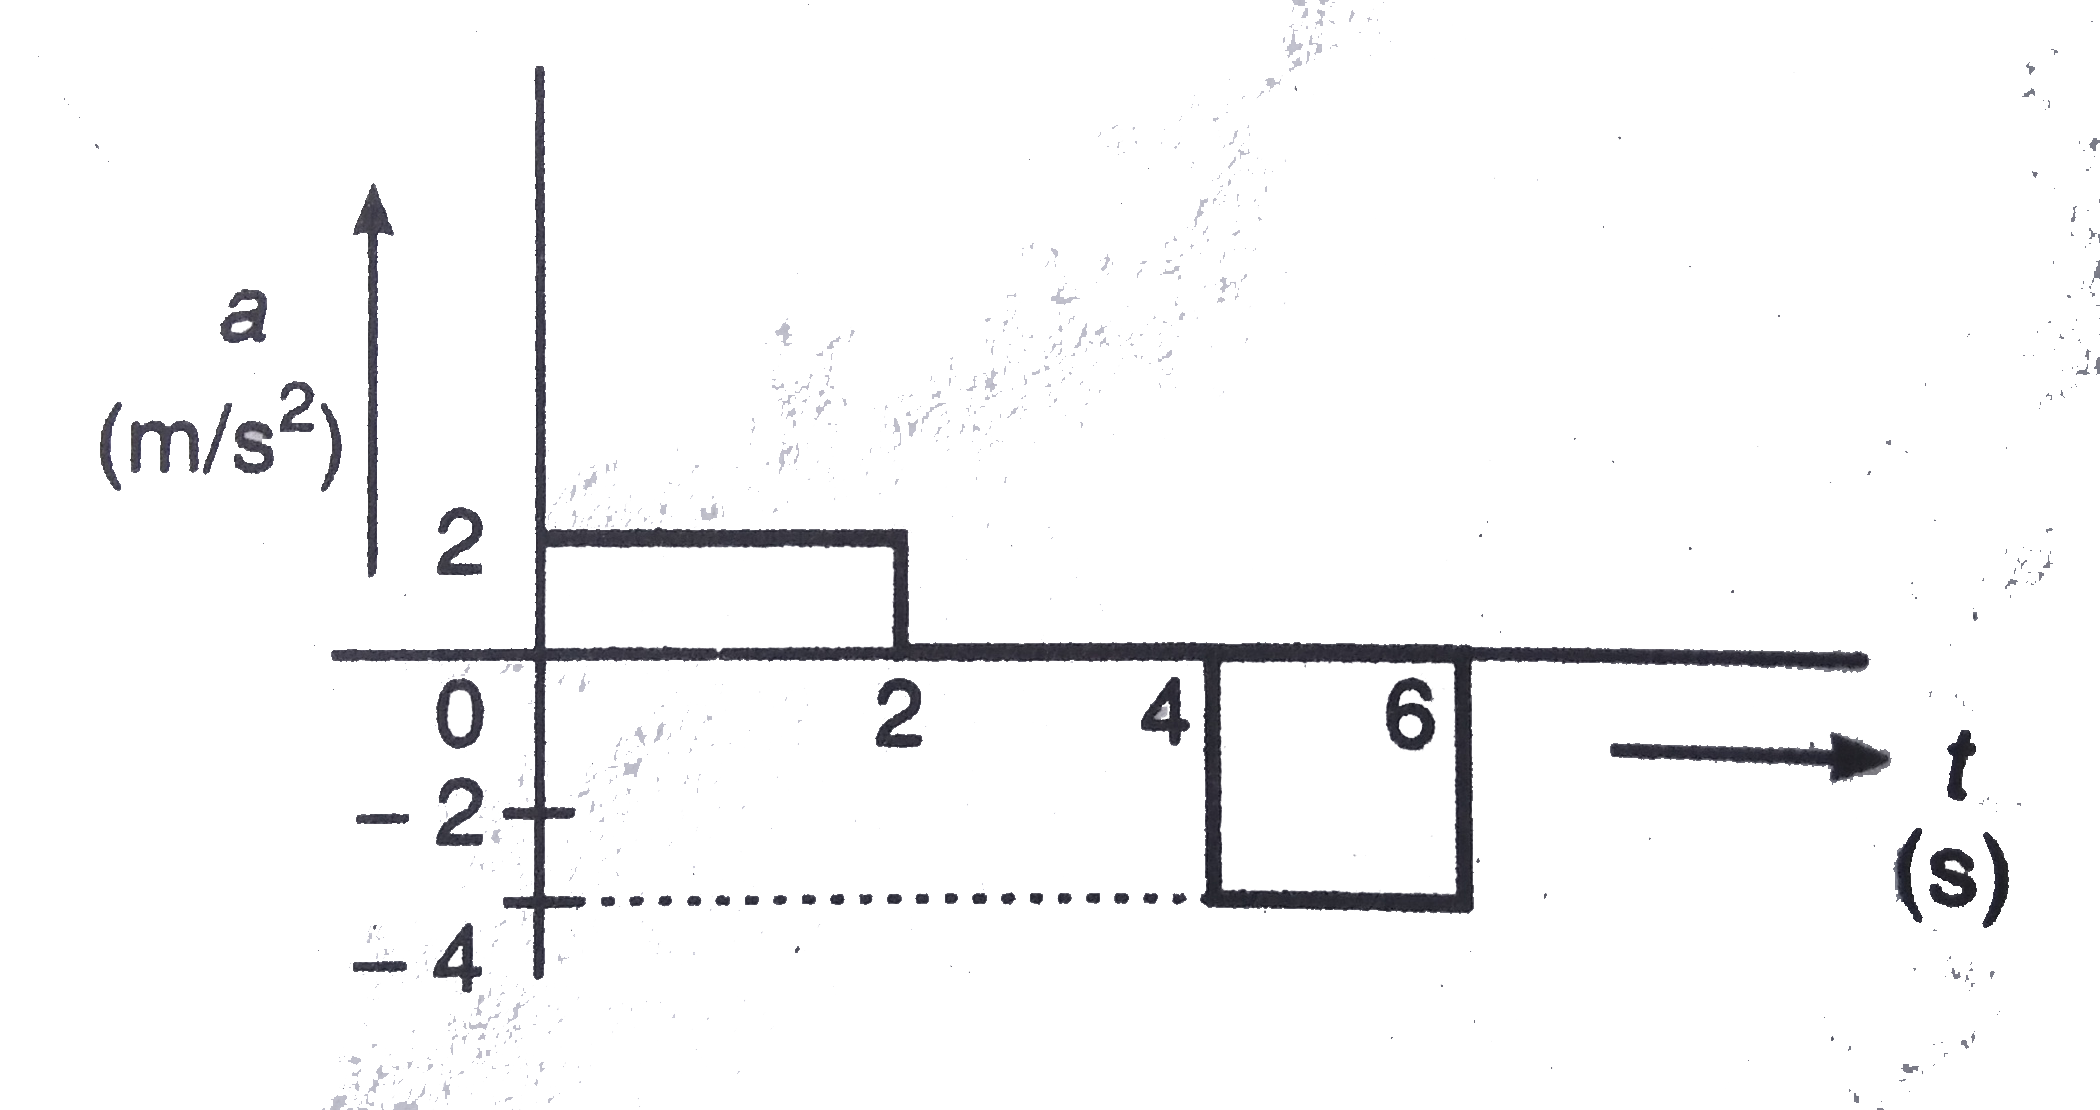
The acceleration versus time graph of a particle moving along a straight line is shown in the figure. Draw the respective velocity-time graph Given v=0 at t=0.
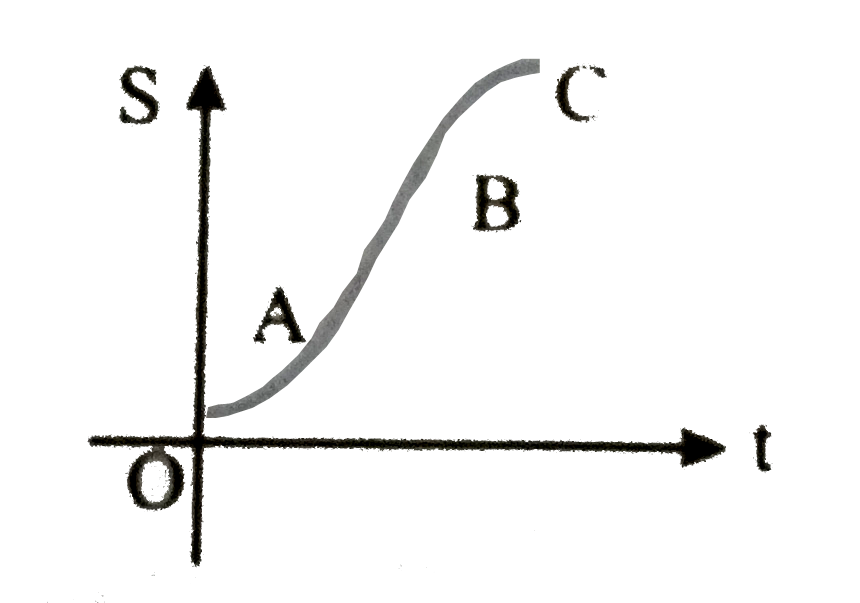
View SolutionDisplacement time graph of a particle moving in a straight line is as shown in figure. Select the correct alternative (s) :
 .
.
View Solution
Knowledge Check
Displacement time graph of a particle moving in a straight line is a shown in figure.
 Ain region A acceleration is positiveBin region B acceleration is negativeCin region C acceleration is positiveDin region D acceleration is negative
Velocity displacement graph of a particle moving in a straight line is as shown in figure.
 Amagnitude of acceleration of particle is decreasingBmagnitude of acceleration of particlre is increasingCacceleration versus displacement graph straight lineDacceleration versus displacement graph is parabola
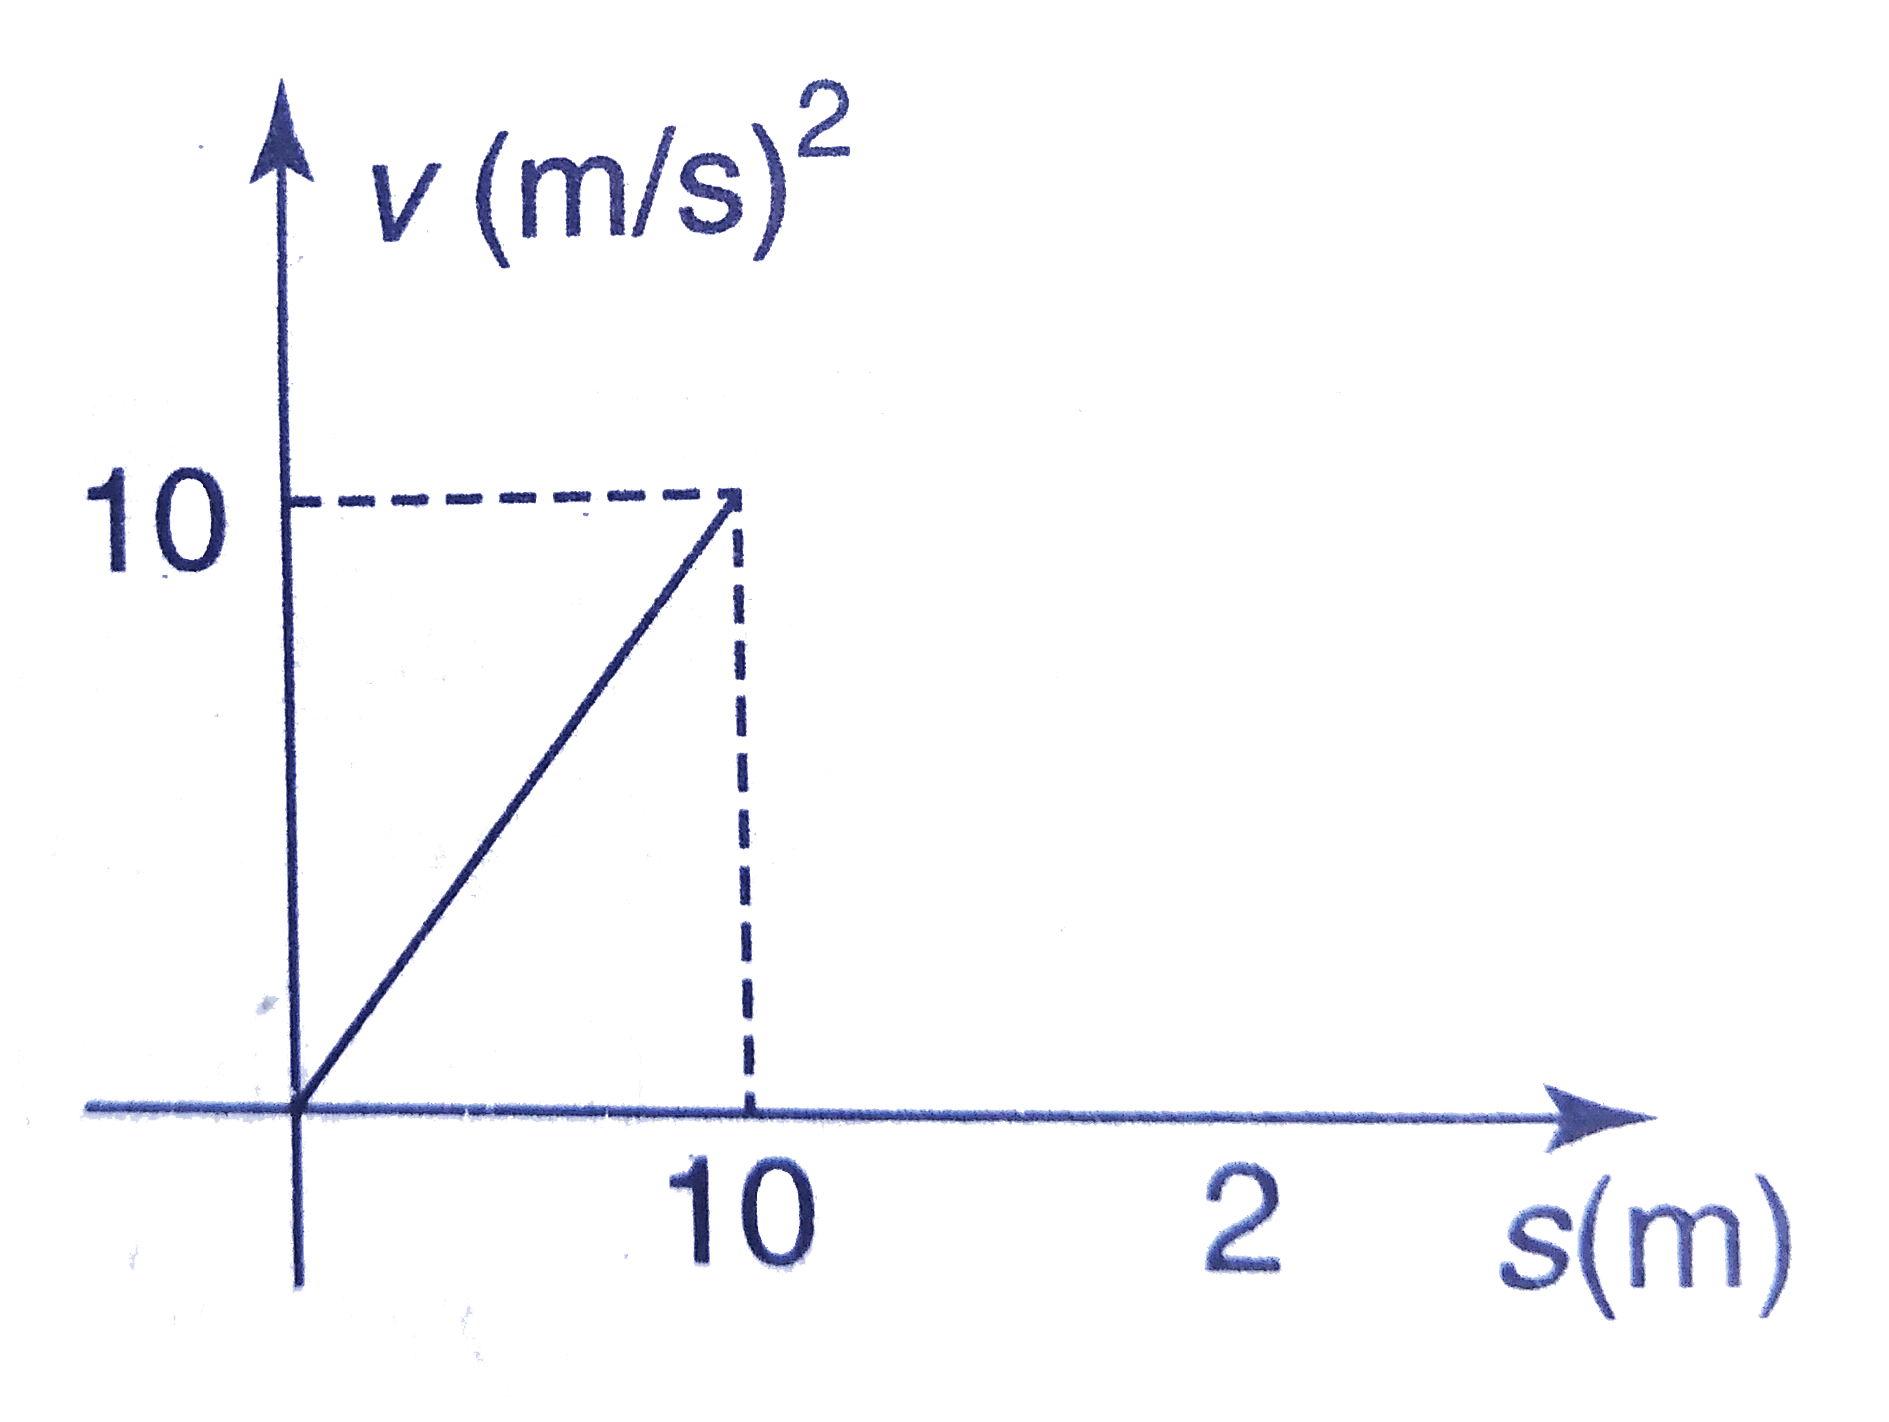
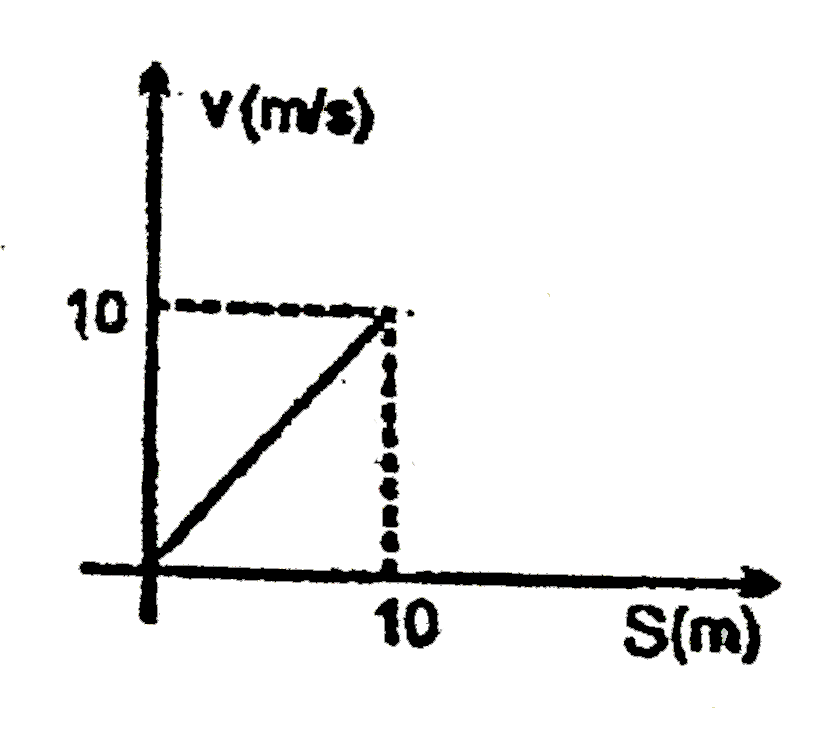
Velocity versus displacement graph of a particle moving in a straight line as shown in figure.
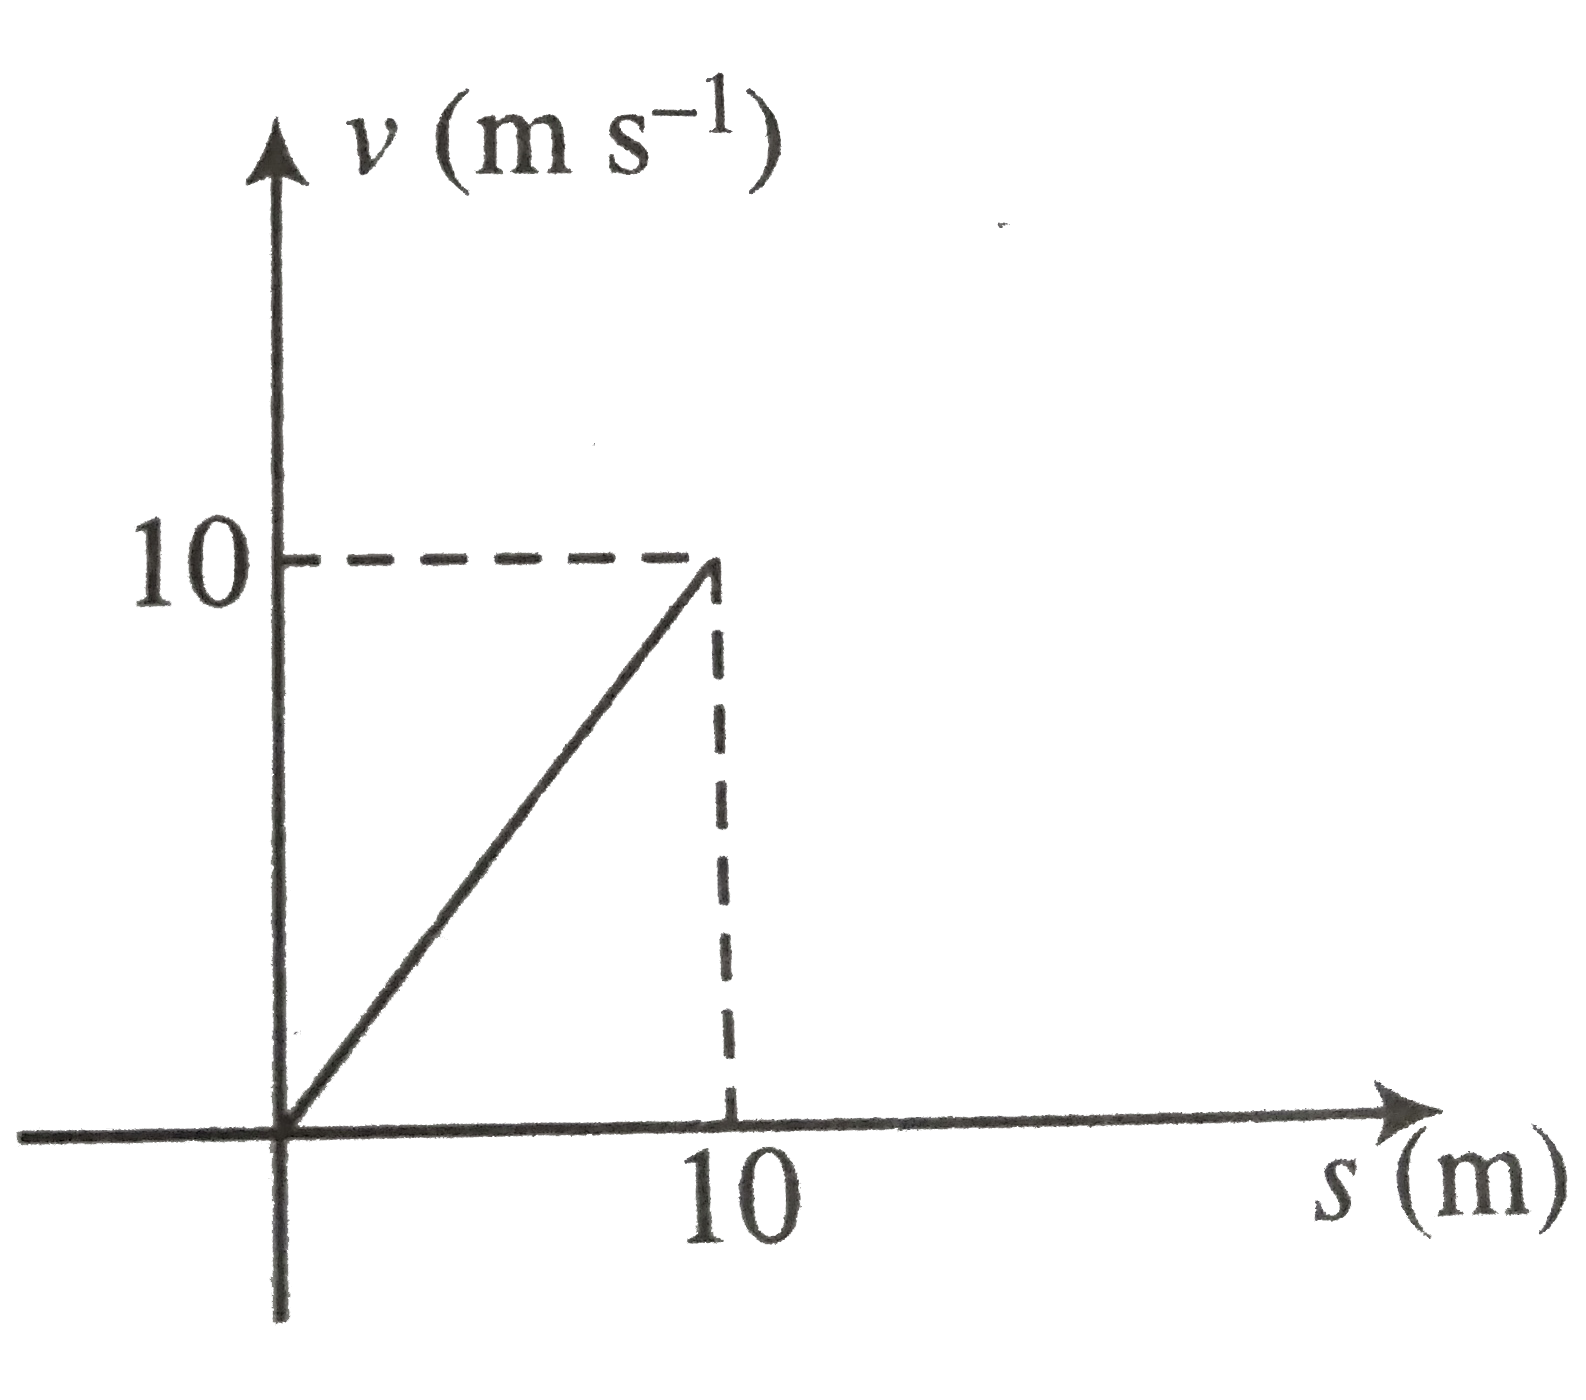
The corresponding acceleration versus velocity graph will be .A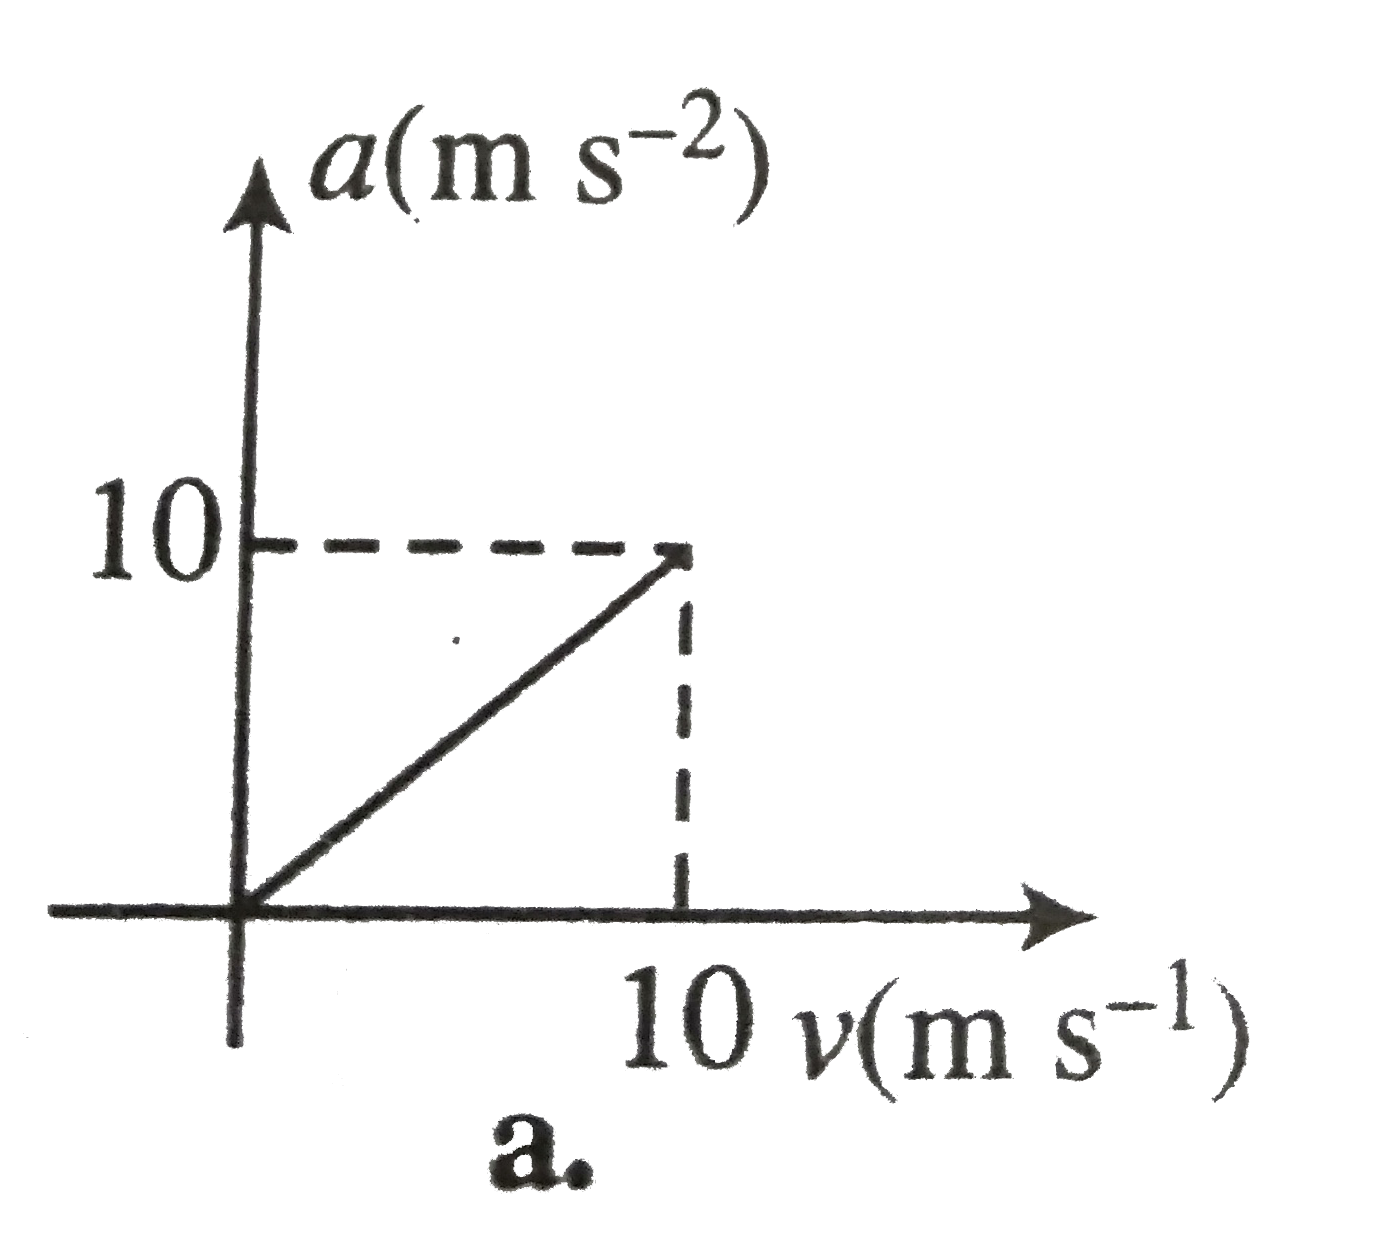 B
B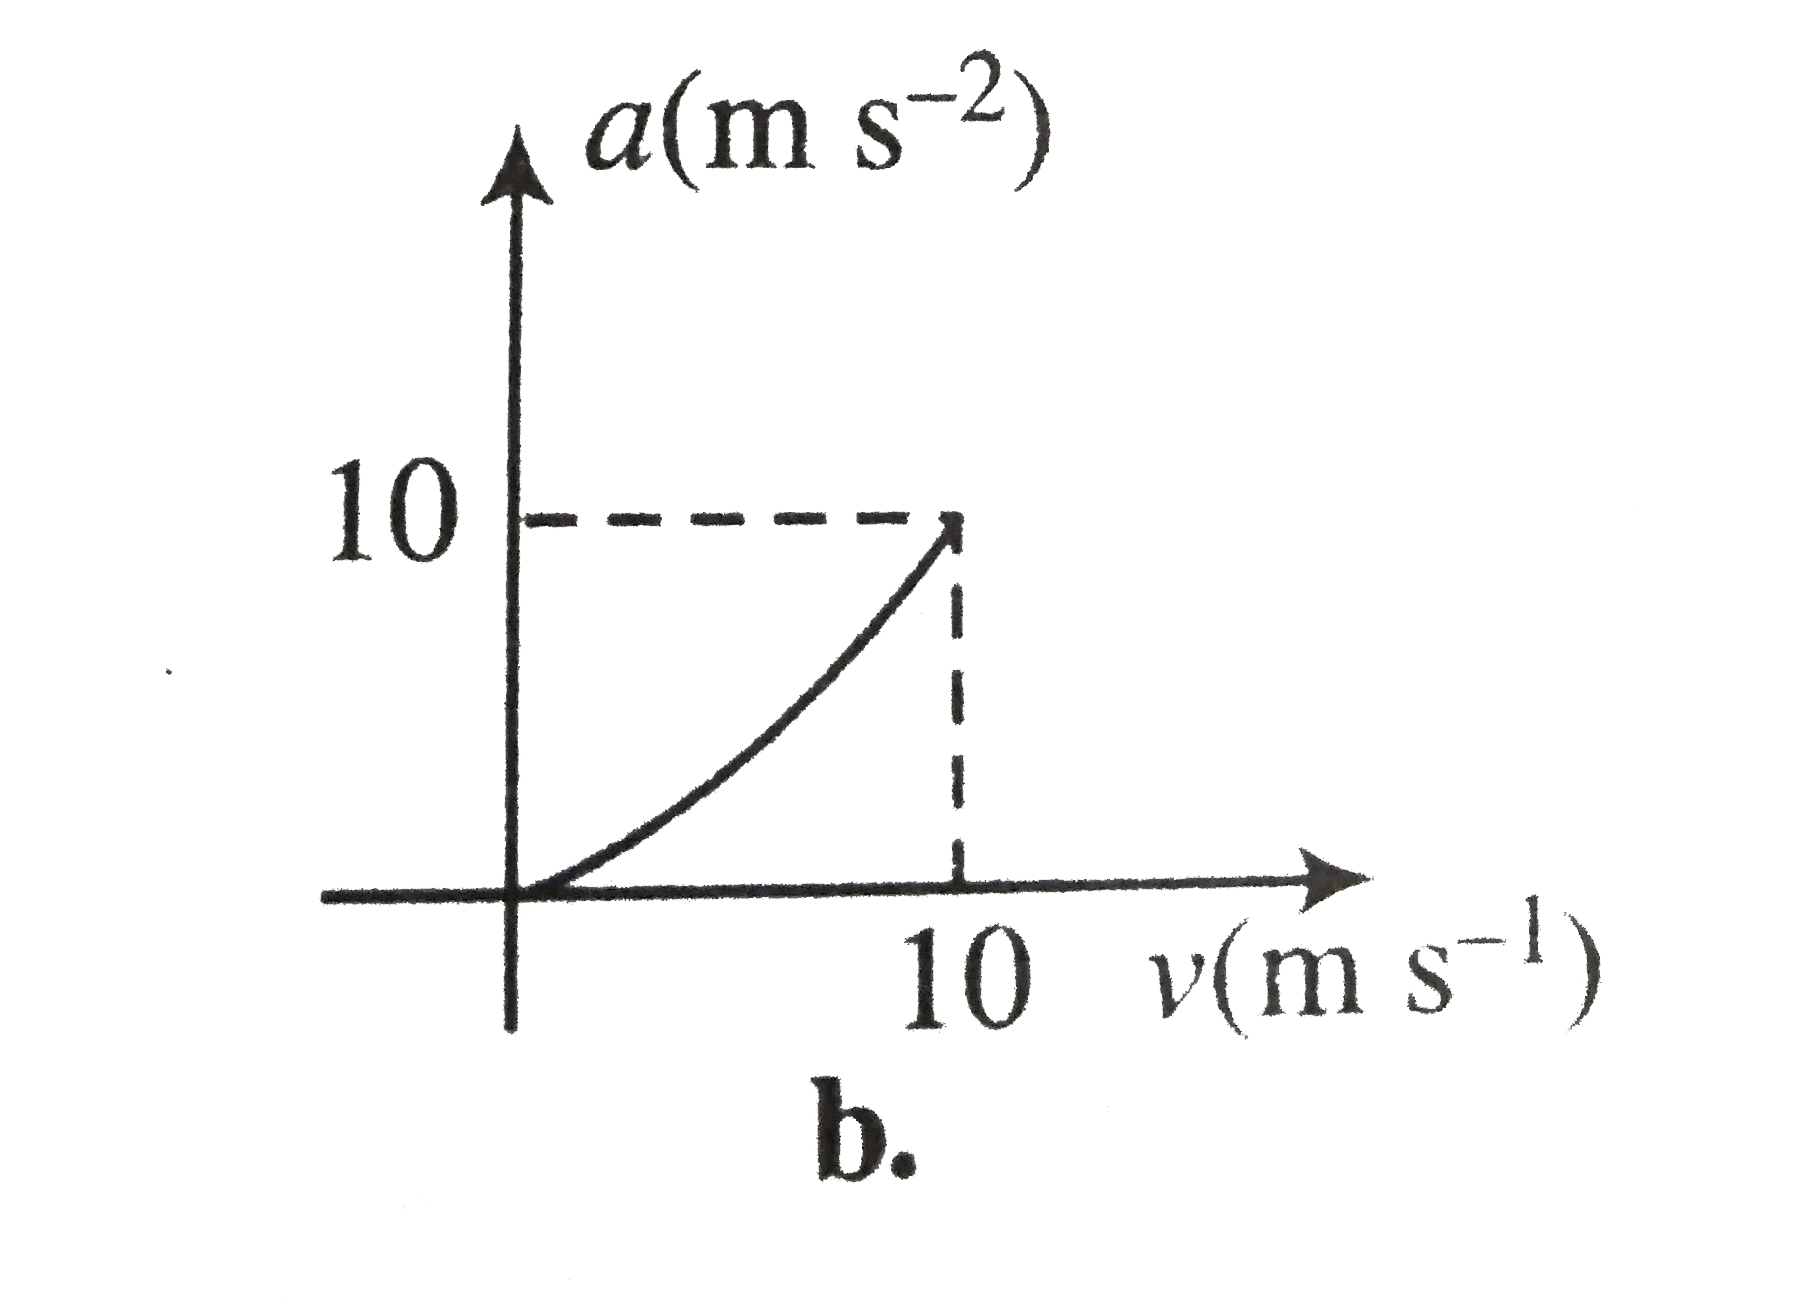 C
C D
D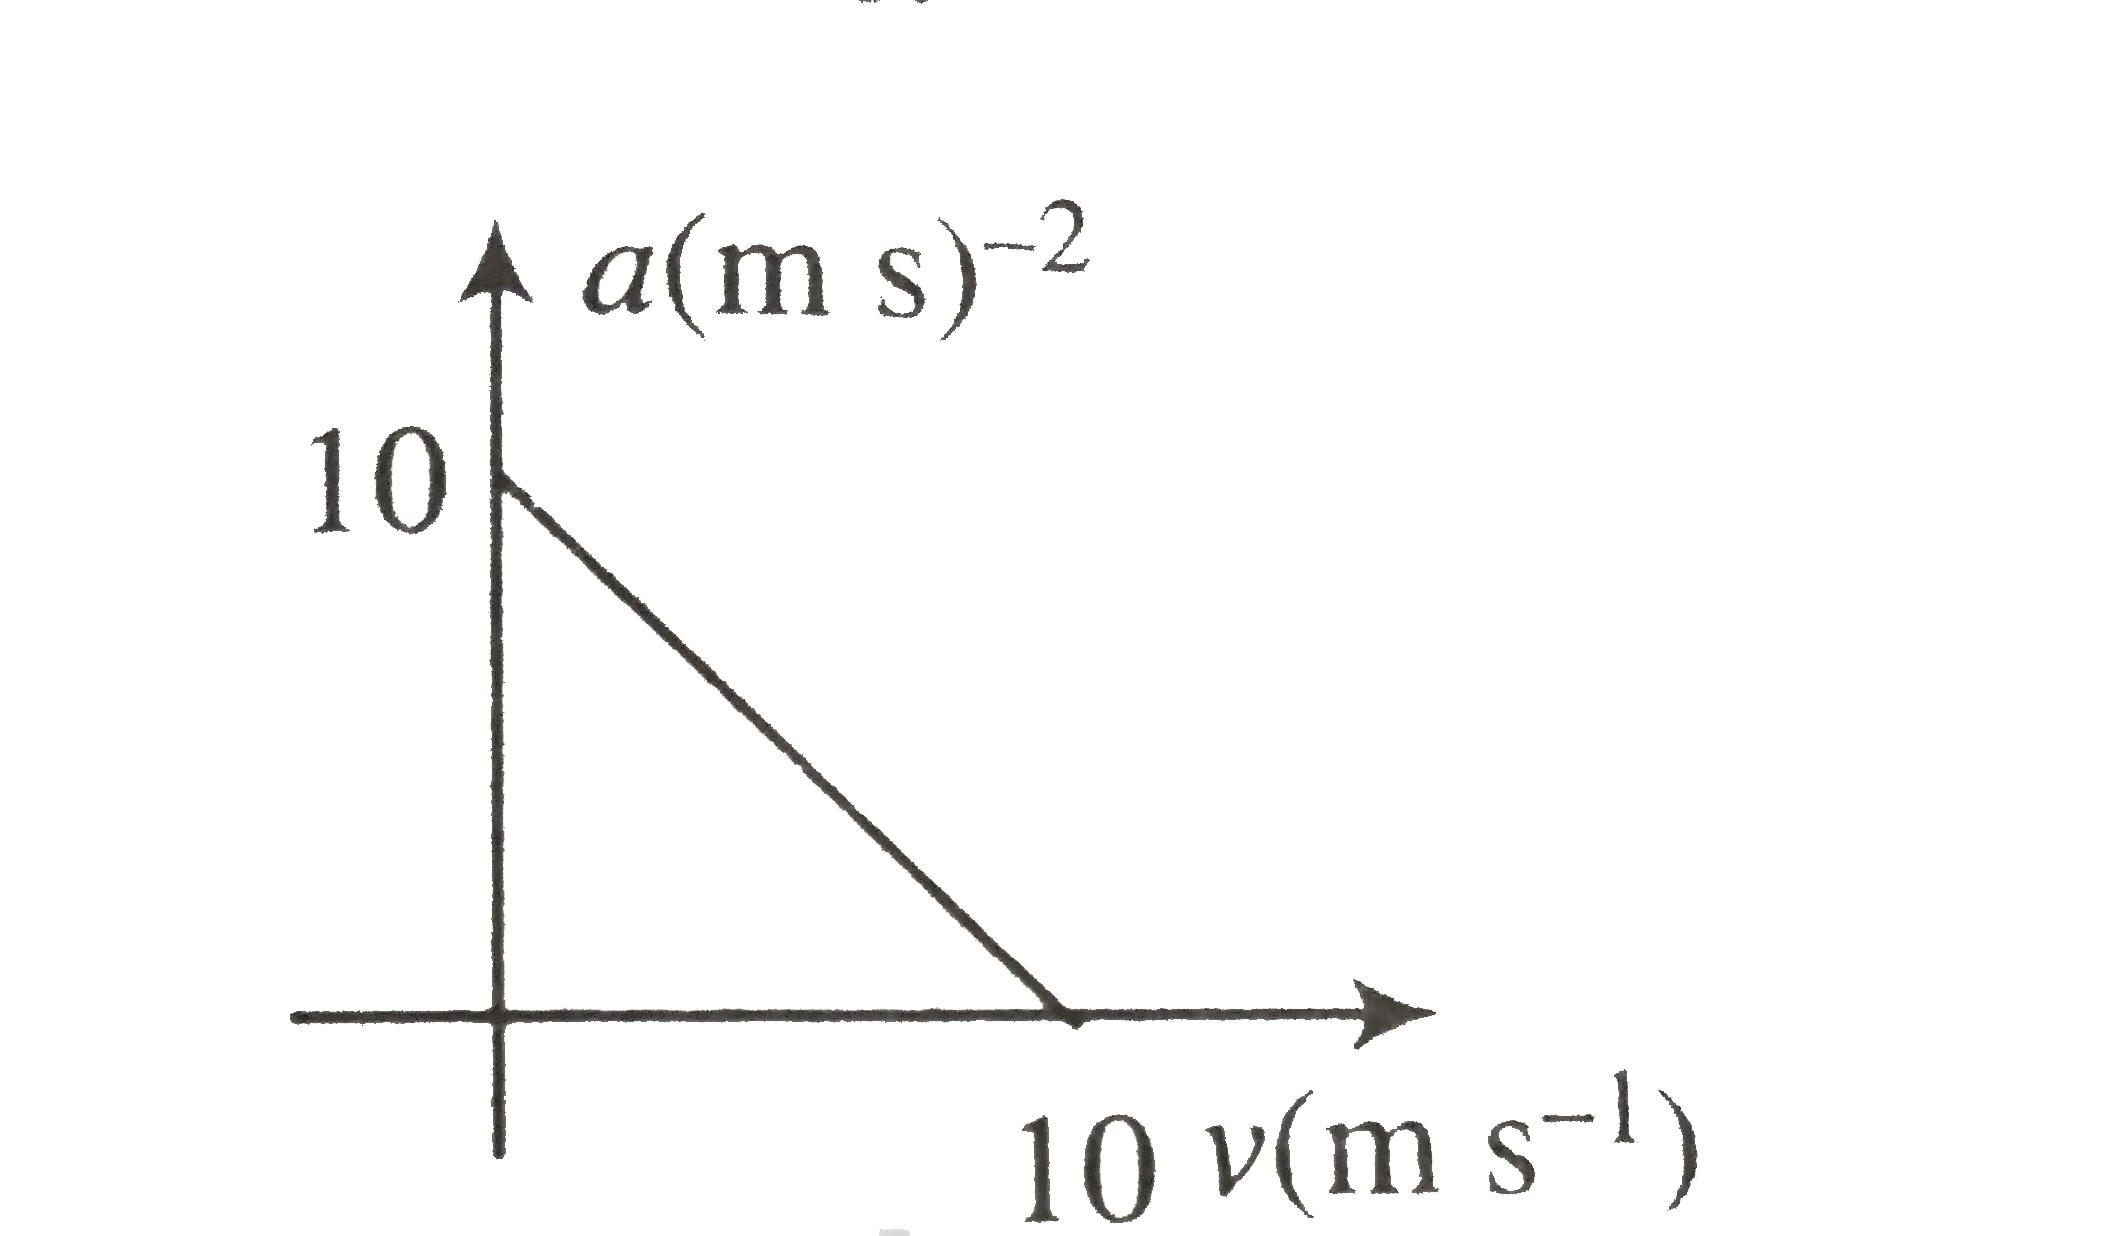
Velocity versus displacement graph of a particle moving in a straight line is shown in figure. Corresponding acceleration versus velocity graph will be.
View SolutionThe velocity-displacement graph of a particle moving along a straight line is shown. The most suitable acceleration-displacement graph will be

View SolutionThe velocity - displacement graph of a particle moving along a straight line is shown
The most suitable acceleration - displacement graph will be

View SolutionThe displacement time graph of a particle moving along a straight line is shown. The accelerations of the particle during the regions OP, PQ and QR are
View SolutionVelocity (v) versus displacement (s) graph of a particle moving in a straight line is shown in figure. Corresponding acceleration (a) versus velocity (v) graph will be
View Solution

