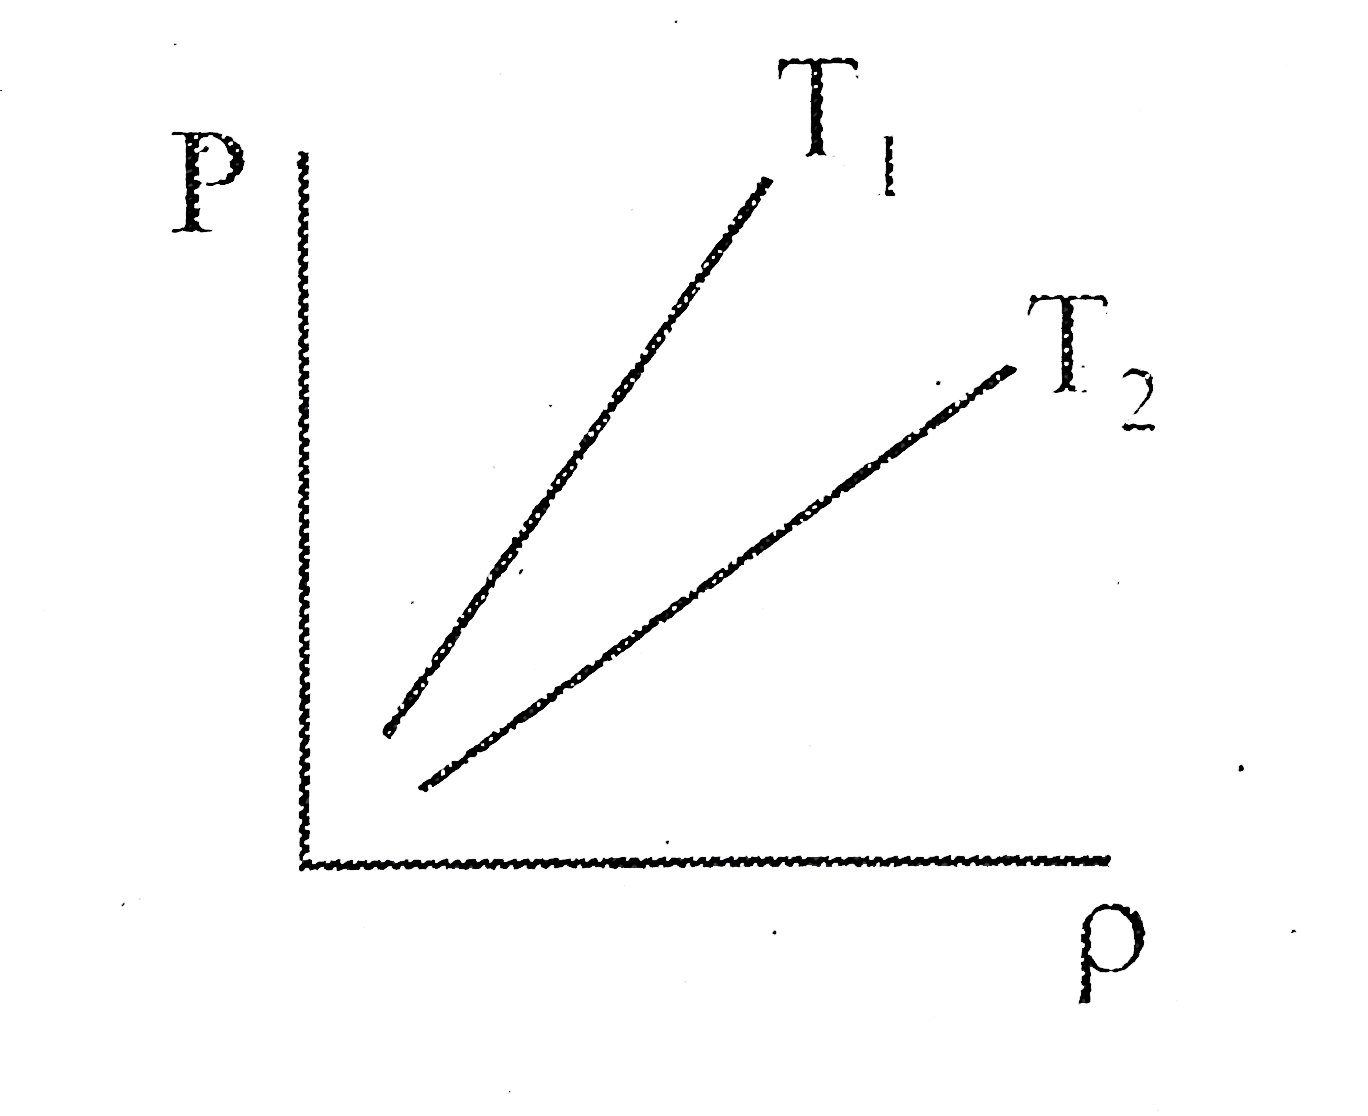
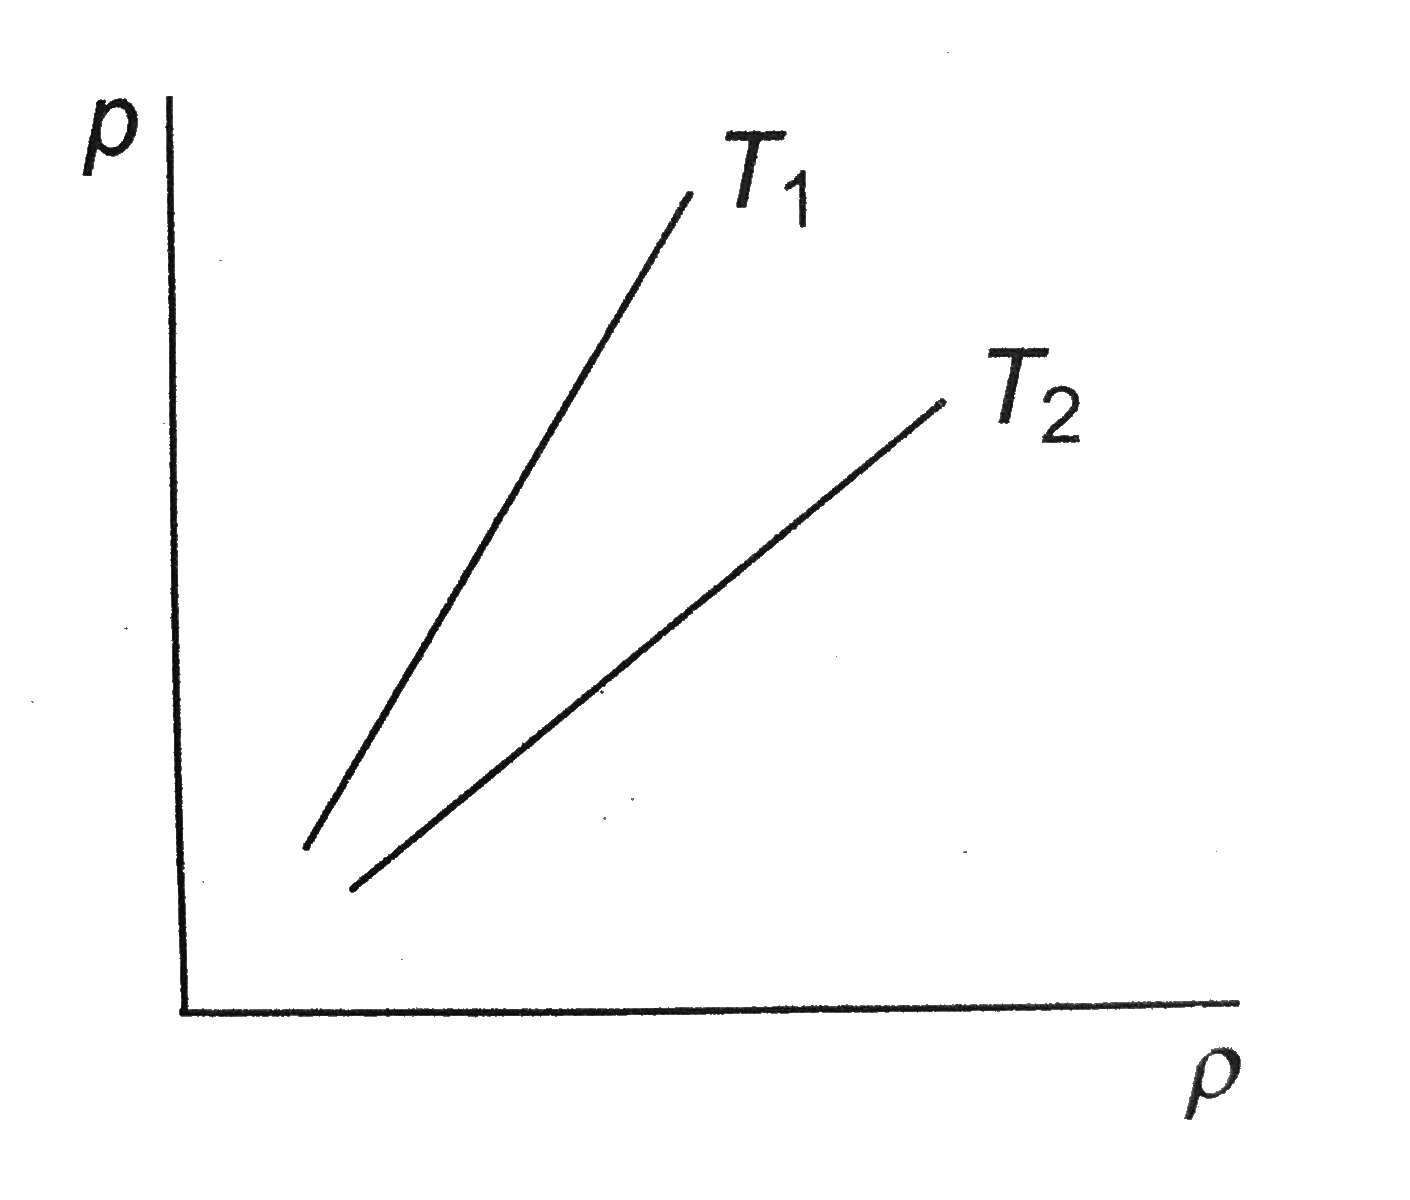
Figure shows graphs of pressure vs density for an ideal gas at two temperatures Tt and T2
A
T1>T2
B
T1=T2
C
T1<T2
D
any of the three is possible
Video Solution
Text Solution
The correct Answer is:A
From the ideal gas equation: Pρ=RTM
Hence, the slope of pressure-density graph is proportional to temperature.
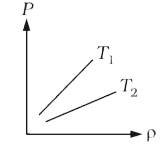
From the graph we can see that slope of graph for T1 is greater than slope for T2
So T1>T2
|
Similar Questions
Knowledge Check
Figure shows graphs of pressure versus density for an ideal gas at two temperatures T1 and T2 Which is correct ?
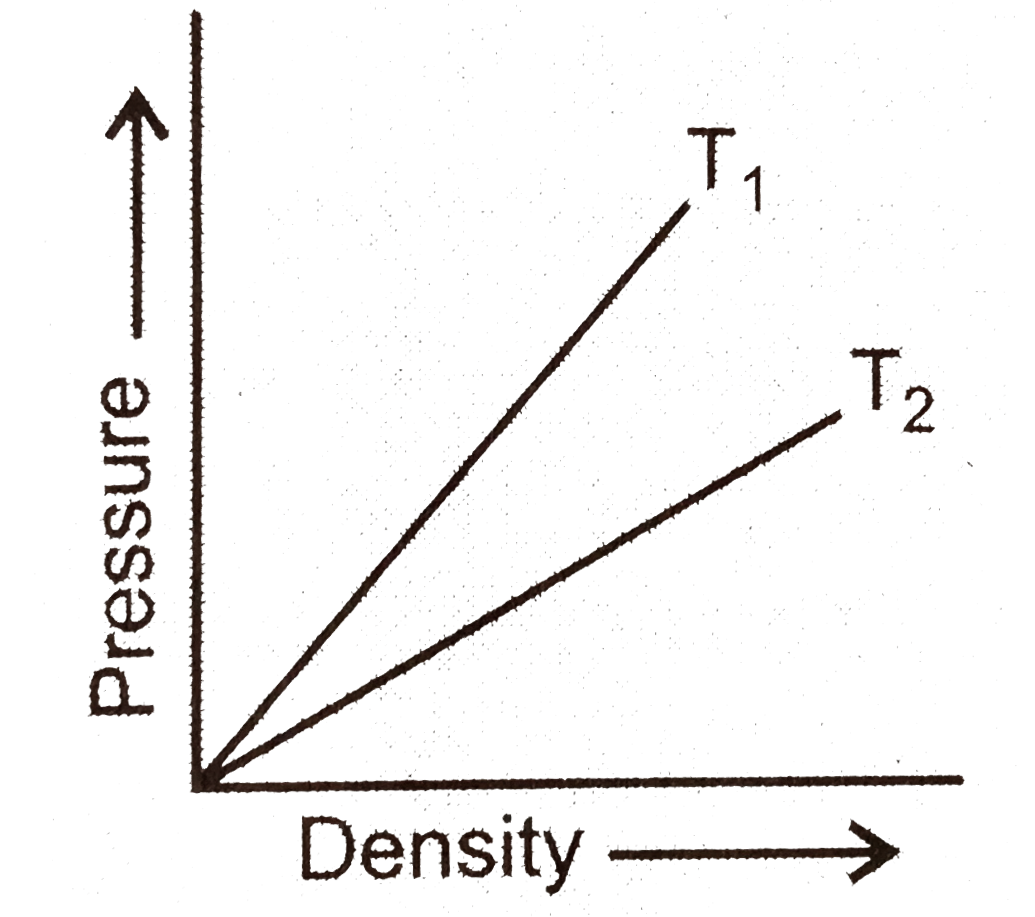 .AT1>T2BT2>T1CBothDNone of these
Figure shows graphs of pressure vs density for an ideal gas at two temperature T1andT2. Which of the following is correct?
 AT1>T2BT1=T2CT1<T2Dany of the three is possible
Shows graphs of pressure vs density for an ideal gas at two temperaturesT1andT2
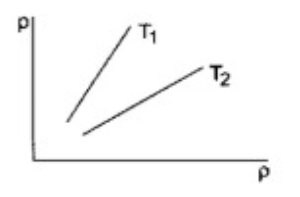 A(a)T1>T2B(b)T1=T2C(c)T1<T2D(d)Any of the three is possibe.
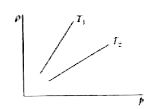
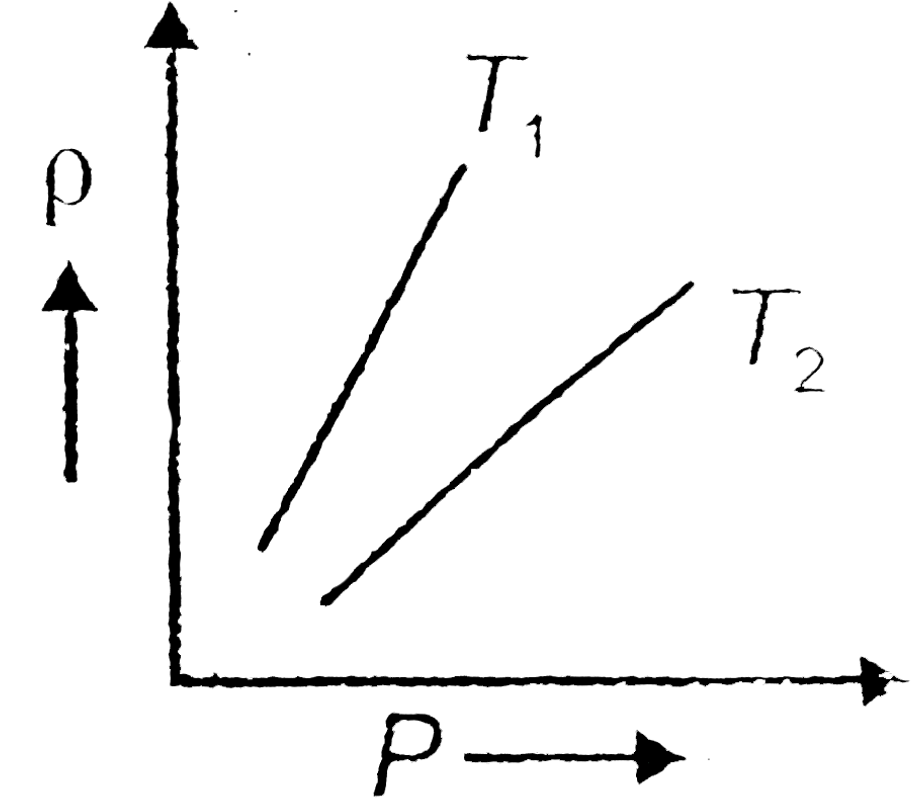
The density (ρ) versus pressure (P) graphs of a given mass of an ideal gas is shown at two temperatures T1andT2. Then relation between T1andT2 may be
View SolutionFigure shows the isotherms of fixed mass of an ideal gas at three temperatures TA.TB and TC then:-
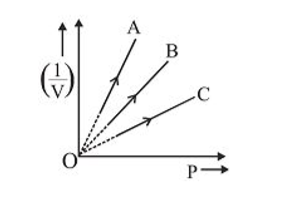
View SolutionFigure shows the isotherms of a fixed mass of an ideal gas at three temperatures TA,TB and TC , then
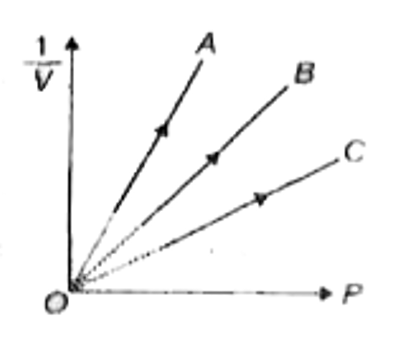
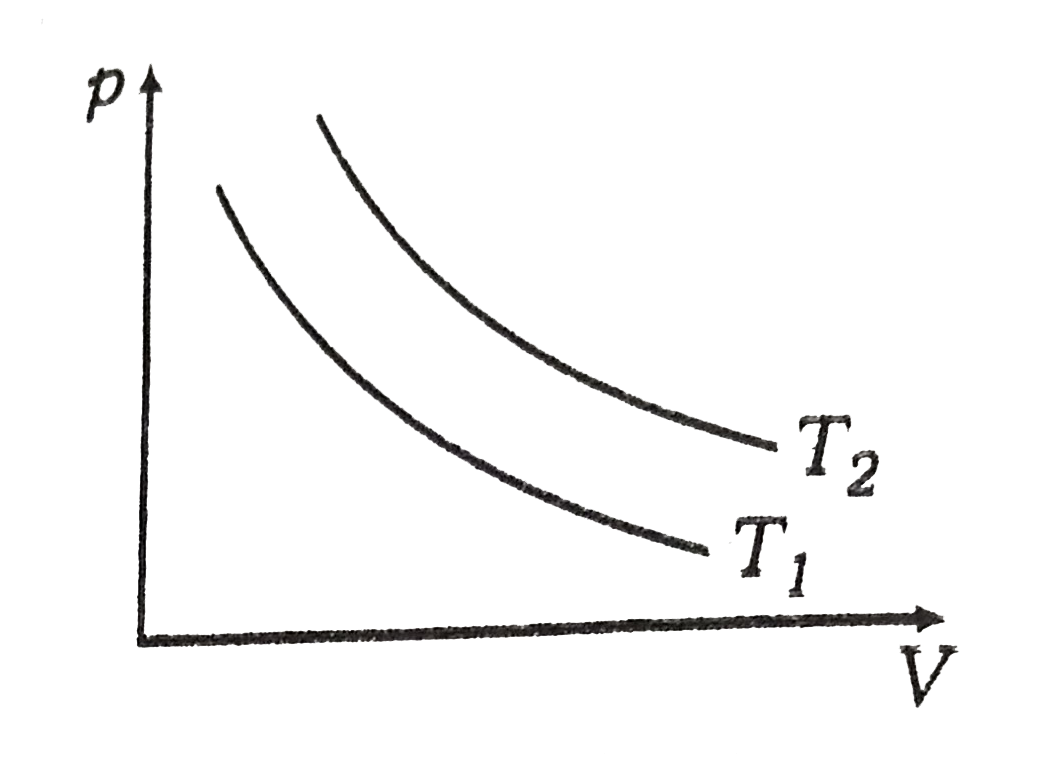
View SolutionThe adjoining fgure shows graph of pressure and volume of a gas at two temperatures T1 and T2 Which one the following is correct
View Solution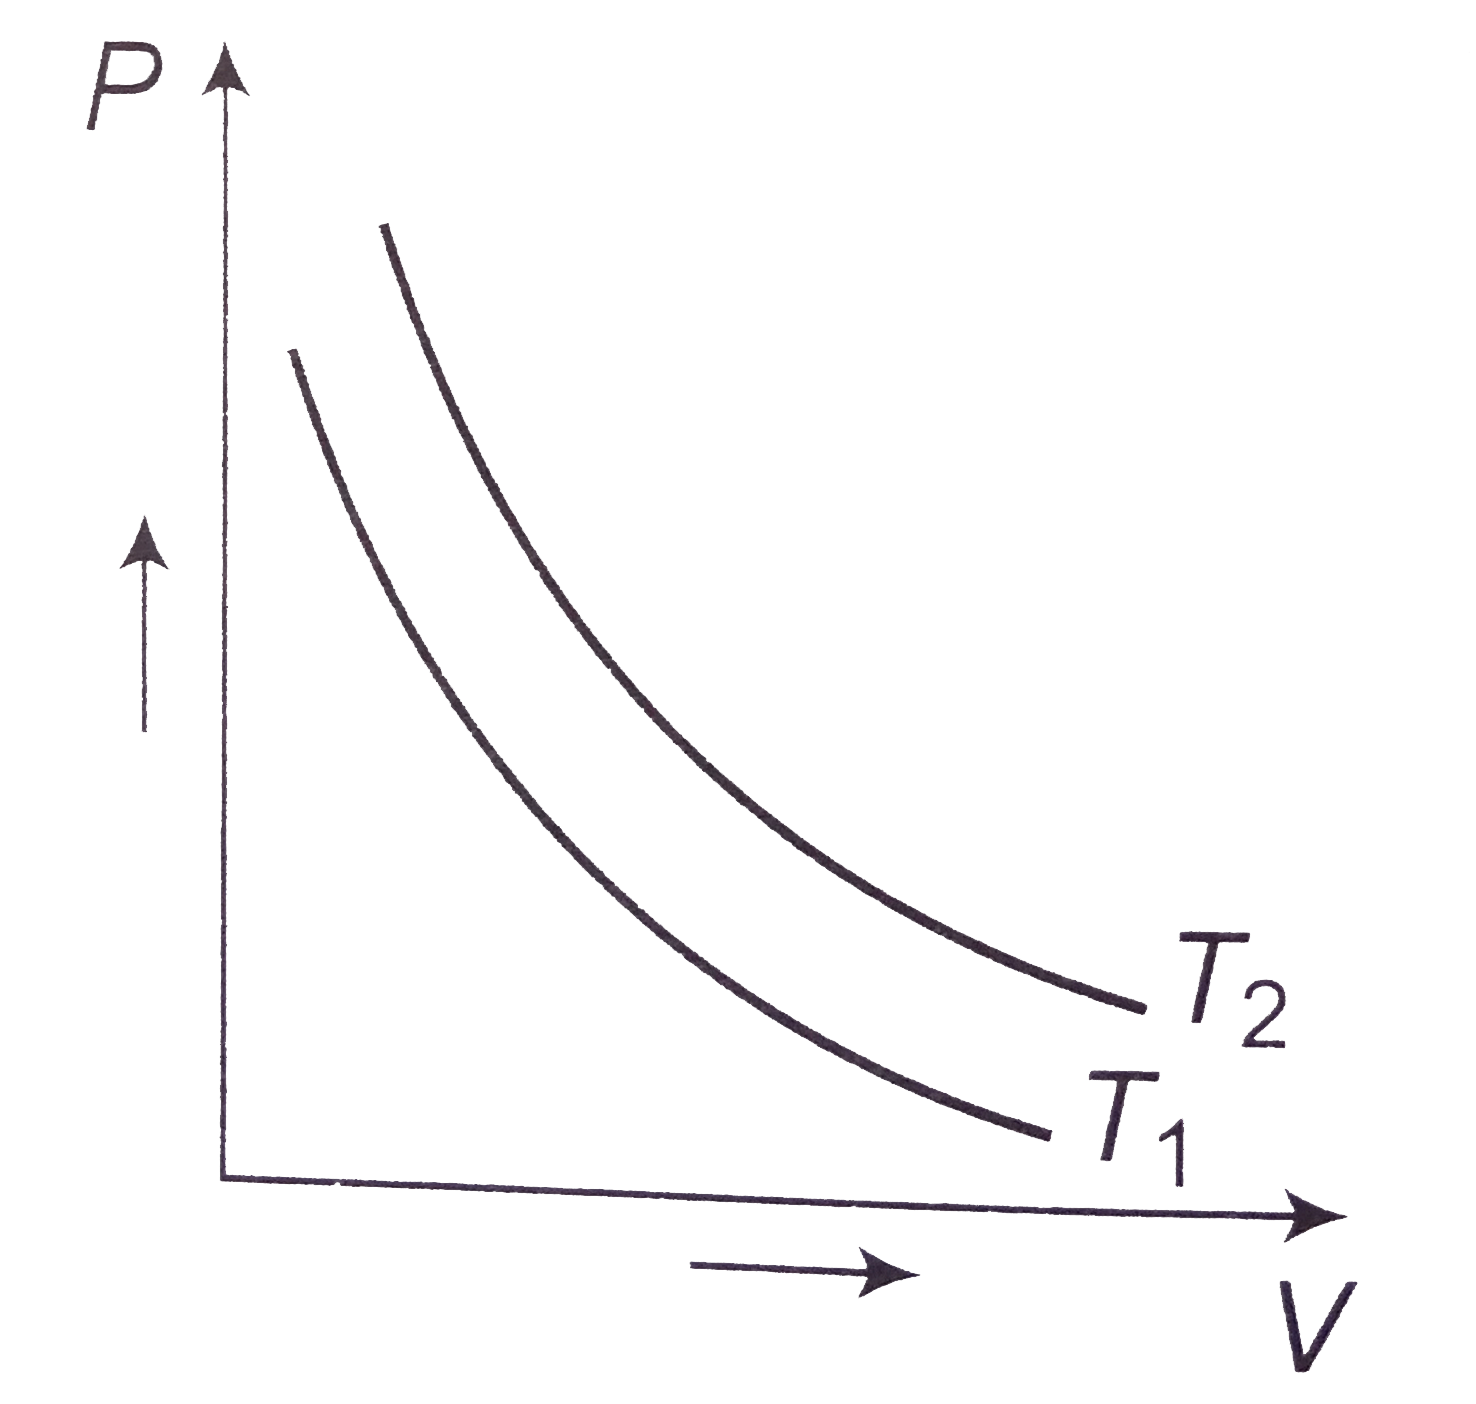
The adjoining figure shows graphs of pressure and volume of a gas at two temperature T1 and T2 Which of the following inferences is correct?
View Solution


