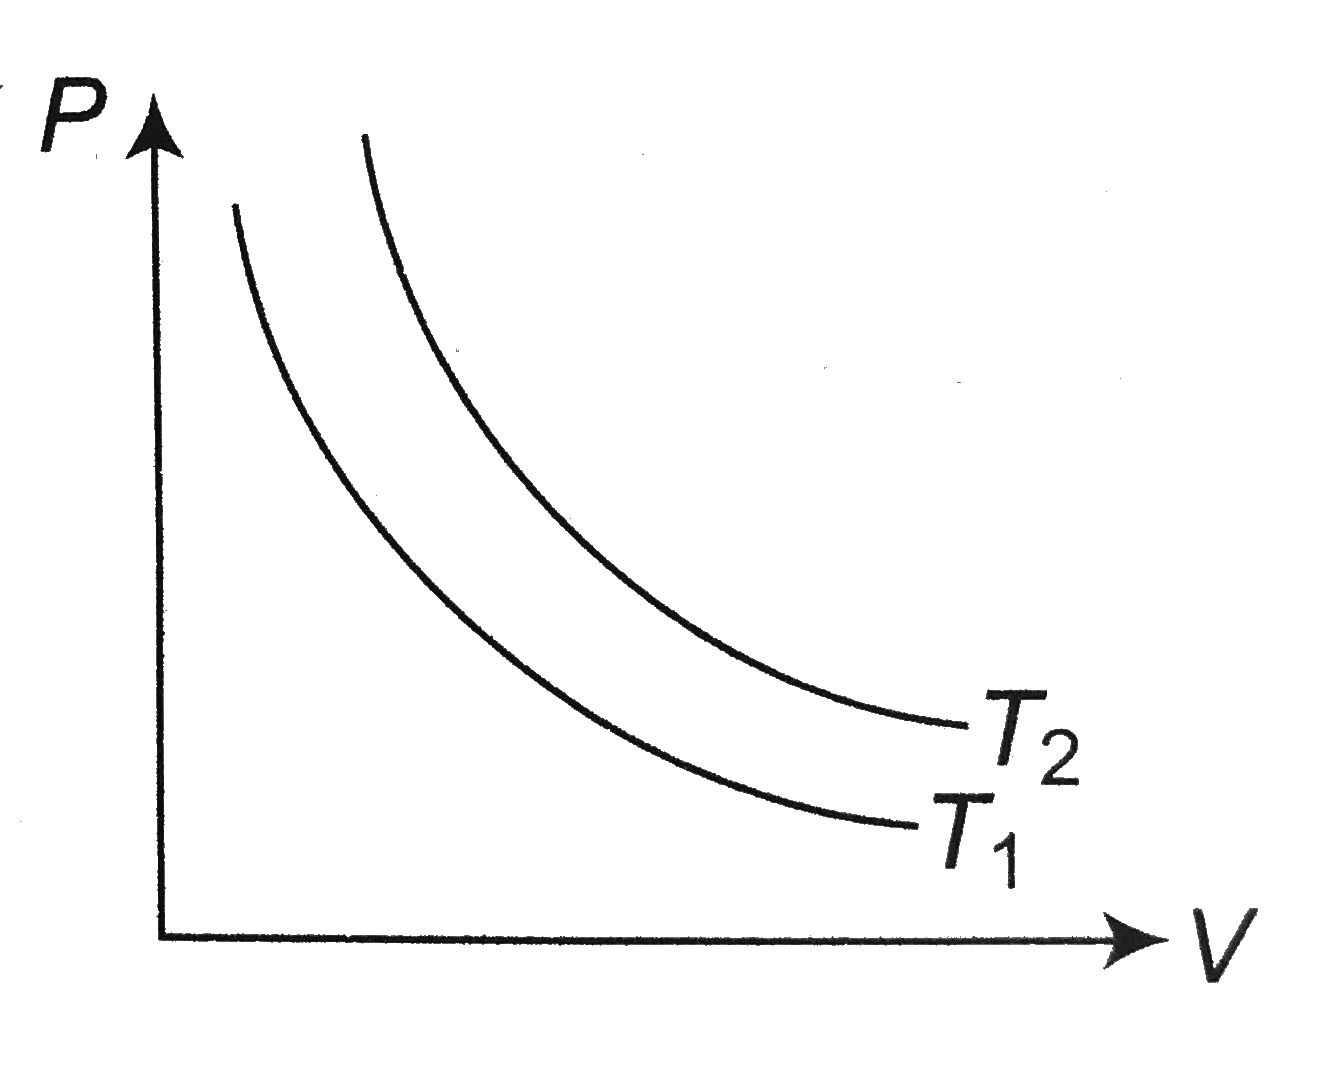
The adjoining fgure shows graph of pressure and volume of a gas at two temperatures T1 and T2 Which one the following is correct 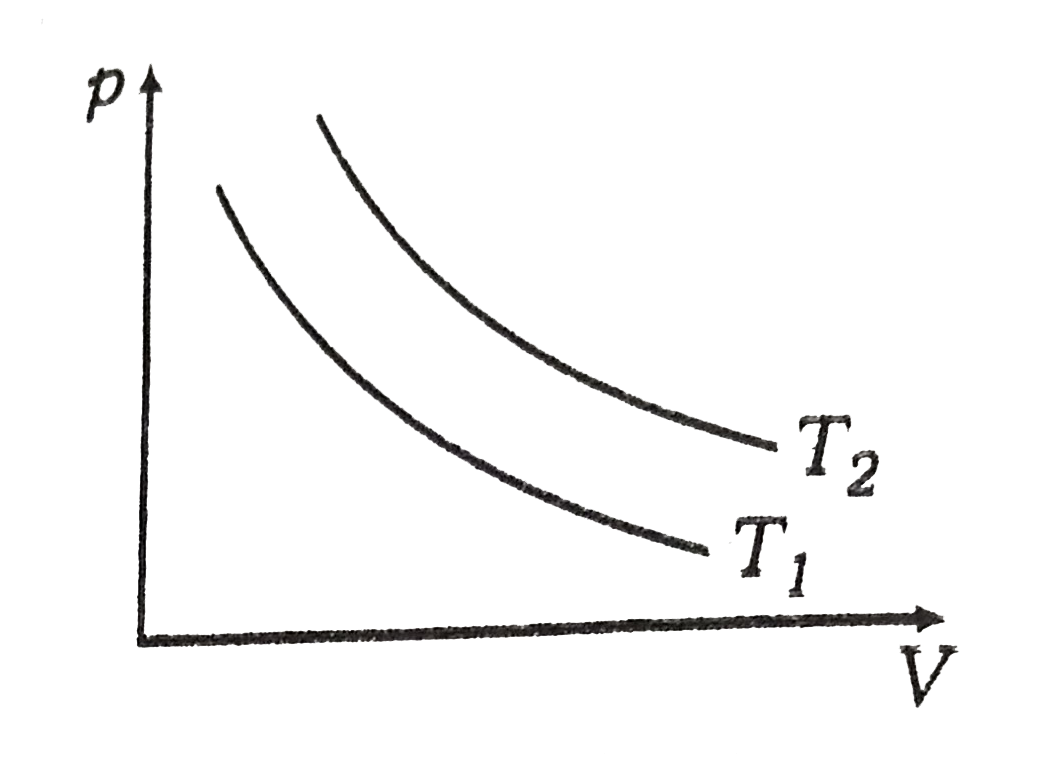
A
T1>T2
B
T1=T2
C
T1<T2
D
Nothing can be said about temperatures
Video Solution
Text Solution
The correct Answer is:C
For a given pressure, volume will be more if temperatuer is more (Charle's law) 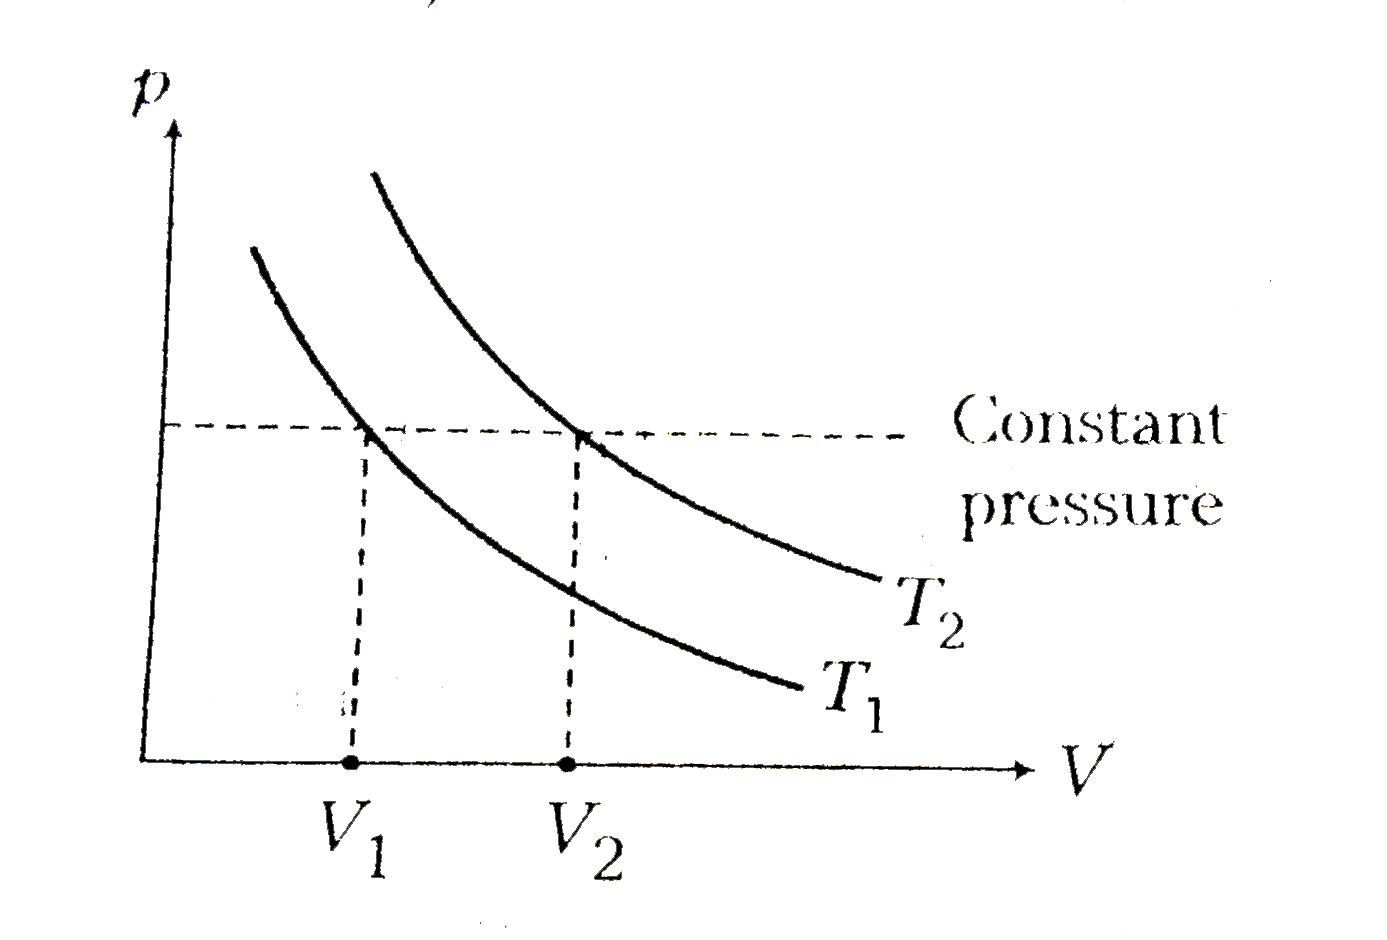
From the graph, it is clear that V2>V1⇒T2>T1
|
Topper's Solved these Questions
- THERMOMETRY THERMAL EXPANSION AND KINETIC THEORY OF GASESBOOK - DC PANDEYCHAPTER - THERMOMETRY THERMAL EXPANSION AND KINETIC THEORY OF GASESEXERCISE - A Tacking it together
55 Videos
- THERMOMETRY THERMAL EXPANSION AND KINETIC THEORY OF GASESBOOK - DC PANDEYCHAPTER - THERMOMETRY THERMAL EXPANSION AND KINETIC THEORY OF GASESEXERCISE - B medical entrance special format questions
14 Videos
- THERMOMETRY THERMAL EXPANSION AND KINETIC THEORY OF GASESBOOK - DC PANDEYCHAPTER - THERMOMETRY THERMAL EXPANSION AND KINETIC THEORY OF GASESEXERCISE - Check point 14.3
20 Videos
- SUPERPOSITION OF WAVESBOOK - DC PANDEYCHAPTER - SUPERPOSITION OF WAVESEXERCISE - Level 2 Subjective
8 Videos
- THERMOMETRY,THERMAL EXPANSION & KINETIC THEORY OF GASESBOOK - DC PANDEYCHAPTER - THERMOMETRY,THERMAL EXPANSION & KINETIC THEORY OF GASESEXERCISE - Level 2 Subjective
9 Videos
Similar Questions
Knowledge Check
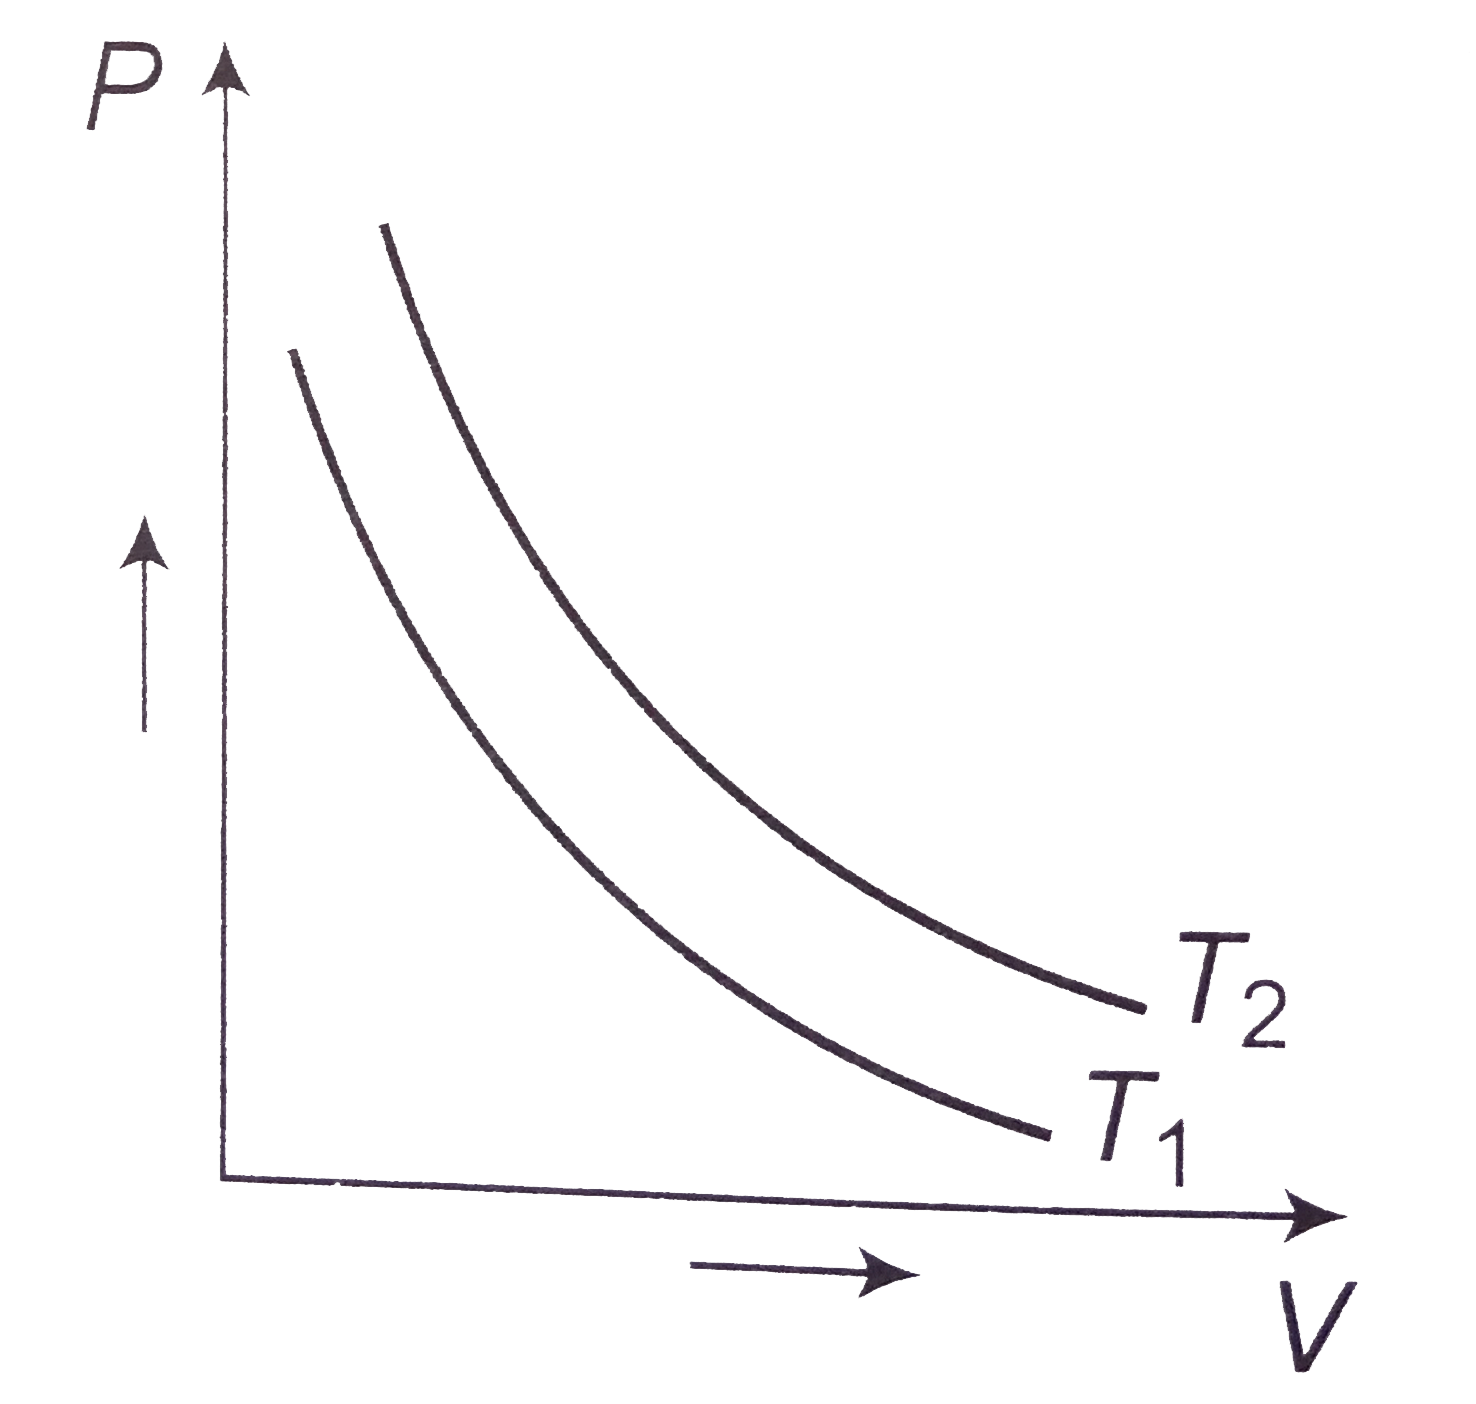
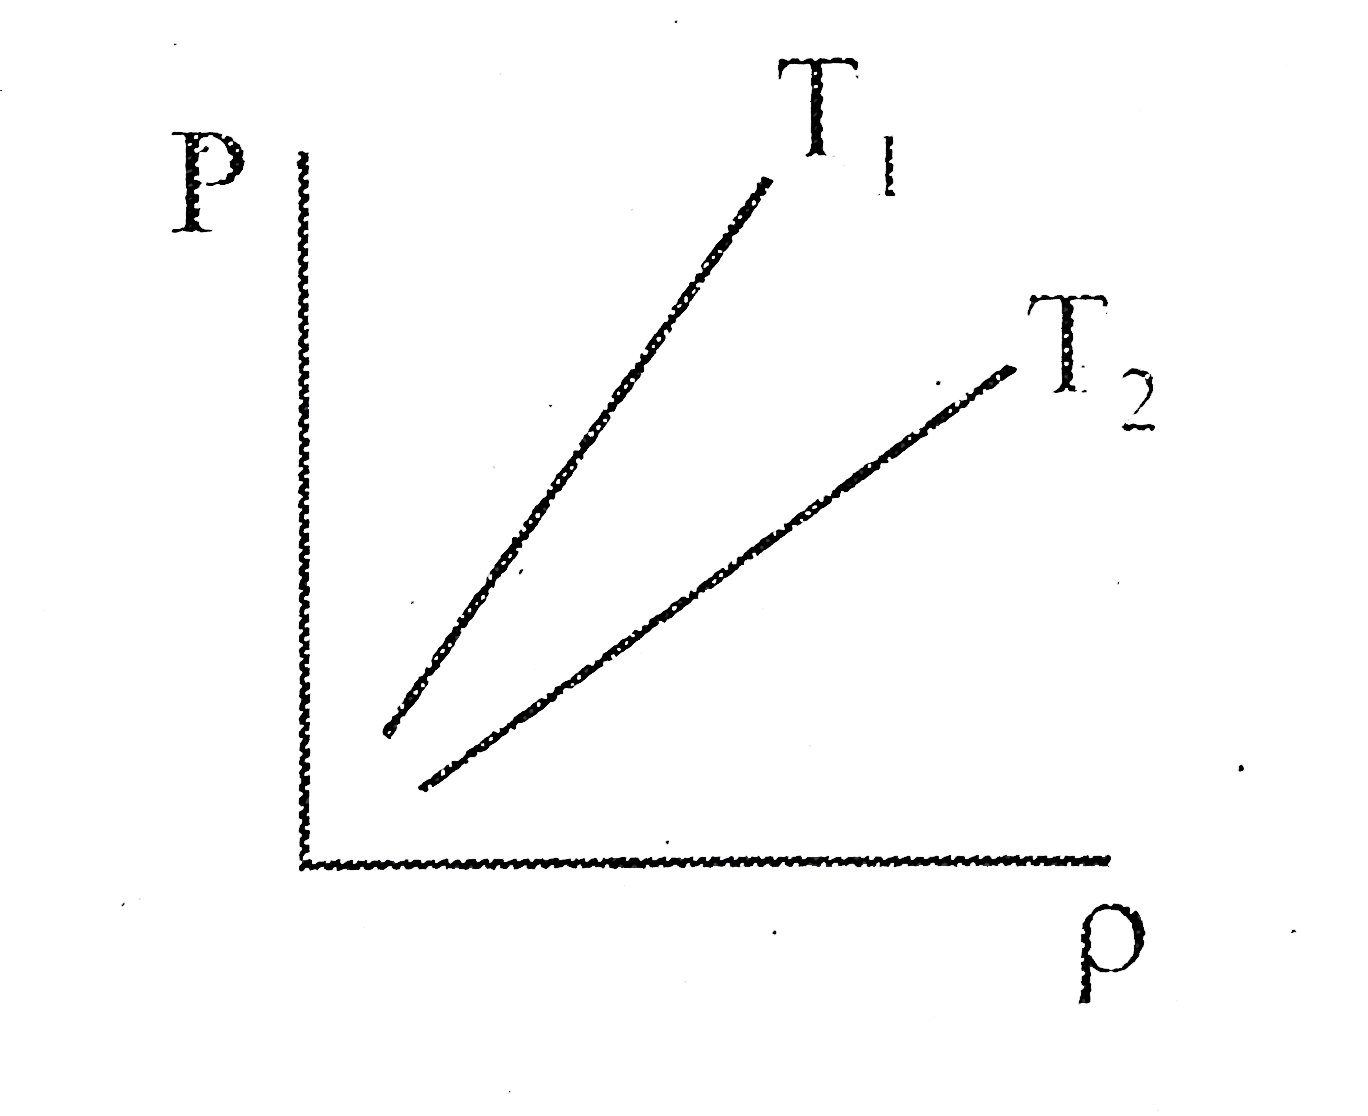
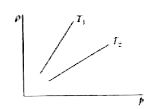
The adjoining figure shows graphs of pressure and volume of a gas at two temperature T1 and T2 Which of the following inferences is correct?AT1>T2BT1=T2CT1<T2DnoneFigure shows graphs of pressure vs density for an ideal gas at two temperature T1andT2. Which of the following is correct?
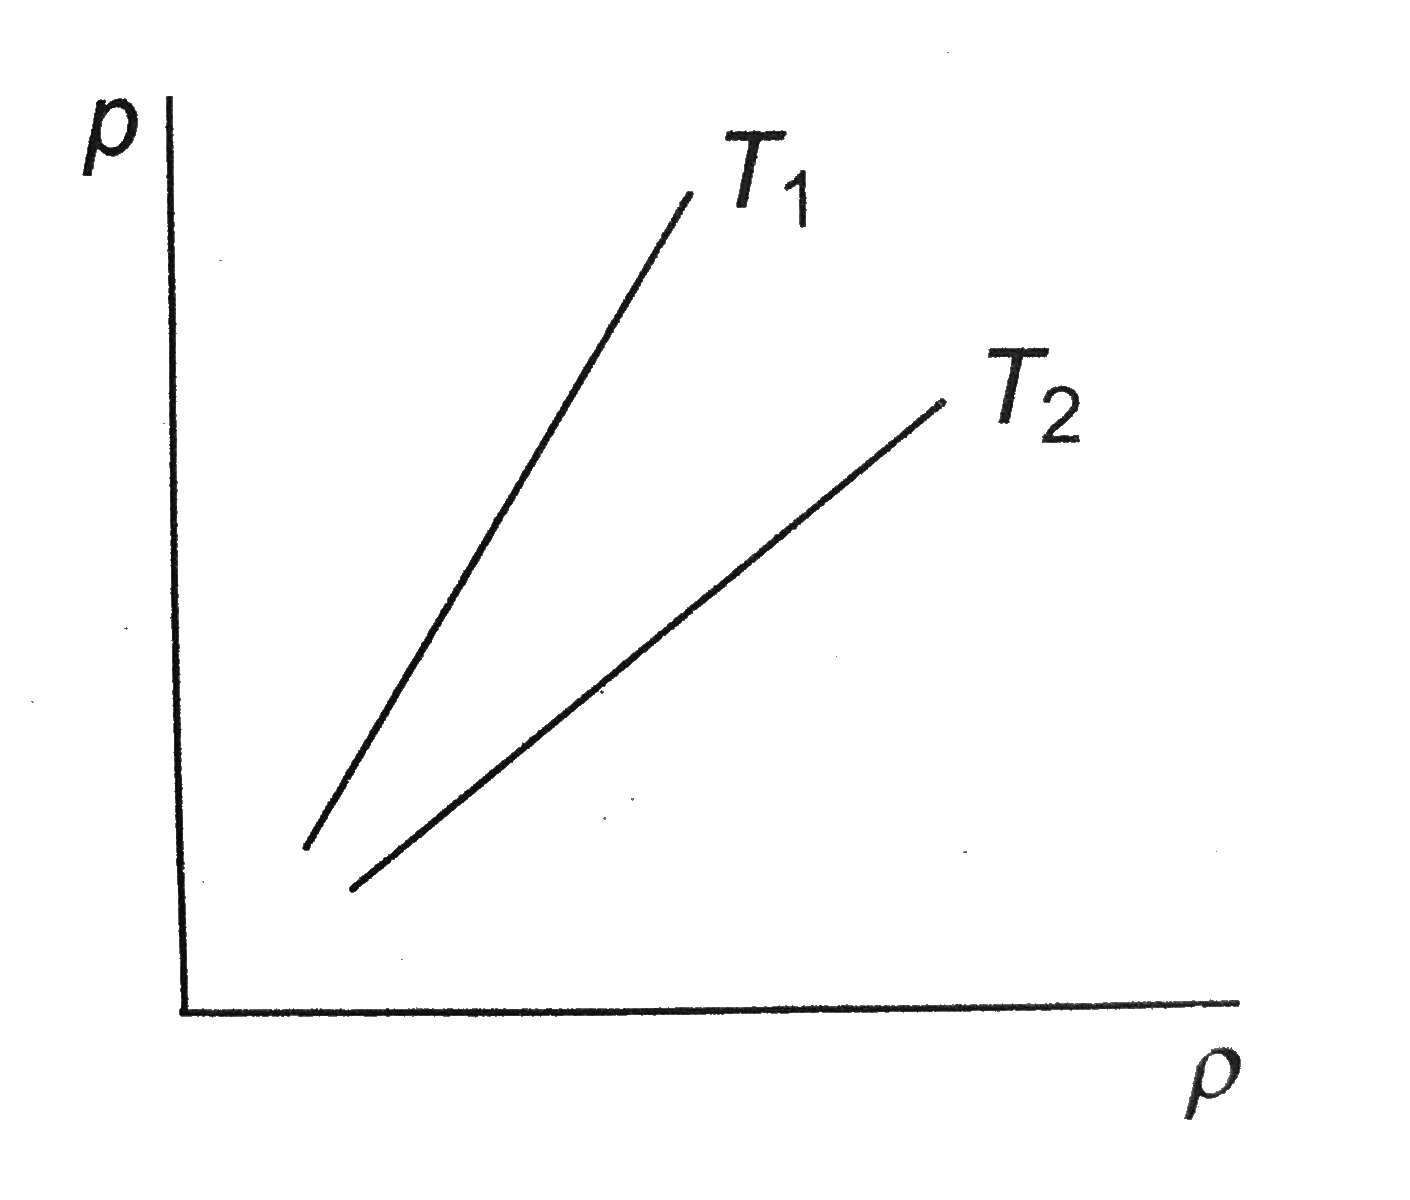 AT1>T2BT1=T2CT1<T2Dany of the three is possible
Figure shows graphs of pressure vs density for an ideal gas at two temperatures Tt and T2
AT1>T2BT1=T2CT1<T2Dany of the three is possible
Shows graphs of pressure vs density for an ideal gas at two temperaturesT1andT2
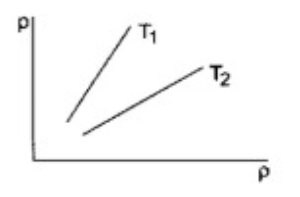
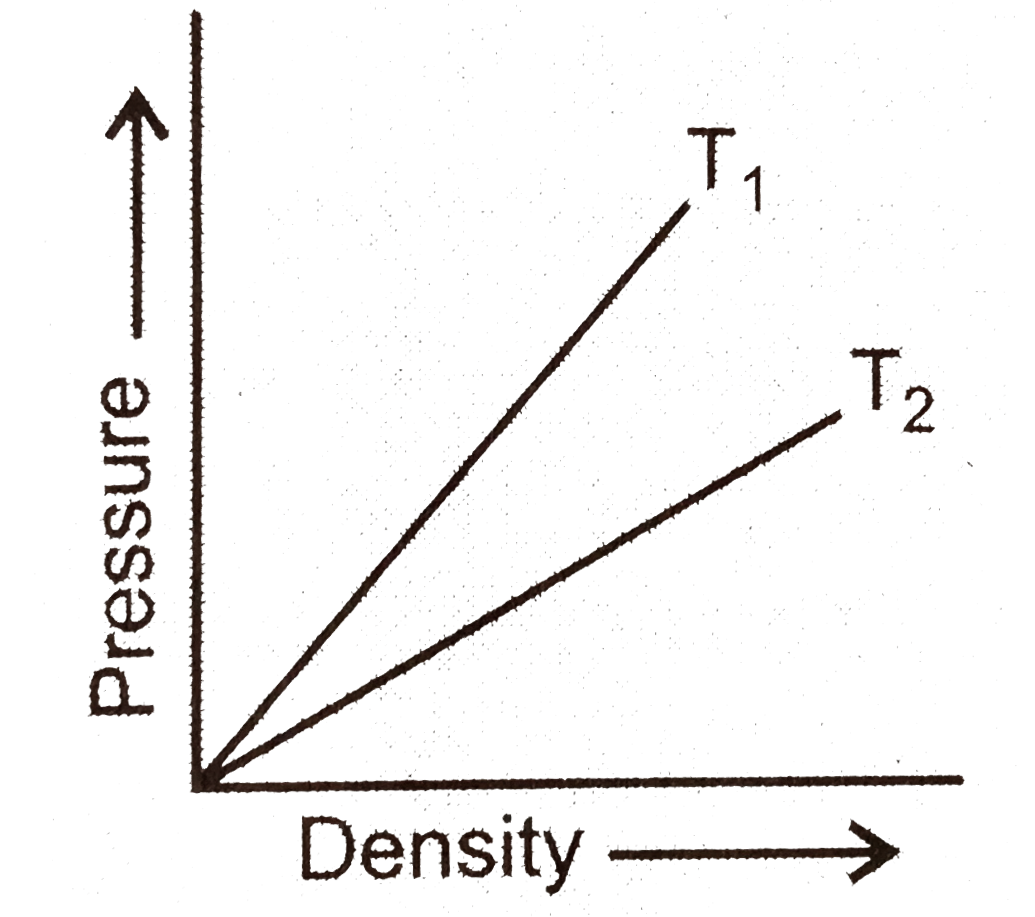
View SolutionFigure shows graphs of pressure versus density for an ideal gas at two temperatures T1 and T2 Which is correct ?
 .
.
View SolutionFigure shows the pressure P versus volume V graphs for a certains mass of a gas at two constant temperature T1andT2. Which of the following interface is correct?
View SolutionFor the following graph, drawn from two different samples of gases at two different temperatures T1andT2, which of the following statements is/are necessarily true?
View SolutionShow below are the black body radiation curves at temperature T1 and T2(T2>T1). Which of the following plots is correct?
View Solution

