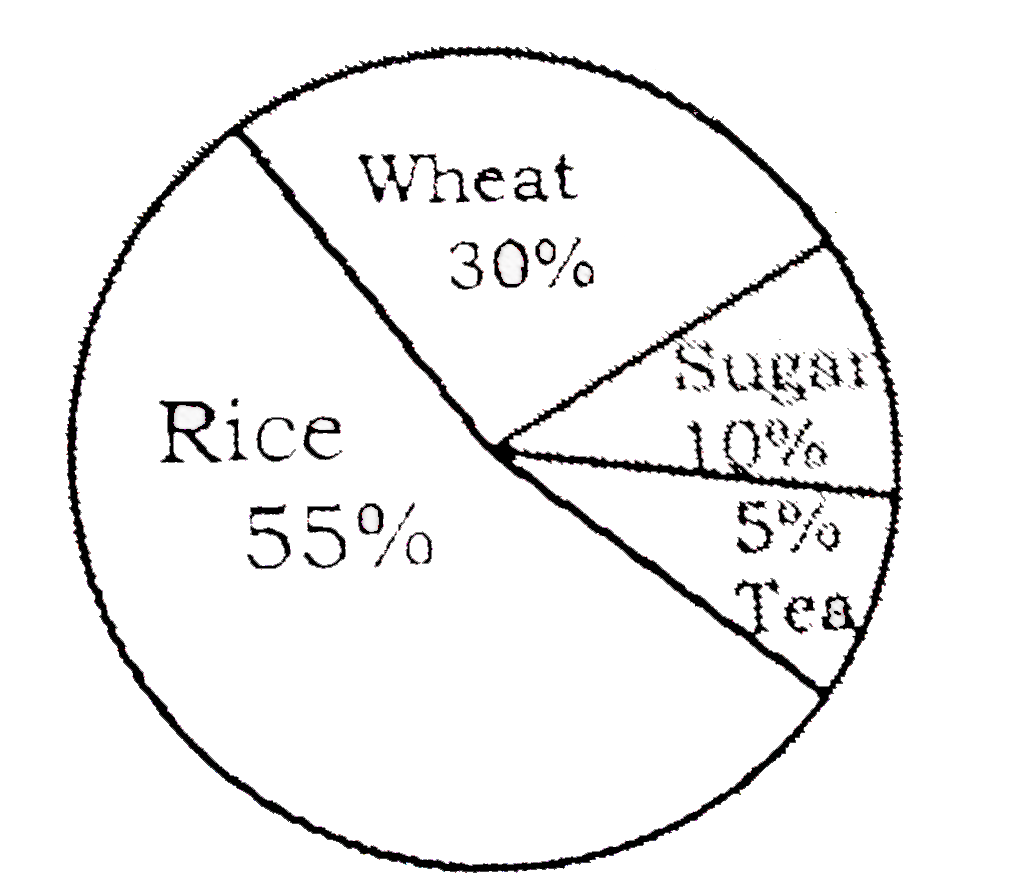
दिए गए पाई -चार्ट में देश में चावल, गेहूँ, चीनी और चाय के उत्पादन का तुलनात्मक अध्ययन किया गया है । निम्नलिखित प्रशनो के उत्तर ग्राफ को पढ़कर दीजिये|

चावल, गेहूँ,चीनी और चाय का कुल उत्पादन 500000 कि.ग्रा. है। देश में चावल का उत्पादन कितना है ?
175000 कि.ग्रा.
395000 कि.ग्रा.
275000 कि.ग्रा.
27500 कि.ग्रा.
Rice+wheat+sugar+tea=50000
55%+30%+10%+5%=50000
then rice 55%=500000100×55
=275000kg
Similar Questions
The pie-chart provided below gives the distribution of land (in a village) under various food crops. Study the pie-chart carefully and answer the questions. नीचे दिए गए वृत्तारेखा में विभिन खाद्य फसलों के ( एक गाँव में ) भूमि का वितरण दिखाया गया हैं। वृत्तारेखा का अध्ययन कीजिए और प्रश्नों के उत्तर दीजिए। If the production of rice is 5 times that of jowar and the production of jowar is 2 times that of bazra, then the ratio between the yield per acre of rice and bazra is यदि चावल का उत्पादन ज्वार का पांच गुना और ज्वार का उत्पादन बाजरे का दो गुना हो, तब चावल और बाजरे के प्रति एकड़ उत्पादन का अनुपात है-
02:17View SolutionThe bar graph provided below represents the production of rice and wheat in different states of a country in the certain year. Answer the questions based on the bar graph. नीचे दिये गया बार-ग्राफ एक निश्चित वर्ष में विभिन्न प्रदेशों में चावल और गेहूँ की उपज को दर्शाता है। इस ग्राफ पर आधारित प्रश्नों के उत्तर दें। The total production of rice and wheat in all the mentioned states in minimum in the state. दिये गये सभी प्रदेशों में से किस प्रदेश में चावल व गेहूँ को कुल उपज सबसे कम है?
01:35View SolutionThe bar graph provided below represents the production of rice and wheat in different states of a country in the certain year. Answer the questions based on the bar graph. नीचे दिये गया बार-ग्राफ एक निश्चित वर्ष में विभिन्न प्रदेशों में चावल और गेहूँ की उपज को दर्शाता है। इस ग्राफ पर आधारित प्रश्नों के उत्तर दें। The ratio of total production of rice in the mentioned states to that of wheat in those states, is दिये गये प्रदेशों में चावल की कुल उपज का गेहूँ की कुल उपज से अनुपात है-
03:01View SolutionThe bar graph provided below represents the production of rice and wheat in different states of a country in the certain year. Answer the questions based on the bar graph. नीचे दिये गया बार-ग्राफ एक निश्चित वर्ष में विभिन्न प्रदेशों में चावल और गेहूँ की उपज को दर्शाता है। इस ग्राफ पर आधारित प्रश्नों के उत्तर दें। The difference between the production in rice and wheat is maximum in- चावल की उपज और गेहूँ की उपज में अधि कतम अंतर है-
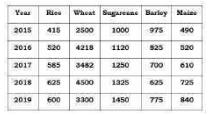
01:25View SolutionIn the following table, the production of various crops (in tonnes) is given from 2015 to 2019. Study the table and answer the question that follows:
दी गयी तालिका में, 2015 से 2019 तक विभिन्न फसलों का उत्पादन (टन में ) दिया गया है | इस तालिका का अध्ययन करें तथा फिर पूछे गए प्रश्न का उत्तर दीजिए | The difference (in tonnes) between the average production of barley and average production of rice is:
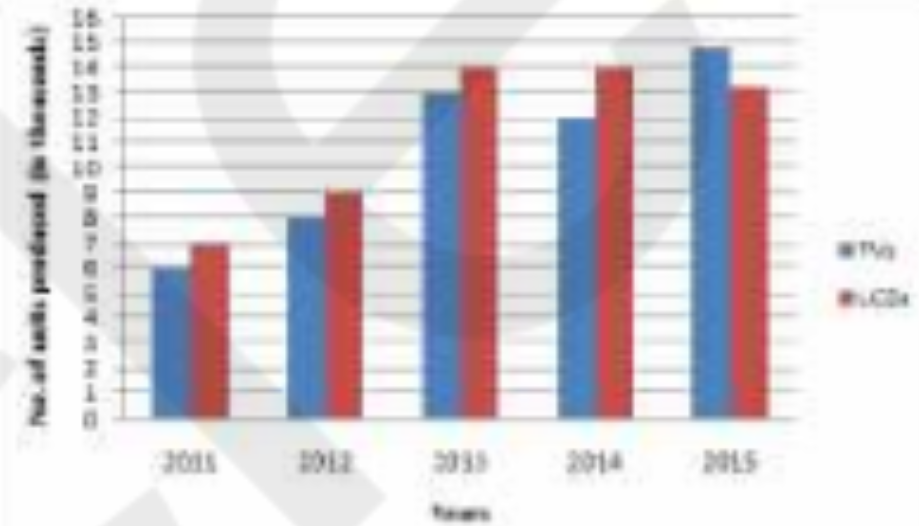
जौ के औसत उत्पादन तथा चावल के औसत उत्पादन के बीच क्या अंतर (टन में ) है?04:05View SolutionStudy the following bar diagram and answer the question that follows.
निम्नलिखित दंड आरेख का अध्ययन करें और उस प्रश्न का उत्तर दें जो पूछा गया है। The production (in thousands) of electronic items (TV and LCD) in a factory during the period from 2011 to 2015.
2011 से 2015 की अवधि के दौरान एक कारखाने में इलेक्ट्रॉनिक वस्तुओं (TV और LCD) का उत्पादन (हजारों में) The ratio of the total production of LCDs in the year 2012 and 2014 to the total production of TV’s in the year 2012 and 2014 is:
वर्ष 2012 और 2014 में एलसीडी के कुल उत्पादन और वर्ष 2012 और 2014 में टीवी के कुल उत्पादन का अनुपात है:02:18View SolutionStudy the following bar diagram carefully and answer the following questions :
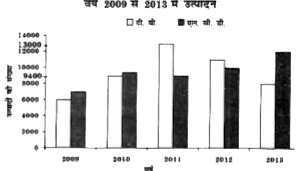
निम्नलिखित आरेख का ध्यानपूर्वक अध्ययन करें और दिए गए प्रश्नों का उत्तर दें:

The ratio of production of LCDs in the year 2011 and 2013 is.
वर्ष 2011 और 2013 में एल. सी. डी. के उत्पादन का अनुपात है02:05View SolutionStudy the following bar diagram carefully and answer the following questions : निम्नलिखित आरेख का ध्यानपूर्वक अध्ययन करें और दिए गए प्रश्नों का उत्तर दें: The ratio of production of TVs in the years 2009 and 2010 is. वर्ष 2009 और 2010 में टी. वी. के उत्पादन का अनुपात -
02:57View Solution

