दिए गए पाई -चार्ट में देश में चावल, गेहूँ , चीनी और चाय के उत्पादन का तुलनात्मक अध्ययन किया गया है । निम्नलिखित प्रशनो के उत्तर ग्राफ को पढ़कर दीजिये|
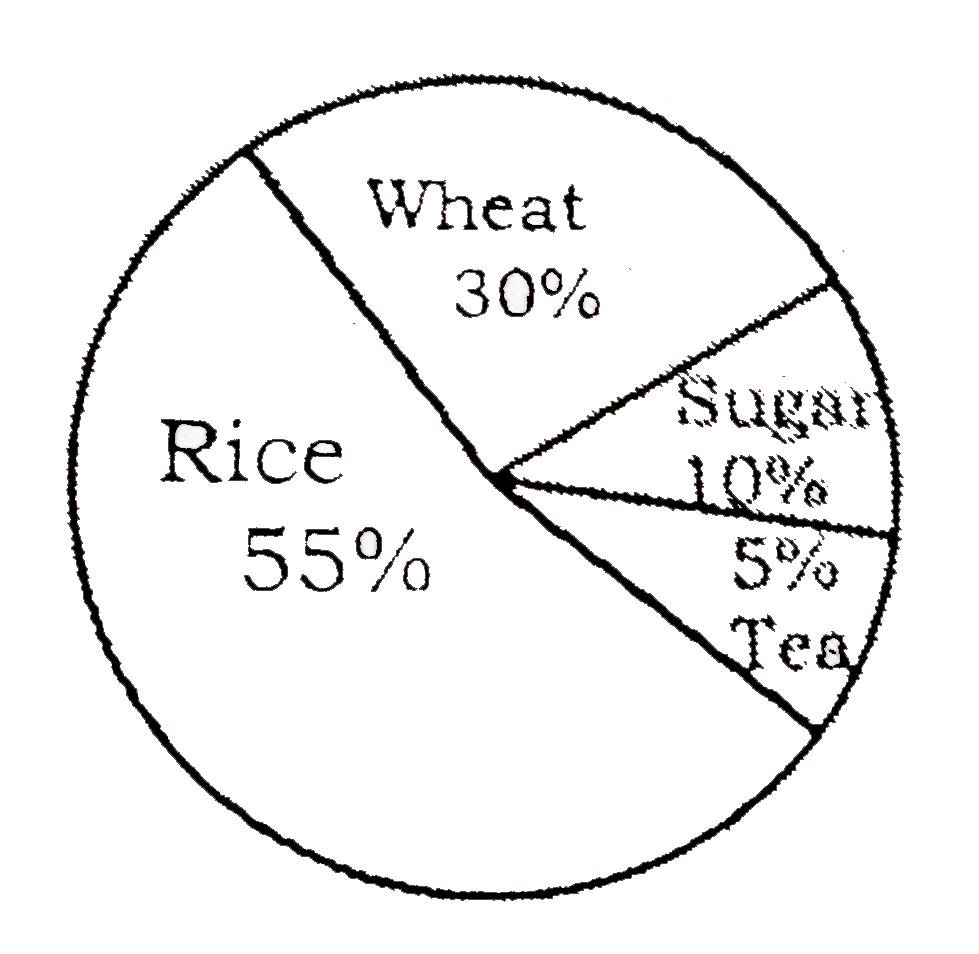
इस आरेख के अनुसार गेहूँ और चीनी के कुल उत्पादन तथा चावल और चाय के उत्पादन के अंतर का अनुपात कितना है?
4:5
5:4
6:1
1:6
(Whet+Sugar):(Roce-Tea)
(30+10):(55−5)
40:50
4:5
Similar Questions
The bar graph given below shows the target and actual production of cement ( in thousand tons ) during 2013-2017. The ratio of the target production in 2014 and 2016 to the actual total production in 2013, 2016 and 2017 is :
नीचे दिया गया दंड आरेख 2013-2017 के दौरान सीमेंट के लक्षित और वास्तविक उत्पादन (हजार टन में) को दर्शाता है |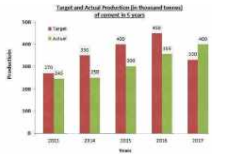
वर्ष 2014 और 2016 में सीमेंट के कुल लक्षित उत्पादन और 2013, 2016 तथा 2017 में कुल वास्तविक उत्पादन का अनुपात है :
View SolutionThe bar graph given below shows the target and actual production of cement ( in thousand tons ) during 2013-2017. What percentage of the total targeted production of cement from 2013 to 2017 is the total actual production in 2014, 2015 and 2017? ( correct to one decimal place )
नीचे दिया गया दंड आरेख 2013-2017 के दौरान सीमेंट के लक्षित और वास्तविक उत्पादन (हजार टन में) को दर्शाता है |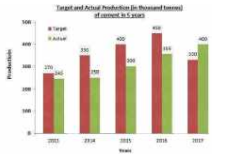
2013 से 2017 तक सीमेंट के कुल लक्षित उत्पादन का कितना प्रतिशत, 2014, 2015 और 2017 में कुल वास्तविक उत्पादन है ? (दशमलव के एक स्थान तक)
View SolutionIn the following table, the production of various crops (in tonnes) is given from 2015 to 2019. Study the table and answer the question that follows:
दी गयी तालिका में, 2015 से 2019 तक विभिन्न फसलों का उत्पादन (टन में ) दिया गया है | इस तालिका का अध्ययन करें तथा फिर पूछे गए प्रश्न का उत्तर दीजिए |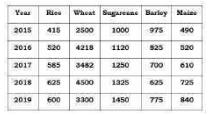 The difference (in tonnes) between the average production of barley and average production of rice is:
जौ के औसत उत्पादन तथा चावल के औसत उत्पादन के बीच क्या अंतर (टन में ) है?
View SolutionStudy the graph and answer the questions based on the graph:
आरेख का अध्ययन करें और आरेख के आधार पर प्रश्नों के उत्तर दें: On which day the production was 1/5 th of the total production?
किस दिन उत्पादन कुल उत्पादन का 1/5 था?
View SolutionStudy the following bar diagram carefully and answer the following questions :
निम्नलिखित आरेख का ध्यानपूर्वक अध्ययन करें और दिए गए प्रश्नों का उत्तर दें:
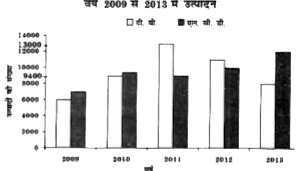
The ratio of production of LCDs in the year 2011 and 2013 is.
वर्ष 2011 और 2013 में एल. सी. डी. के उत्पादन का अनुपात है
View SolutionStudy the following bar diagram carefully and answer the following questions : निम्नलिखित आरेख का ध्यानपूर्वक अध्ययन करें और दिए गए प्रश्नों का उत्तर दें: The ratio of production of TVs in the years 2009 and 2010 is. वर्ष 2009 और 2010 में टी. वी. के उत्पादन का अनुपात -
View SolutionStatements : The Food and Agriculture Organization (FAO) has declared 2018 the International year of Rice, in an effort to highlight the increasing demands for rice among growing populations and production constraints for the commodity. Assumptions : I. There is an impending crisis of rice in several countries of the world. II. The year of Rice may act as a catalyst for country - driven programmers throughout the world. कथन : खाद्य और कृषि संगठन (एफएओ) ने 2018 को चावल का अंतर्राष्ट्रीय वर्ष घोषित किया है, जो कि कृषि के लिए बढ़ती आबादी और उत्पादन की कमी के बीच चावल की बढ़ती मांग को उजागर करने के प्रयास में है। पूर्वधारणा: दुनिया के कई देशों में चावल का एक आसन्न संकट है। गर. चावल का वर्ष पूरे देश में देश-आधारित प्रोग्राम के लिए उत्प्रेरक के रूप में कार्य कर सकता है।
View Solutionनिम्नलिखित में से कौन से कक्षक आरेख में पाउली के अपवर्जन सिद्धांत और हुंड के नियम दोनों का उल्लंघन किया गया है?
View Solution
