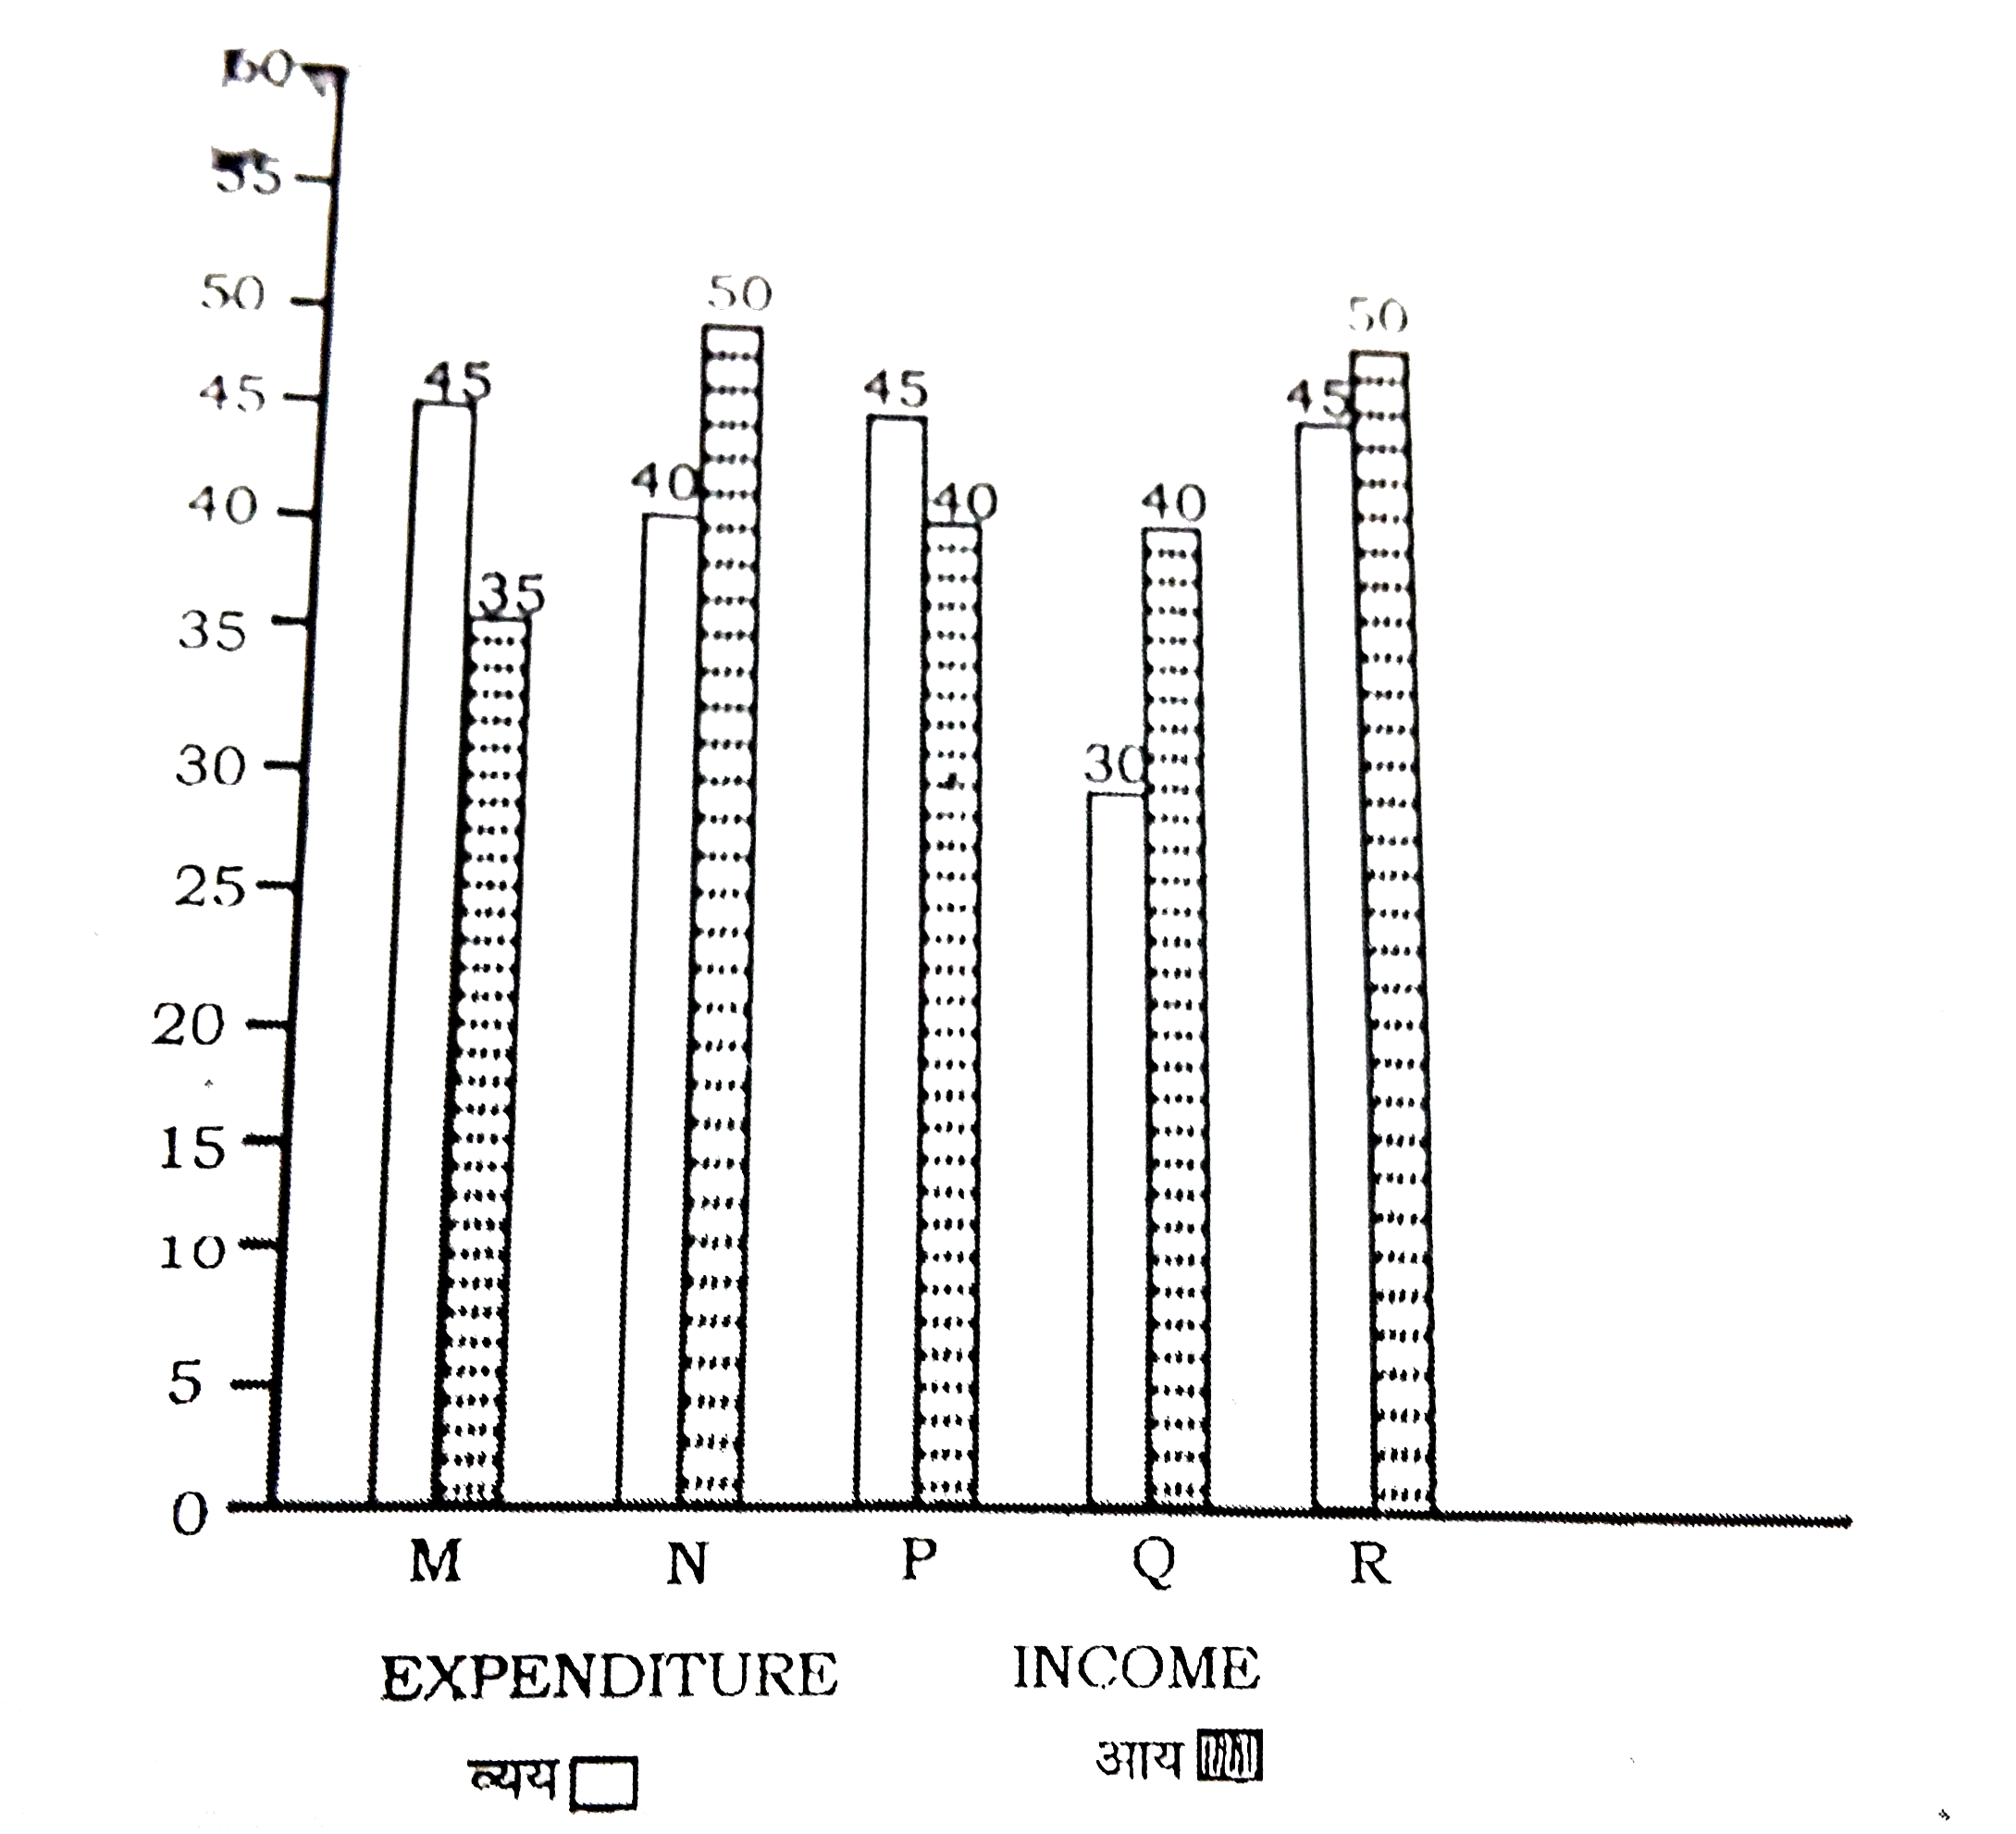
निर्देश :- बार चार्ट का अध्ययन कीजिये और प्रश्नो के उत्तर दीजिये ।

यदि कंपनी Q की आय 2001 में 2000 की तुलना में 10% अधिक हुई और कंपनी को 2000 में 20% का लाभ हुआ था तो 2000 में व्यय कितना (करोड़ रू ) हुआ था ?
32.32
28.28
34.34
29.09
Income of company q in 2001=40
Income of company Q in 2000=40×100110=36.36
Profit in 2000=36.36×20100=7.27
∴ Expenditure in 2000=36.36−7.27=29.09
Topper's Solved these Questions
Similar Questions
सरल करें: 1+11+22+31+45
View SolutionA एक काम को 6 दिनों में तथा B उसी काम को 9 दिनों में कर सकता है दोनों मिलकर उस काम को कितने दिन में पूरा करेंगे ?
View SolutionMatch the following Column A to Column B

View Solutionप्रश्न के उत्तर लगभग 30-40 शब्दों में लिखिए : कर्नल कालिंज का खेमा जंगल में क्यों लगा हुआ था।
View Solutionमुद्रण का जन्म कहाँ पर 868 ई० में हुआ था ?
View Solutionआर्थिक मंदी का दौर किस सन में हुआ था ?
View Solution'निर्मला' पुतुल' का जन्म किस परिवार में हुआ था ?
View Solutionमुद्रण' का जन्म कहाँ पर 868 ई० में हुआ था ?
View Solutionमहादेवी वर्मा का जन्म उत्तर प्रदेश के किस जिले में हुआ था?
View Solutionनरेन्द्र शर्मा का जन्म उत्तर प्रदेश के किस जिले में हुआ था?
View SolutionThe sum of incomes of A and B is 165000. A spends 70% of his income and B spends 80% of his income. If the savings of A is 25% more than that of B, then find the difference between their incomes ?
A और B की आय का योग 165000 है | A अपनी आय का 70% और B अपनी आय का 80% खर्च करते हैं | यदि A की बचत, B की तुलना में 25% अधिक हैं, तो उनकी आय में कितना अंतर हैं?
View SolutionThe given Bar Graph presents the sales of the number of books (in thousands) by six benches of a publishing company during two consecutive years 2000 and 2001. दिया गया दंड आरेख लगातार दो वर्षों : 2000 और 2001 में एक प्रकाशन कंपनी की छः शाखाओं के द्वारा बेची गयी पुस्तकों की संख्या ( हज़ार में ) दर्शाता है | The ratio of total sales by all branches for the year 2001 to total sales by all branches for the year 2000 is: वर्ष 2001 में सभी शाखाओं की कुल बिक्री का वर्ष 2000 में सभी शाखाओं की कुल बिक्री के साथ अनुपात ज्ञात करें|
View SolutionIn the given bar graph, the Blue bar shows the income and the Red bar shows the expenditure of a company. Study the graph and answer the question that follows
दिए गए दंड आरेख में, नीला दंड एक कंपनी की आय दिखाता है और लाल दंड खर्च (लाख रुपये में) को दर्शाता है। आरेख का अध्ययन करें और उस प्रश्न का उत्तर दें जो नीचे पूछा गया है। The percentage decrease in the income of the company in 2002 as compared to that in 2001 is:
2001 की तुलना में 2002 में कंपनी की आय में कितने प्रतिशत में कमी आई है:
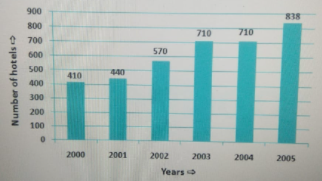
View SolutionStudy the chart and answer the questions:
In which of the given years is the percentage increase in the number of hotels in comparison to the previous year, is the maximum?
चार्ट का अध्ययन करें और प्रश्नों का उत्तर दें:पिछले वर्ष की तुलना में होटलों की संख्या में किस वर्ष में अधिकतम प्रतिशत वृद्धि हुई है?
View SolutionThe given Bar Graph presents Income and Expenditure (in crores of Rupees) of a company for five years, 2014 to 2018. What is the ratio of total Expenditure to total Income of the company in 2014,2016 and 2017? दिया गया दंड आरेख (बार ग्राफ) 5 वर्षों, 2014 से 2018 के दौरान किसी कंपनी की आय और व्यय (करोड़ रुपए में) को दर्शाता है| 2014, 2016 और 2017 में कंपनी के कुल व्यय और कुल आय का अनुपात क्या है?
View Solutionएक पंखे को ₹ 472. में बेचने पर क्रय मूल्य का 1/12 भाग लाभ के रूप में प्राप्त हुआ। उस पंखे पर प्रतिशत लाभ क्या था?
View Solution
