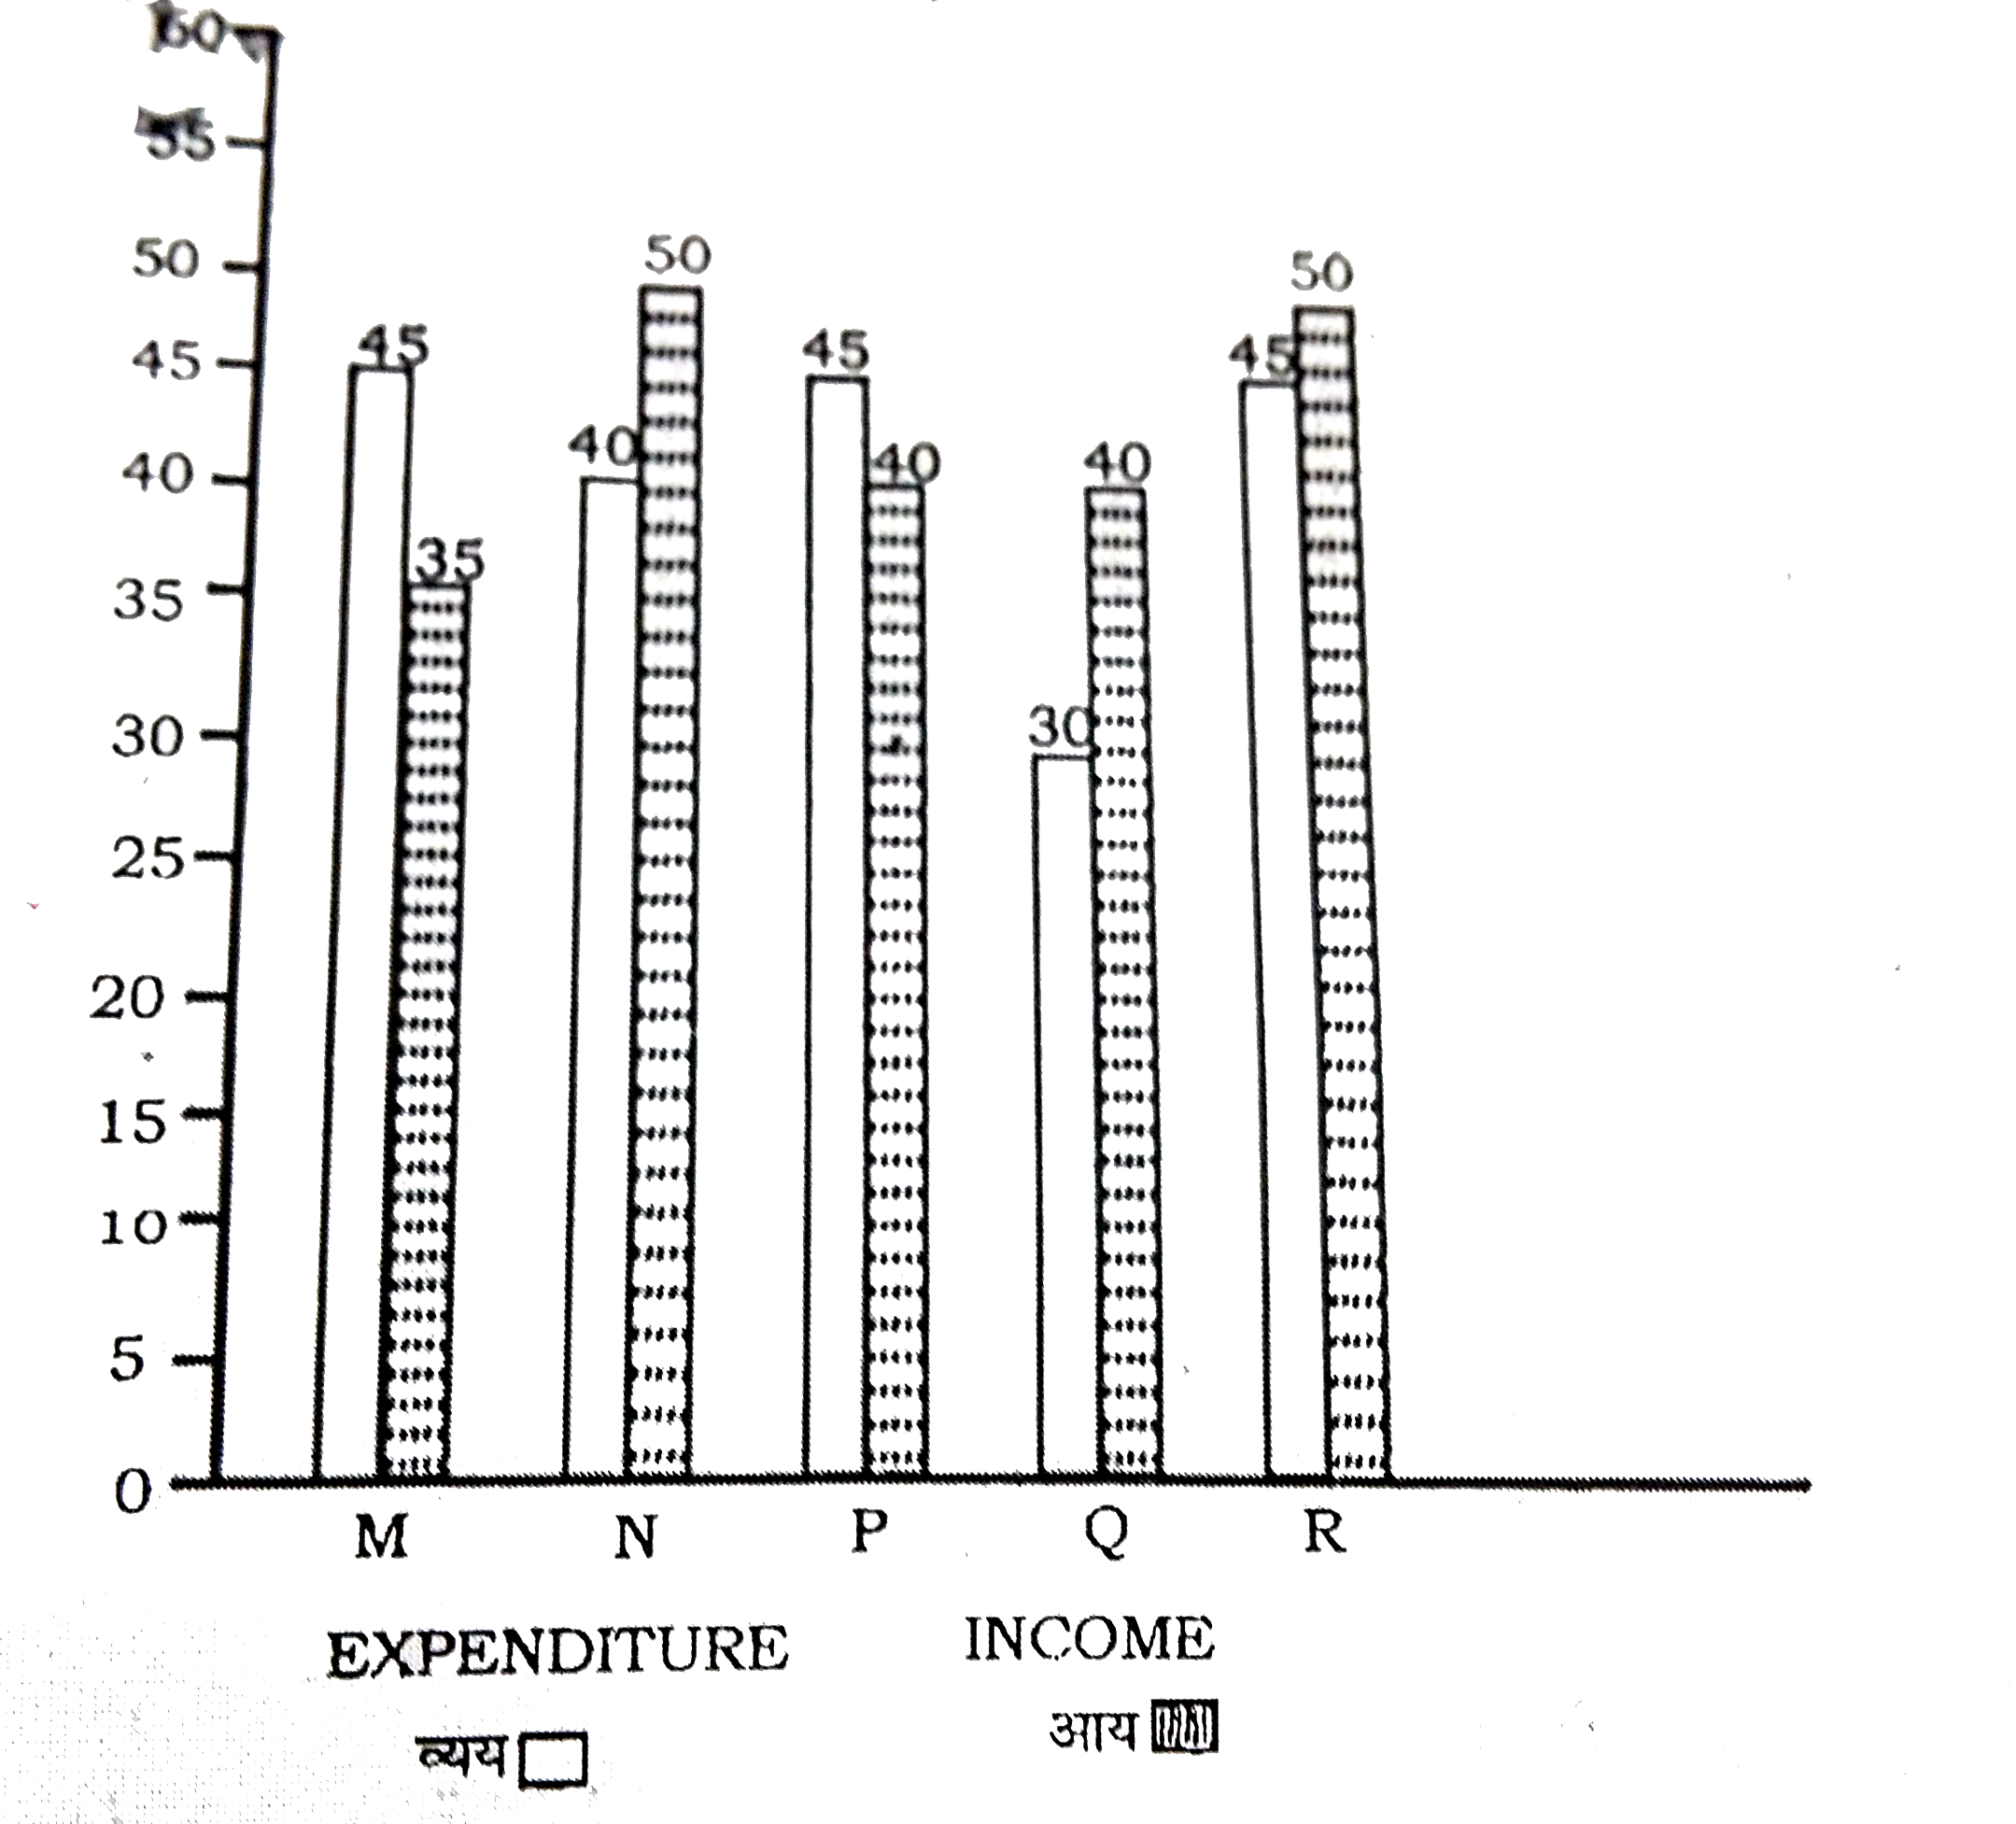
निर्देश :- बार चार्ट का अध्ययन कीजिये और प्रश्नो के उत्तर दीजिये ।

कंपनी R के व्यय में वर्ष 2001 में वर्ष 2000 की तुलना में 20% की वृद्धि हुई और कंपनी को वर्ष 2000 में 10% का लाभ हुआ था तो कंपनी की वर्ष 2000 में कितनी आय हुई थी ?
35.75
37.25
41.67
38.5
Expenditure in 2001 of R=45
Expenditure in 2000 of R=45×100120=37.5
The income of company in 2000=37.5×10090
Topper's Solved these Questions
Similar Questions
सरल करें: 1+11+22+31+45
View SolutionA एक काम को 6 दिनों में तथा B उसी काम को 9 दिनों में कर सकता है दोनों मिलकर उस काम को कितने दिन में पूरा करेंगे ?
View SolutionThe following line diagram represents the yearly sales figure of a company in the years 2001-2010. Examine the diagram and answer the question. निम्नलिखित रेखा आरेख किसी कंपनी की वर्ष 2007-2010 के दौरान वार्षिक बिक्री के आंकड़ों को दर्शाता है। आरेख का अध्ययन करें और नीचे दिए गए प्रश्नों के उत्तर दें- By what percent did the sales in 2008 decrease in comparison to the sales in 2006? वर्ष 2006 में बिक्री की तुलना में वर्ष 2008 में बिक्रो में कितने प्रतिशत की कमी आई?
View SolutionThe following line diagram represents the yearly sales figure of a company in the years 2001-2010. Examine the diagram and answer the question. निम्नलिखित रेखा आरेख किसी कंपनी की वर्ष 2007-2010 के दौरान वार्षिक बिक्री के आंकड़ों को दर्शाता है। आरेख का अध्ययन करें और नीचे दिए गए प्रश्नों के उत्तर दें- The ratio of sales in 2002 to that in 2007 is वर्ष 2002 में बिक्री का वर्ष 2007 में बिक्री के साथ अनुपात है-
View SolutionThe following line diagram represents the yearly sales figure of a company in the years 2001-2010. Examine the diagram and answer the question. निम्नलिखित रेखा आरेख किसी कंपनी की वर्ष 2007-2010 के दौरान वार्षिक बिक्री के आंकड़ों को दर्शाता है। आरेख का अध्ययन करें और नीचे दिए गए प्रश्नों के उत्तर दें- The percentage increase in sales in the year 2005 with respect to the previous year is वर्ष 2005 में पिछले वर्ष की तुलना में बिक्री में वृद्धि का प्रतिशत है-
View SolutionThe population of a town has increased by 5% at the end of the first year and decreased by 4% at the end of second year. If the population at the end of second year was 55,12,248, then the population at the beginning of first year was:
एक शहर की आबादी पहले वर्ष के अंत में 5% बढ़ी है और दूसरे वर्ष के अंत में 4% कम हुई। यदि दूसरे वर्ष के अंत में जनसंख्या 55,12,248 थी, तो पहले वर्ष की शुरुआत में जनसंख्या थी:
View SolutionSalary of A increased by 8% in the year 2015 as compared to 2014 and decreased by 6% in the year 2016 as compared to 2015. If his salary was Rs.2,34,778 in 2016, his salary (round off to nearest whole number) in 2014 was :
A के वेतन में वर्ष 2014 के मुकाबले वर्ष 2015 में 8% की वृद्धि हुई और 2015 के मुकाबले वर्ष 2016 में 6% की कमी हुई | यदि वर्ष 2016 में उसका वेतन रु 2, 34, 778 था तो 2014 में उसका वेतन (निकटतम संपूर्ण संख्या में पूर्णाकित) कितना था?
View SolutionThe given Bar Graph presents Income and Expenditure (in crores of Rupees) of a company for the five years, 2014 to 2018. दिया गया दंड आरेख पांच वर्षों अर्थात 2014 से 2018 तक एक कंपनी के आय एवं व्यय ( करोड़ रुपये में ) को दर्शाता है | In which year is the Expenditure more than 40% as compared to the Expenditure in the previous year? किस वर्ष में व्यय पिछले वर्ष के व्यय की तुलना में 40% अधिक है ?
View SolutionThe given Bar Graph presents the sales of the number of books (in thousands) by six benches of a publishing company during two consecutive years 2000 and 2001. दिया गया दंड आरेख लगातार दो वर्षों : 2000 और 2001 में एक प्रकाशन कंपनी की छः शाखाओं के द्वारा बेची गयी पुस्तकों की संख्या ( हज़ार में ) दर्शाता है | The ratio of total sales by all branches for the year 2001 to total sales by all branches for the year 2000 is: वर्ष 2001 में सभी शाखाओं की कुल बिक्री का वर्ष 2000 में सभी शाखाओं की कुल बिक्री के साथ अनुपात ज्ञात करें|
View SolutionThe given bar graph shows the sale of books (in thousands) in four metropolitan branches of a company for the year 2014 and 2015. दिया गया बार ग्राफ वर्ष 2014 और 2015 के लिए किसी कंपनी की चार महानगरीय शाखाओं में पुस्तकों की (हज़ारो में ) बिक्री को दर्शाता है | In the given bar graph, compared to 2014, which of the branch saw maximum increase in sales (in%) in 2015? दिए गए बार ग्राफ में, 2014 की तुलना में 2015में कौन सी शाखा की बिक्री में अधिकतम वृद्धि (% में ) हुई ?
View SolutionIn the given bar graph, the Blue bar shows the income and the Red bar shows the expenditure of a company. Study the graph and answer the question that follows
दिए गए दंड आरेख में, नीला दंड एक कंपनी की आय दिखाता है और लाल दंड खर्च (लाख रुपये में) को दर्शाता है। आरेख का अध्ययन करें और उस प्रश्न का उत्तर दें जो नीचे पूछा गया है। The percentage decrease in the income of the company in 2002 as compared to that in 2001 is:
2001 की तुलना में 2002 में कंपनी की आय में कितने प्रतिशत में कमी आई है:
View SolutionStudy the given chart carefully and answer the question accordingly:
दिए गए चार्ट का ध्यानपूर्वक अध्ययन करें और उसके अनुसार प्रश्न का उत्तर दें: In which of the following years was the percentage increase in production from the previous year, the maximum among the given years?
पिछले वर्ष की तुलना में निम्नलिखित वर्षों में से किस वर्ष में उत्पादन में अधिकतम प्रतिशत वृद्धि हुई?
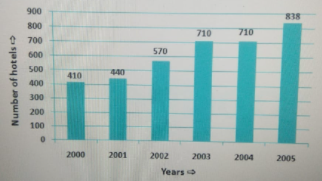
View SolutionStudy the chart and answer the questions:
In which of the given years is the percentage increase in the number of hotels in comparison to the previous year, is the maximum?
चार्ट का अध्ययन करें और प्रश्नों का उत्तर दें:पिछले वर्ष की तुलना में होटलों की संख्या में किस वर्ष में अधिकतम प्रतिशत वृद्धि हुई है?
View SolutionThe given Bar Graph presents Income and Expenditure (in crores of Rupees) of a company for five years, 2014 to 2018. In which year is the Expenditure more than 40% as compared to the Expenditure in the previous year? दिया गया दंड आरेख (बार ग्राफ) 5 वर्षो, 2014 से 2018 के दौरान किसी कंपनी की आय और व्यय (करोड़ रुपए में) को दर्शाता है| पिछले वर्ष के व्यय की तुलना में किस वर्ष में वह 40% अधिक है?
View SolutionThe given Bar Graph presents the Revenue and Expenditure (in crores of Rupees ) of a company during the five year period , 2014 - 2018. दिया गया दंड आरेख (bar graph) 5 वर्ष की अवधि 2014-2018 के दौरान किसी कंपनी के राजस्व और व्यय (करोड़ रुपए में ) को दर्शाता है। The expenditure of the company in 2017 is what percentage less than the average revenue ( per year ) in 2014, 2015 and 2016 ? वर्ष 2017 में कंपनी का व्यय, वर्ष 2014, 2015 और 2016 में औसत राजस्व (प्रति वर्ष) से कितने प्रतिशत कम है?
View SolutionThe given Bar Graph presents the Revenue of Expenditure (in crores of rupees) of a company during the five year period, 2014 - 2018. दिया गया दंड आरेख (Bar graph) 5 वर्ष की अवधि 2014-2018 के दौरान किसी कंपनी के राजस्व और व्यय (करोड़ रुपए में) को दर्शाता है| किस वर्ष में राजस्व में प्रति प्रतिशत वृद्धि इसके पिछले वर्ष की तुलना में 5% और 8% के बीच है? In which year the percentage increase in revenue as compared to that in its preceding year is between 5% and 8% ?
View Solution
