V–t graph is obtained as shown in the figure. The work done by the force is represented by the path–
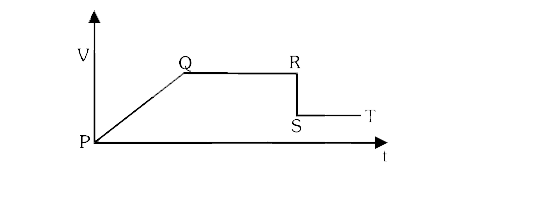
PQ
QR
RS
ST
The correct Answer is:A
Step by step video, text & image solution for V–t graph is obtained as shown in the figure. The work done by the force is represented by the path– by Physics experts to help you in doubts & scoring excellent marks in Class 12 exams.
Topper's Solved these Questions
- BOOK - MOTIONCHAPTER - WORK, POWER & ENERGY EXERCISE - Exercise - 3 Section-A25videos
WORK, POWER & ENERGY
- BOOK - MOTIONCHAPTER - WORK, POWER & ENERGY EXERCISE - Exercise - 3 Section-B22videos
WORK, POWER & ENERGY
- BOOK - MOTIONCHAPTER - WORK, POWER & ENERGY EXERCISE - Exercise - 142videos
WORK, POWER & ENERGY
- BOOK - MOTIONCHAPTER - WAVESEXERCISE - EXERCISE -4 (Level -II) (previous year JEE Advanced)10videos
WAVES
Similar Questions
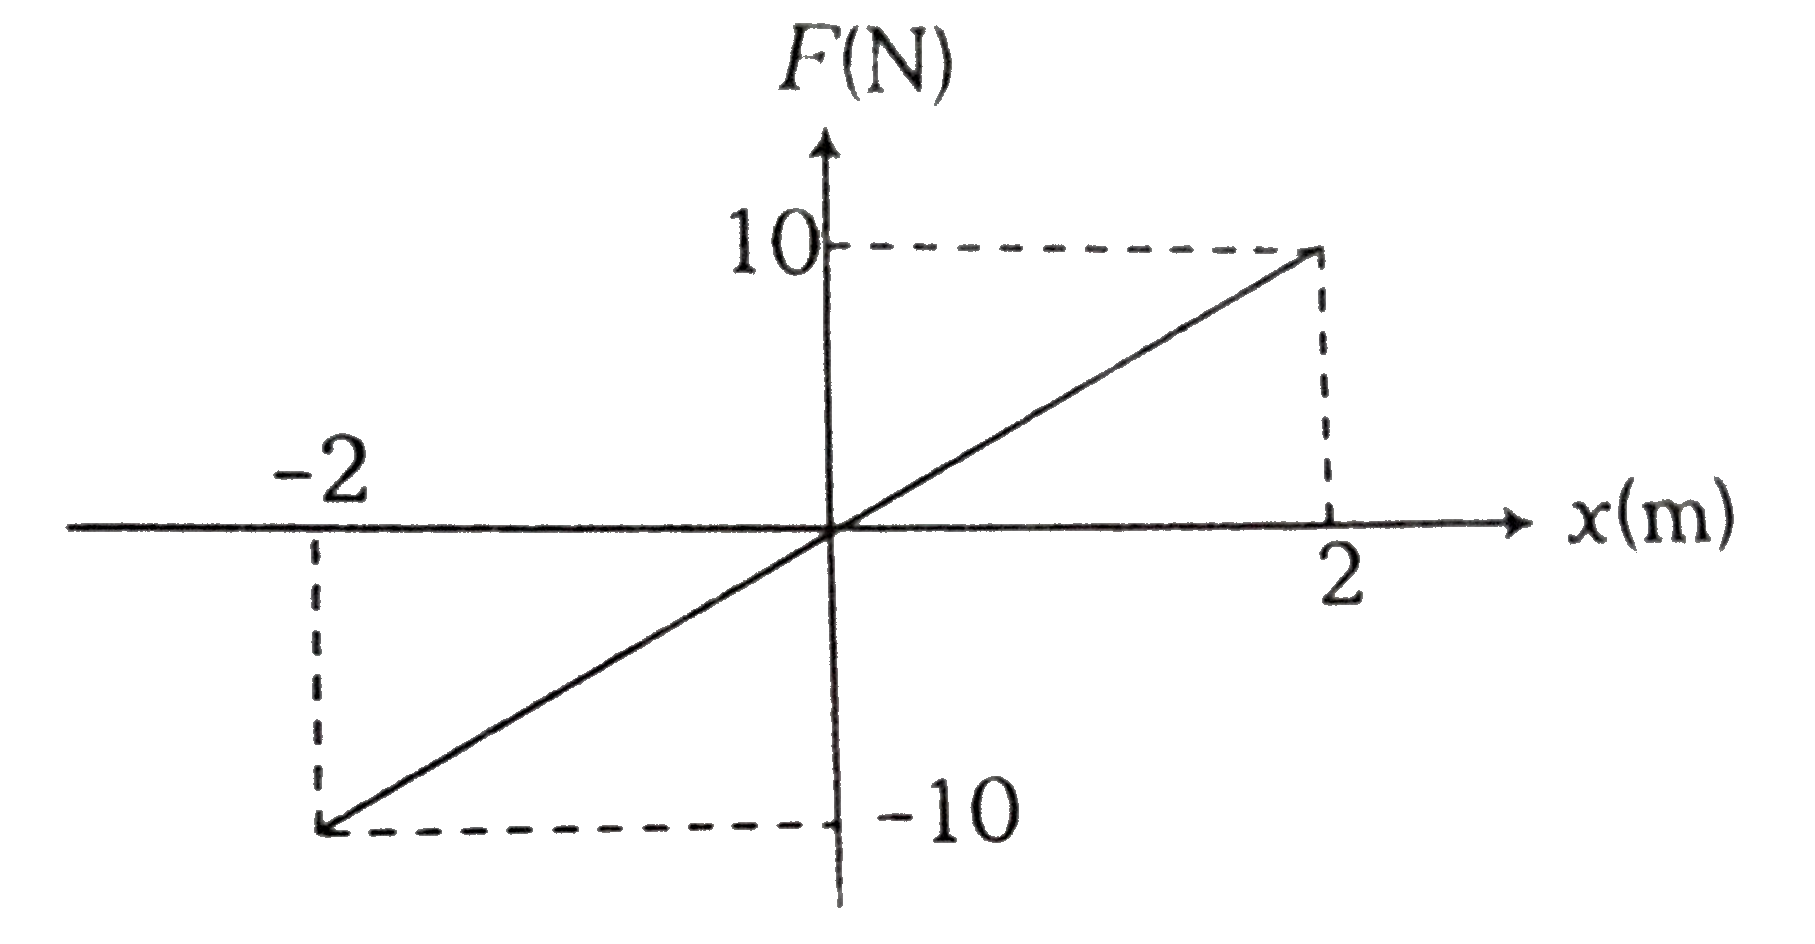
A force F acting on a particle varies with the position x as shown in figure. Find the work done by this force in displacing the particle from
 View Solution
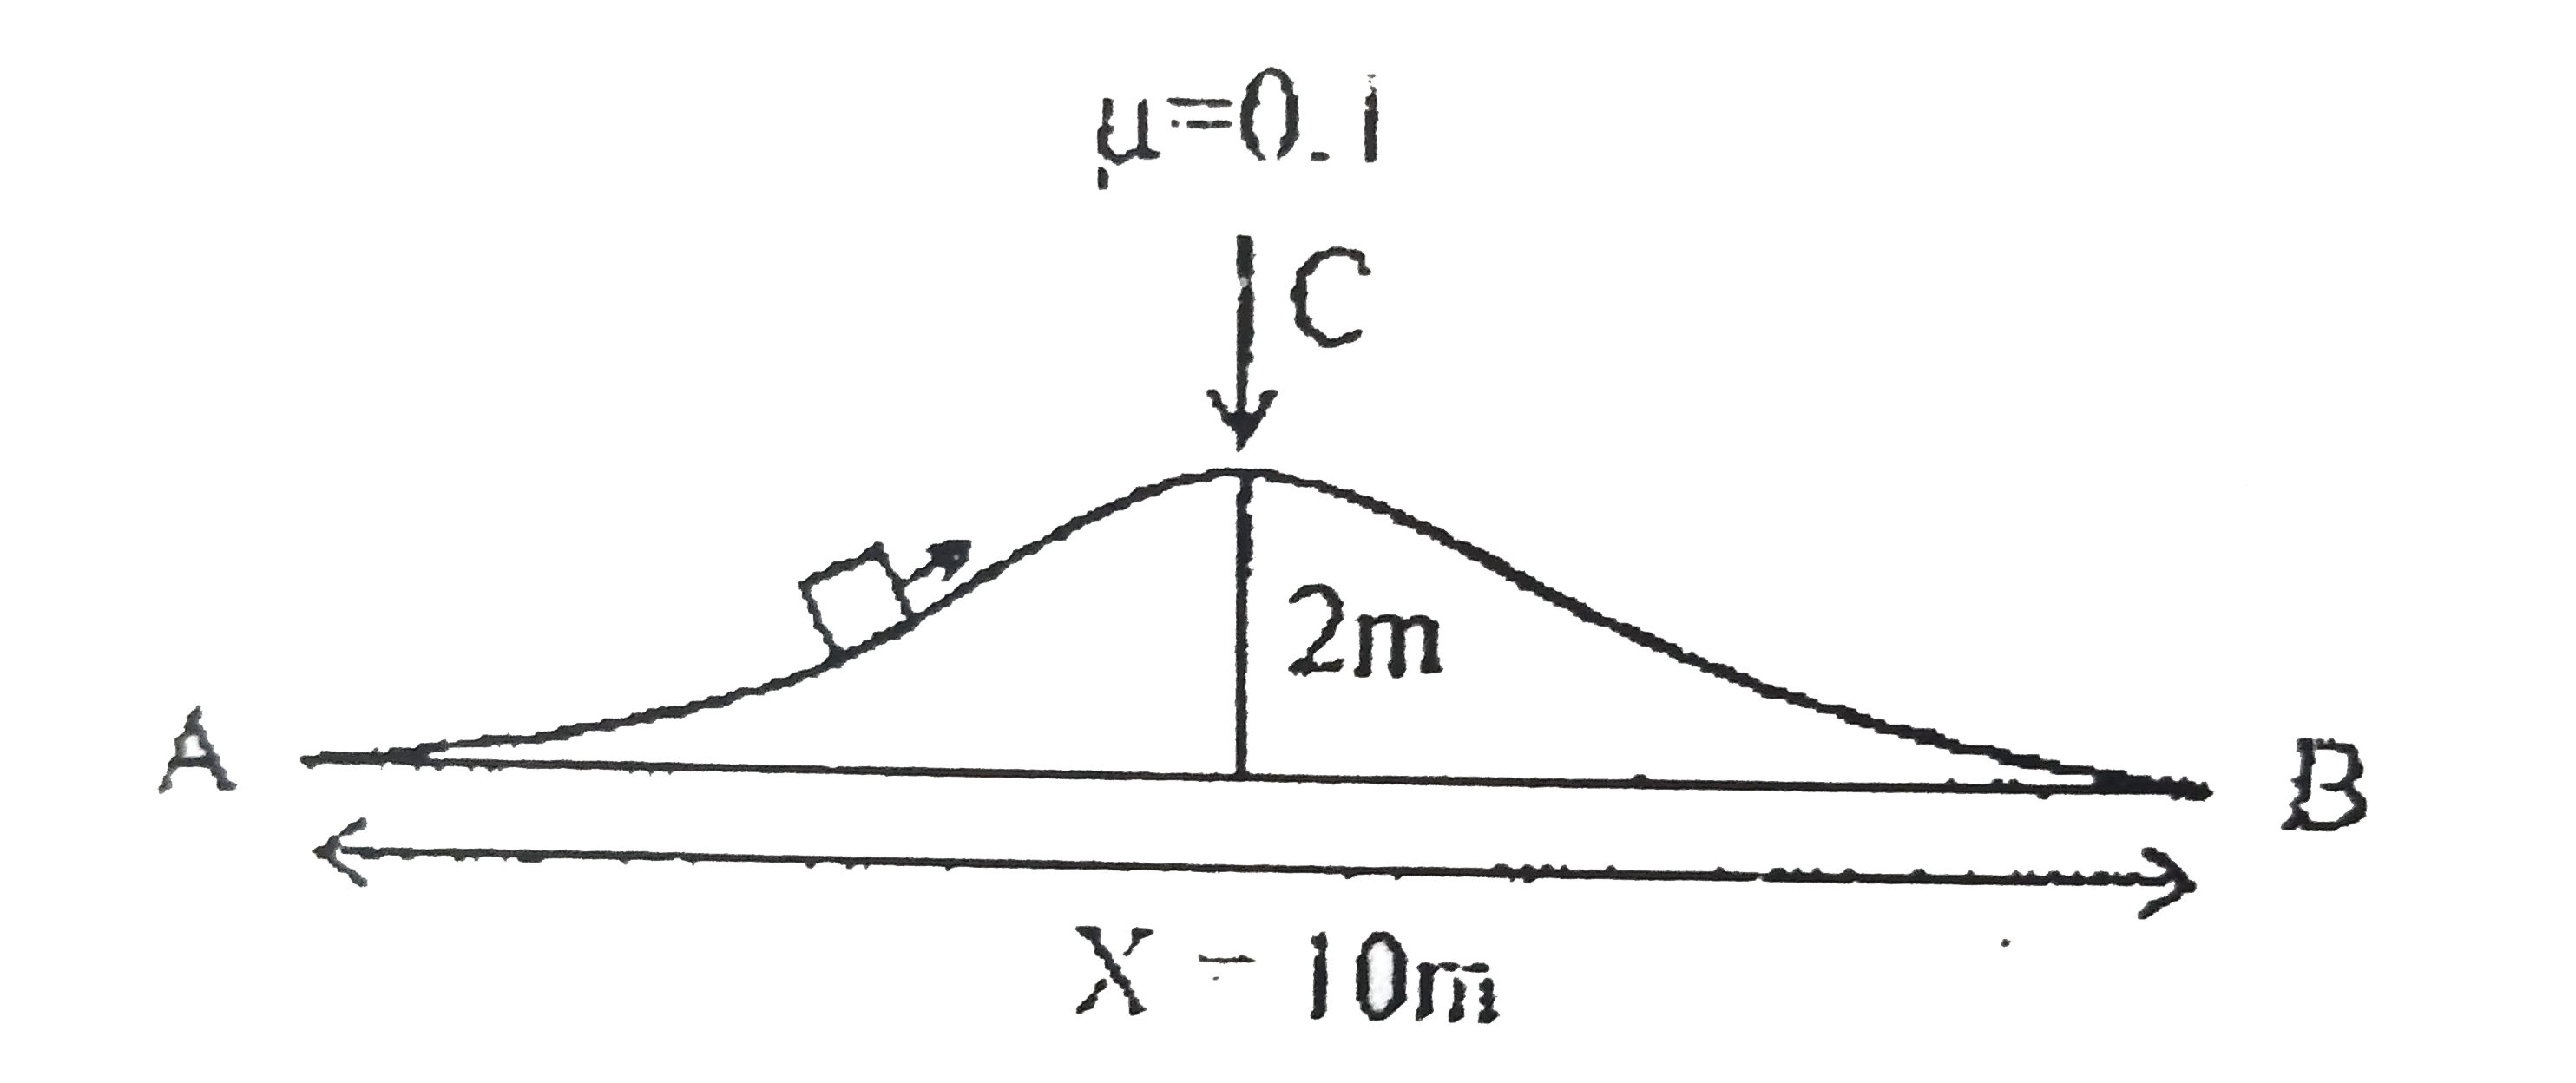
A block of mass 0.4kg is pulled along the curve path CAN slowly by a tangential force as shown in figure. The work done by the applied force when the block moves from A to B is
 View Solution
Knowledge Check
- Question 1 - Select One
An ideal gas is taken along the path AB as shown in the figure. The work done by the gas is
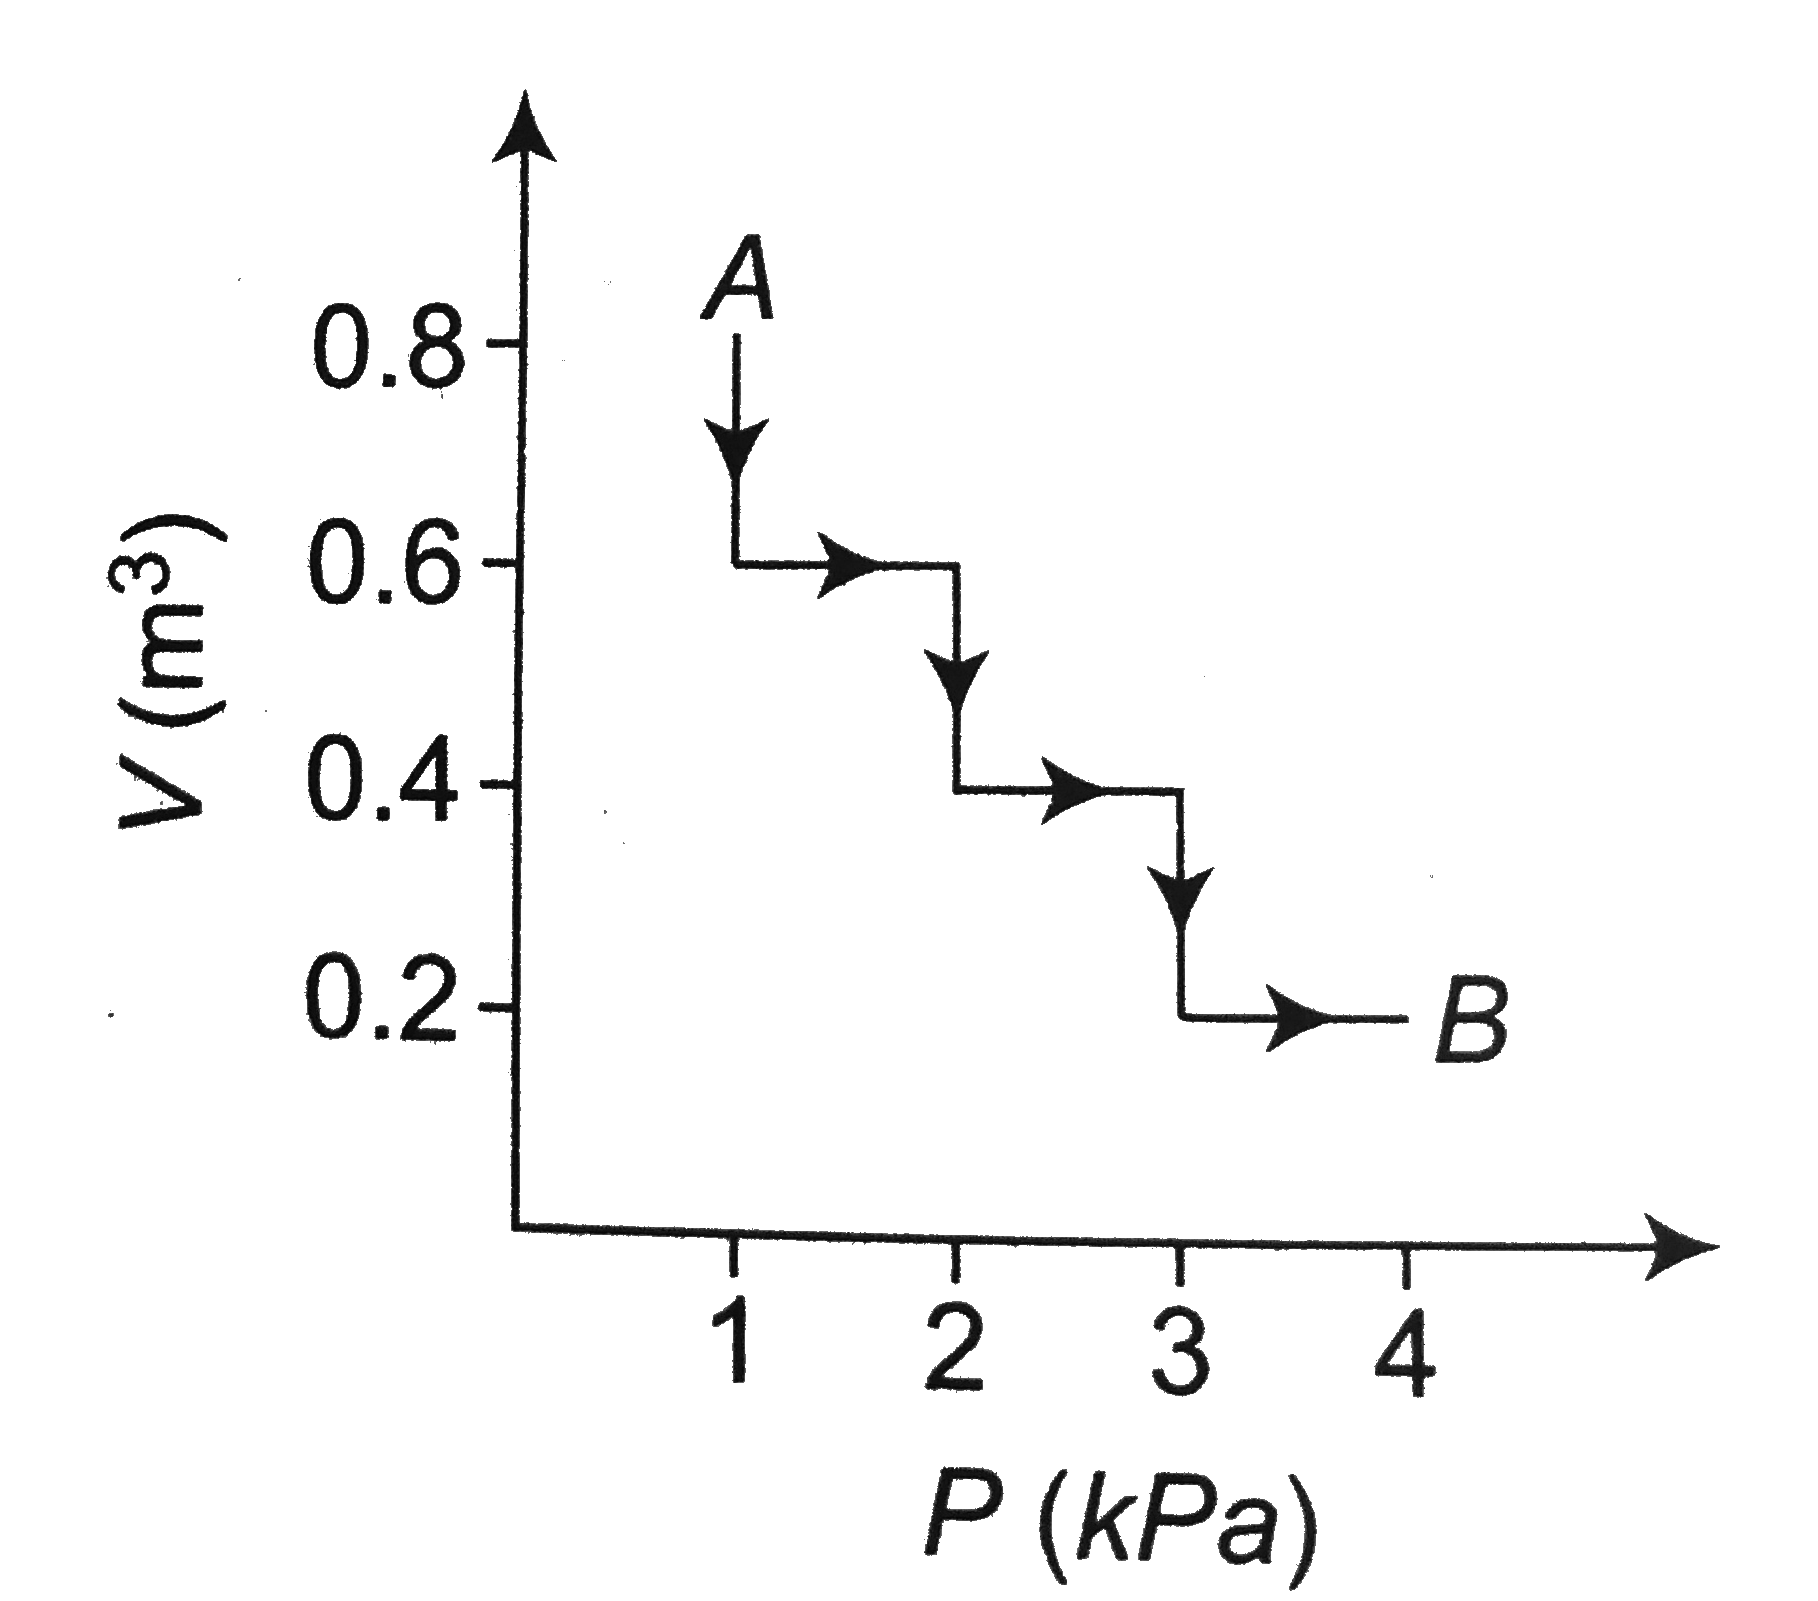 A600JB1200JC−600JD−1200J
 - Question 2 - Select One
A force F acting on a particle varies with the position x as shown in the graph. Find the work done by the force in displacing the particle from x=−a to x=+2a.
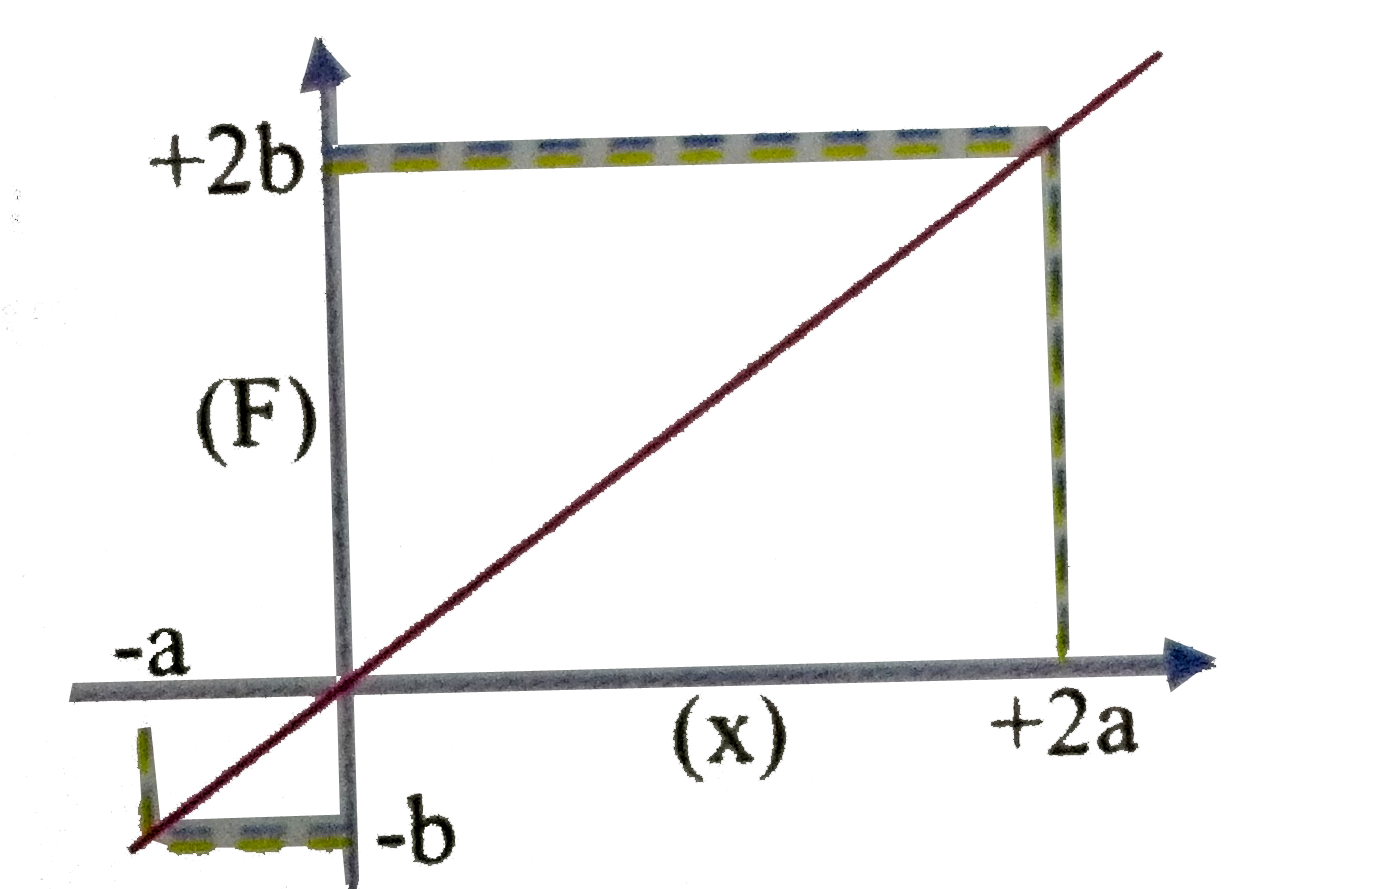 .A3ab2B4ab2C23abD24ab
 - Question 3 - Select One
Asseration : Displacement time graph of a particle moving in a straight line is shown in figure. Work done by all the forces between time interval t1 and t2 is definitely zero.
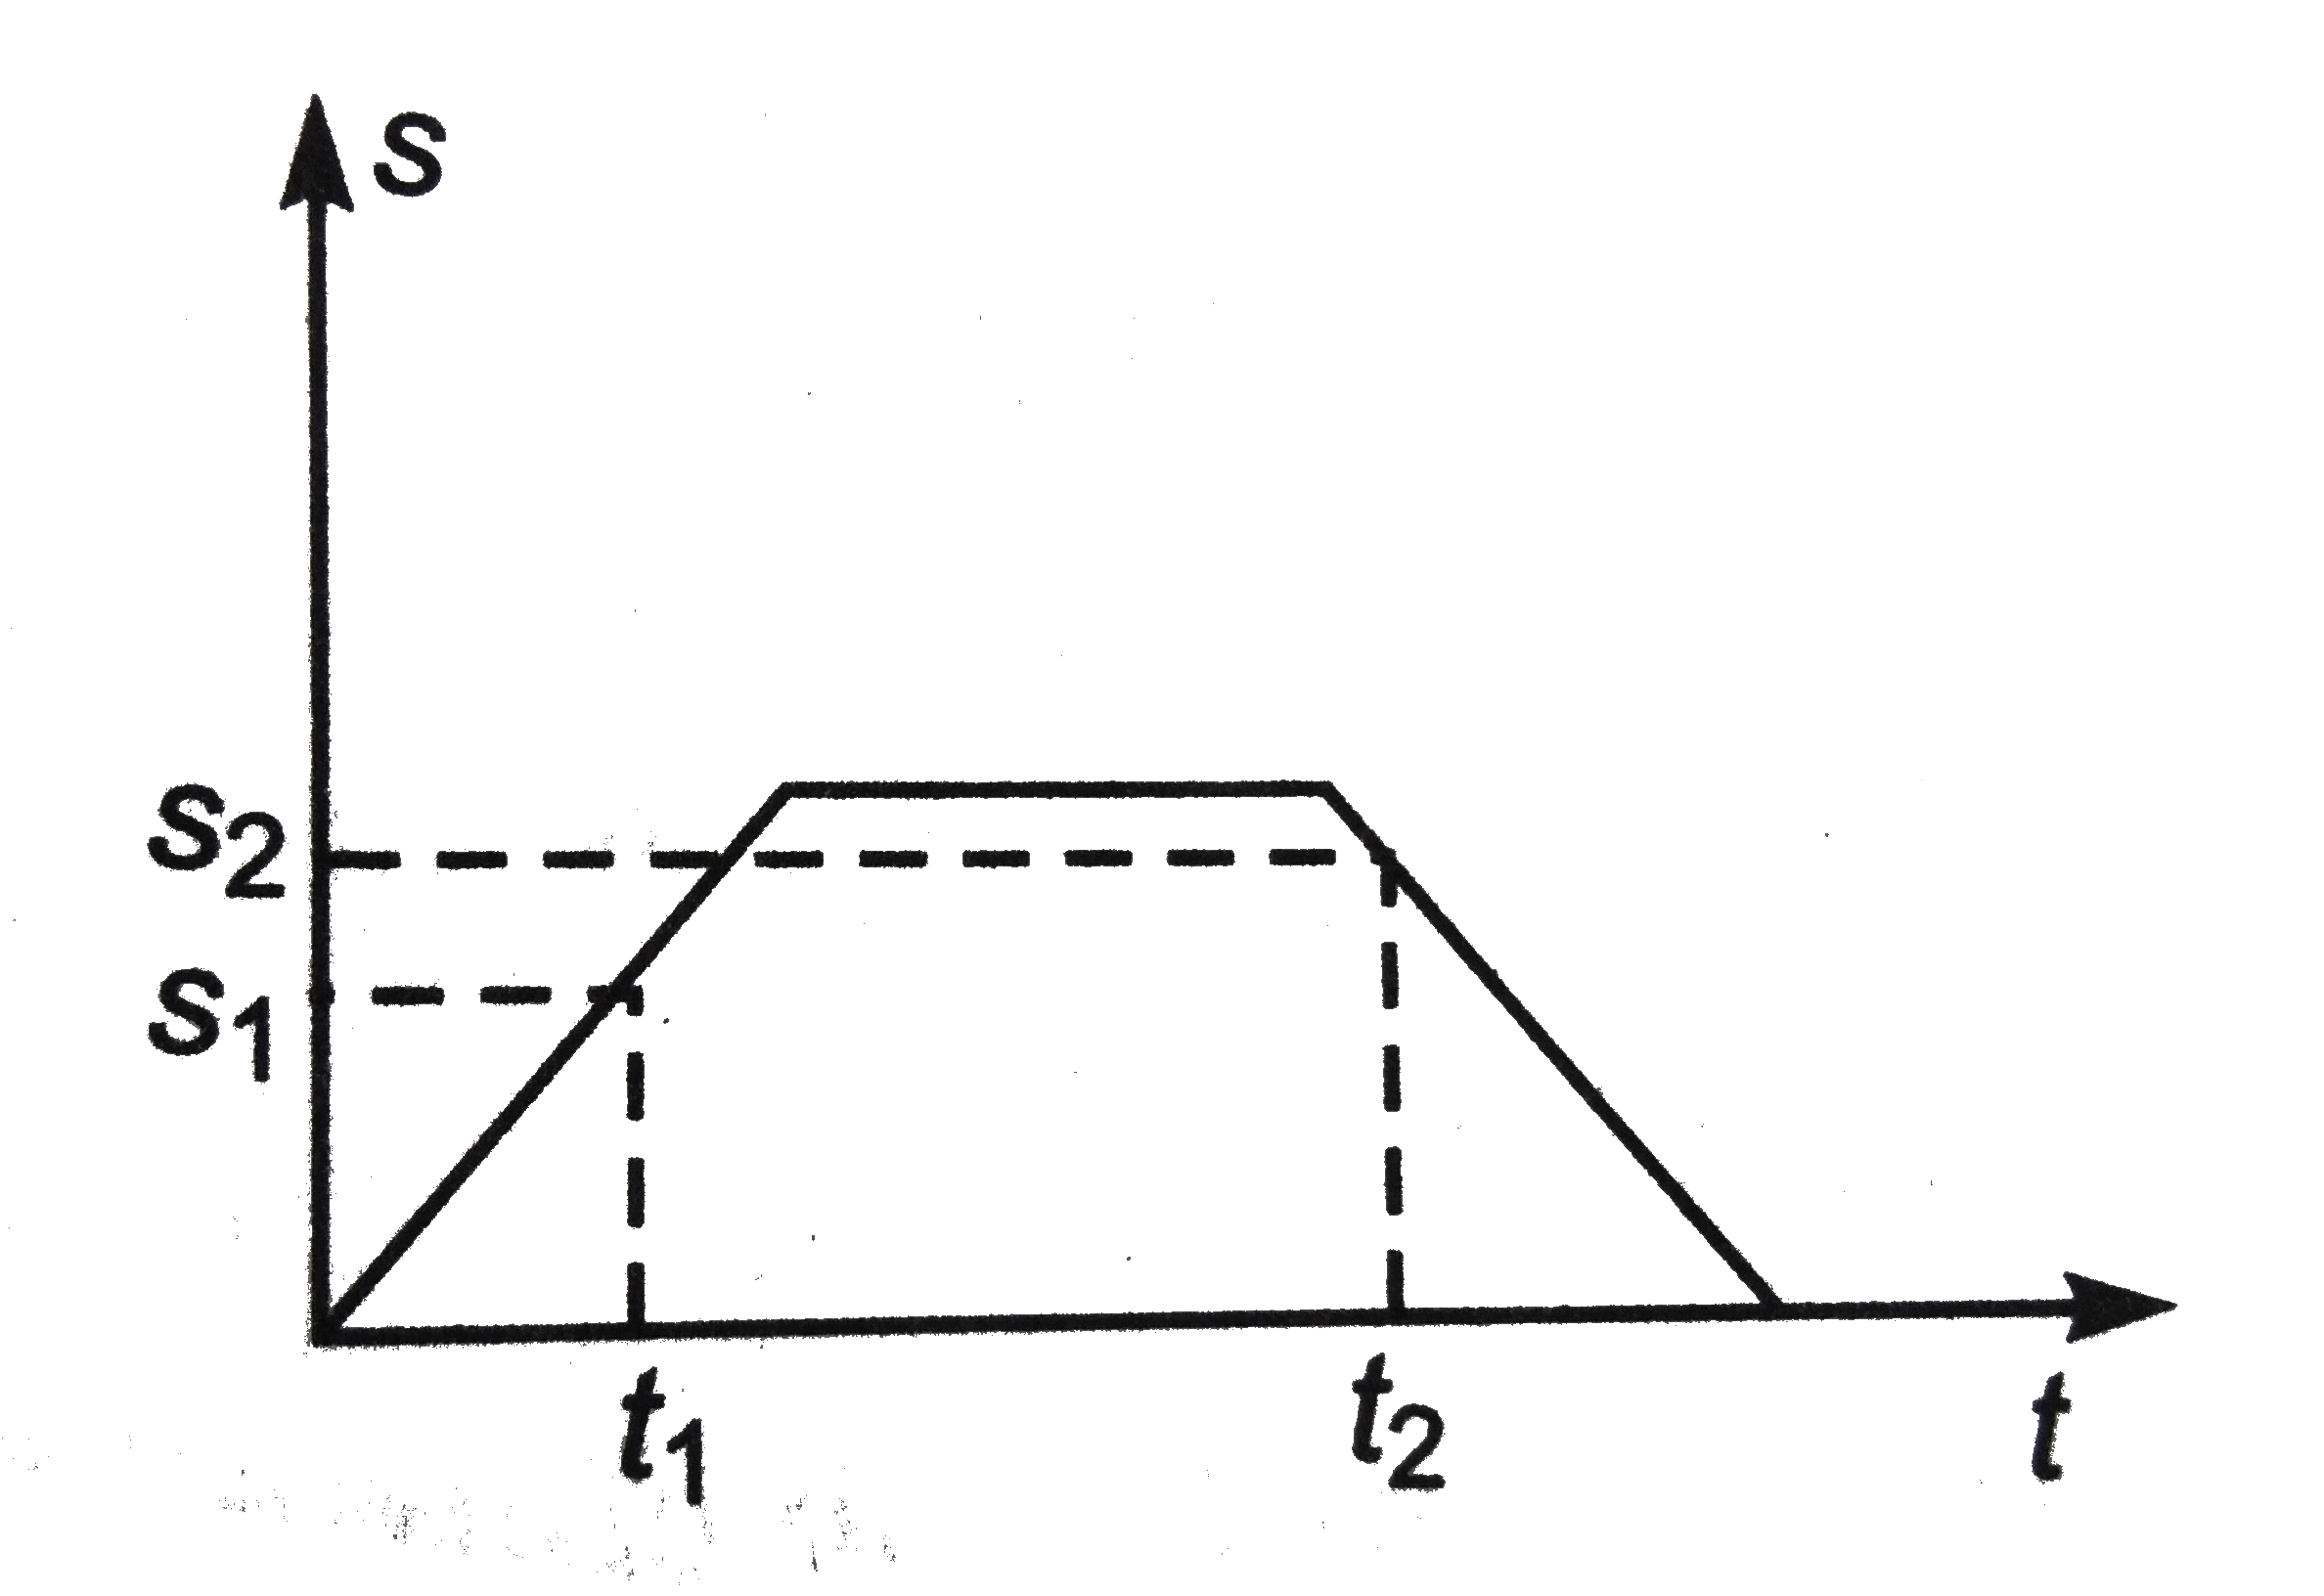 ,
,
Reason : Work done by all the forces is equal to change in kinetic energy.AIf both Assertion and Reason are true and the Reason is correct explanation of the Assertion.BIf both Assertion and Reason are true and the Reason is not the correct explanation of the Assertion.CIf Assertion is true, but the Reason is falseDIf Assertion is false but the Reason is true.
A body moves from point A to B under the action of a force, varying in magnitude as shown in figure. Obtain the work done. Force is expressed in newton and displacement in meter.
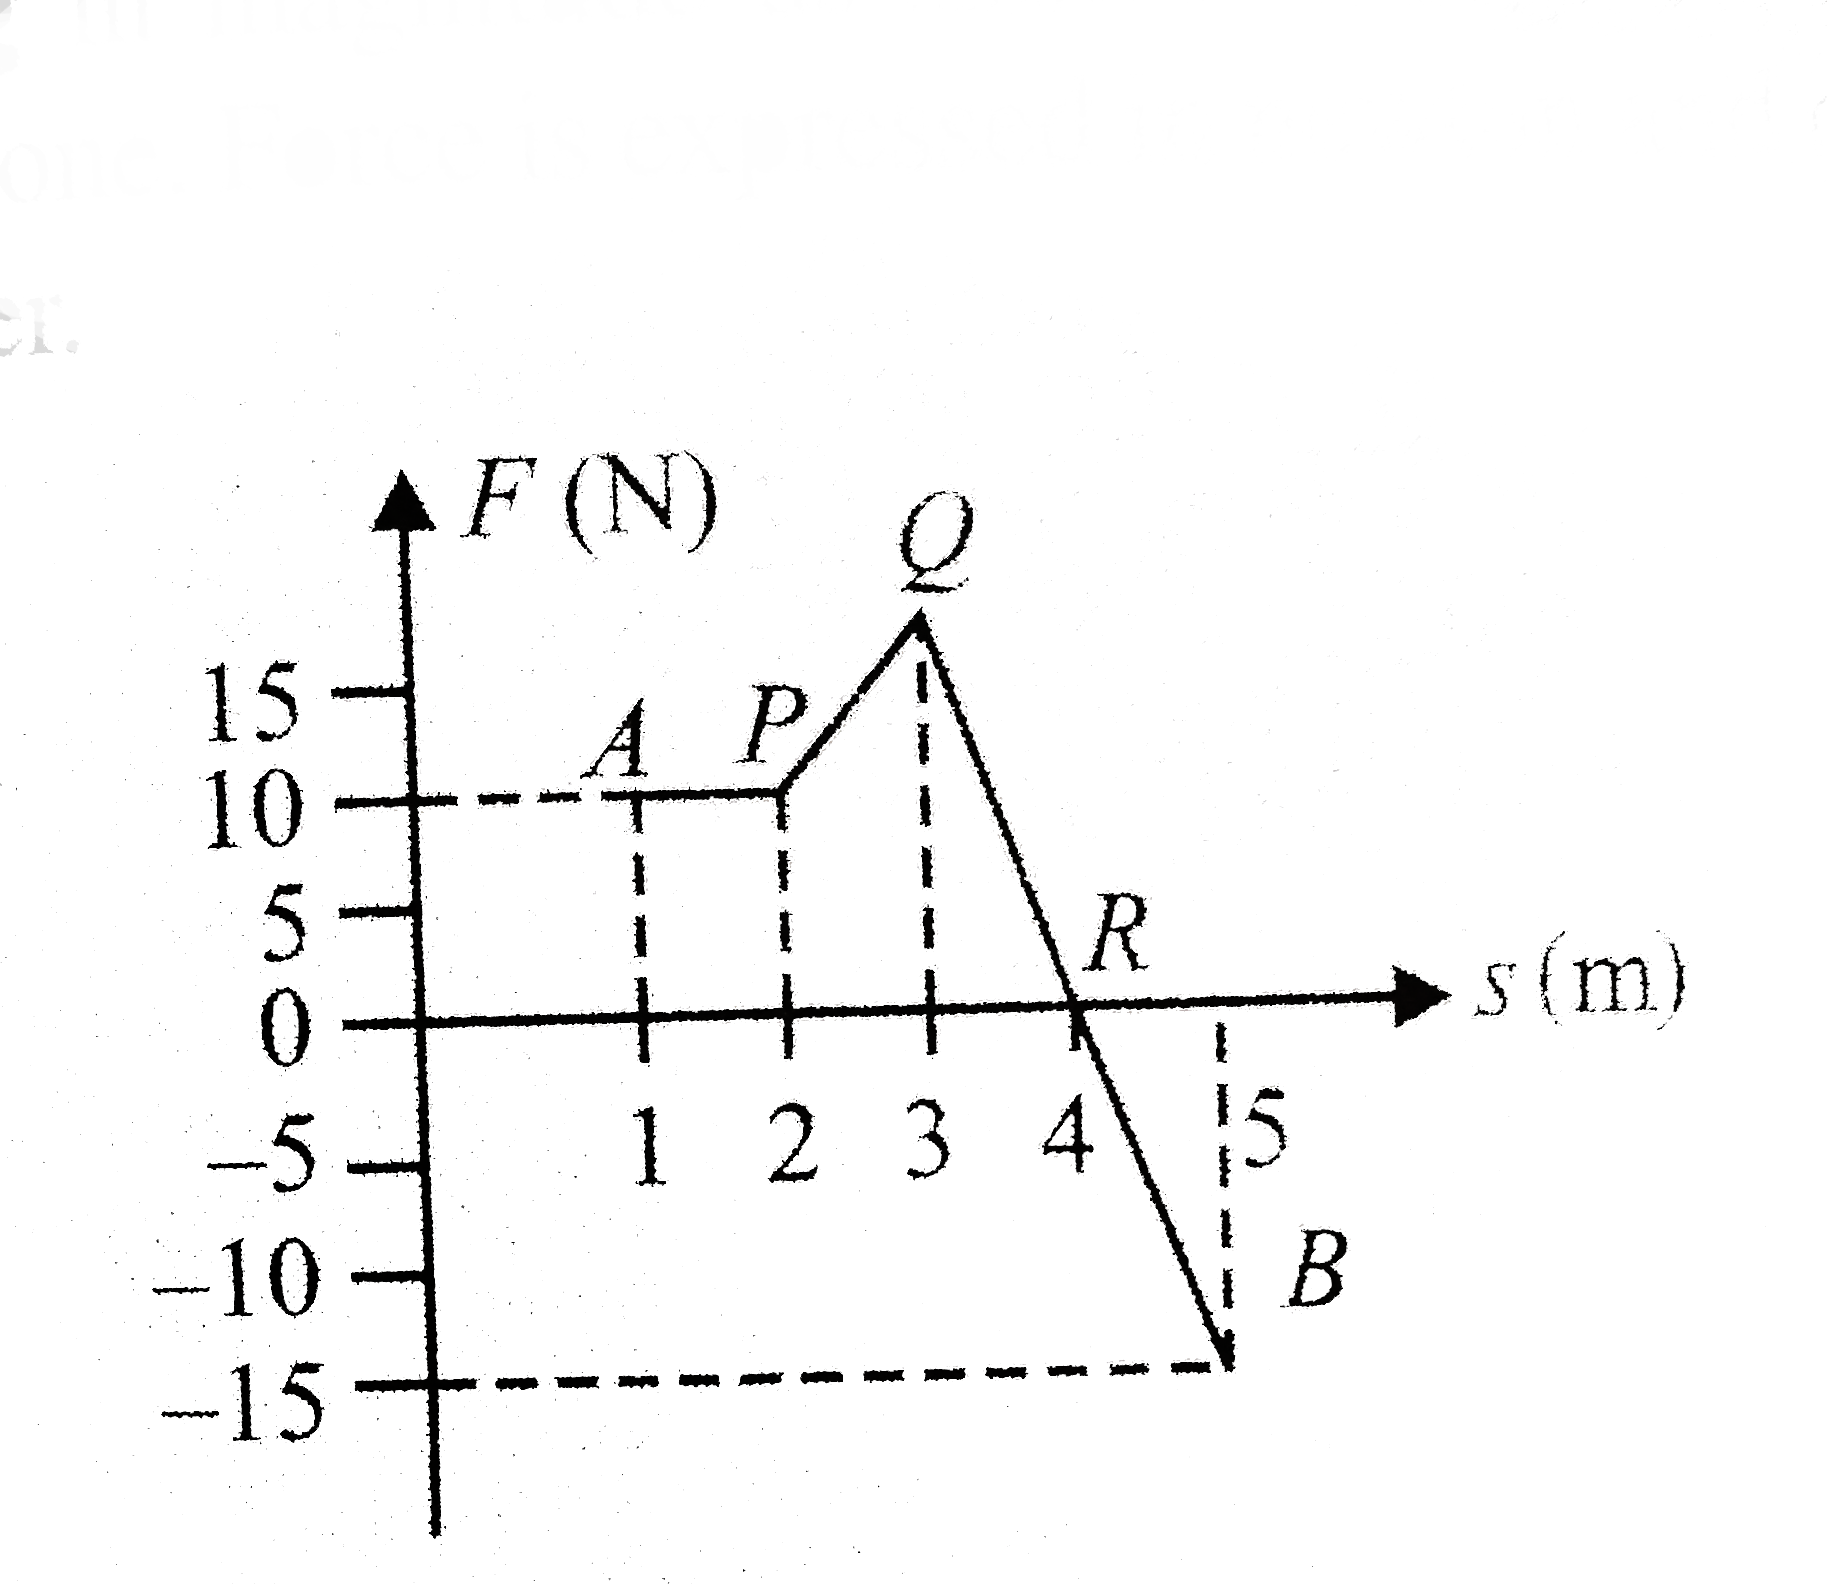 View Solution
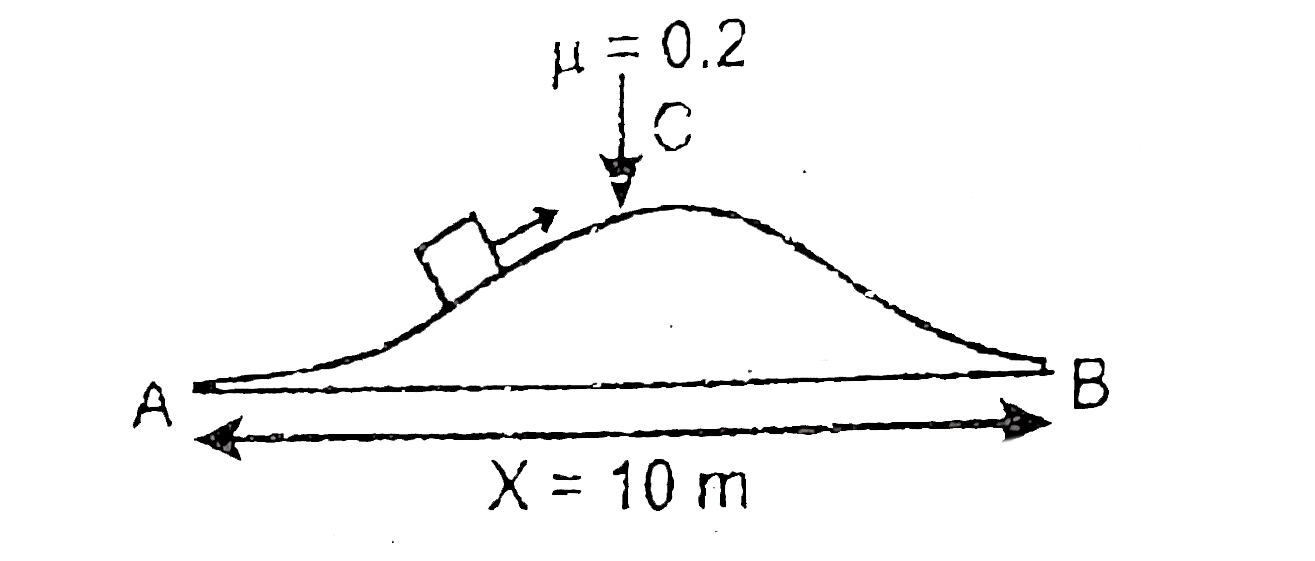
A block of mass 1 kg is pulled slowly along the curve path ACB by a tangential force as shown in figure. The magnitude of work done by the frictional force when the block moves from A to B isView Solutiongraph of an ideal gas is as shown in figure.
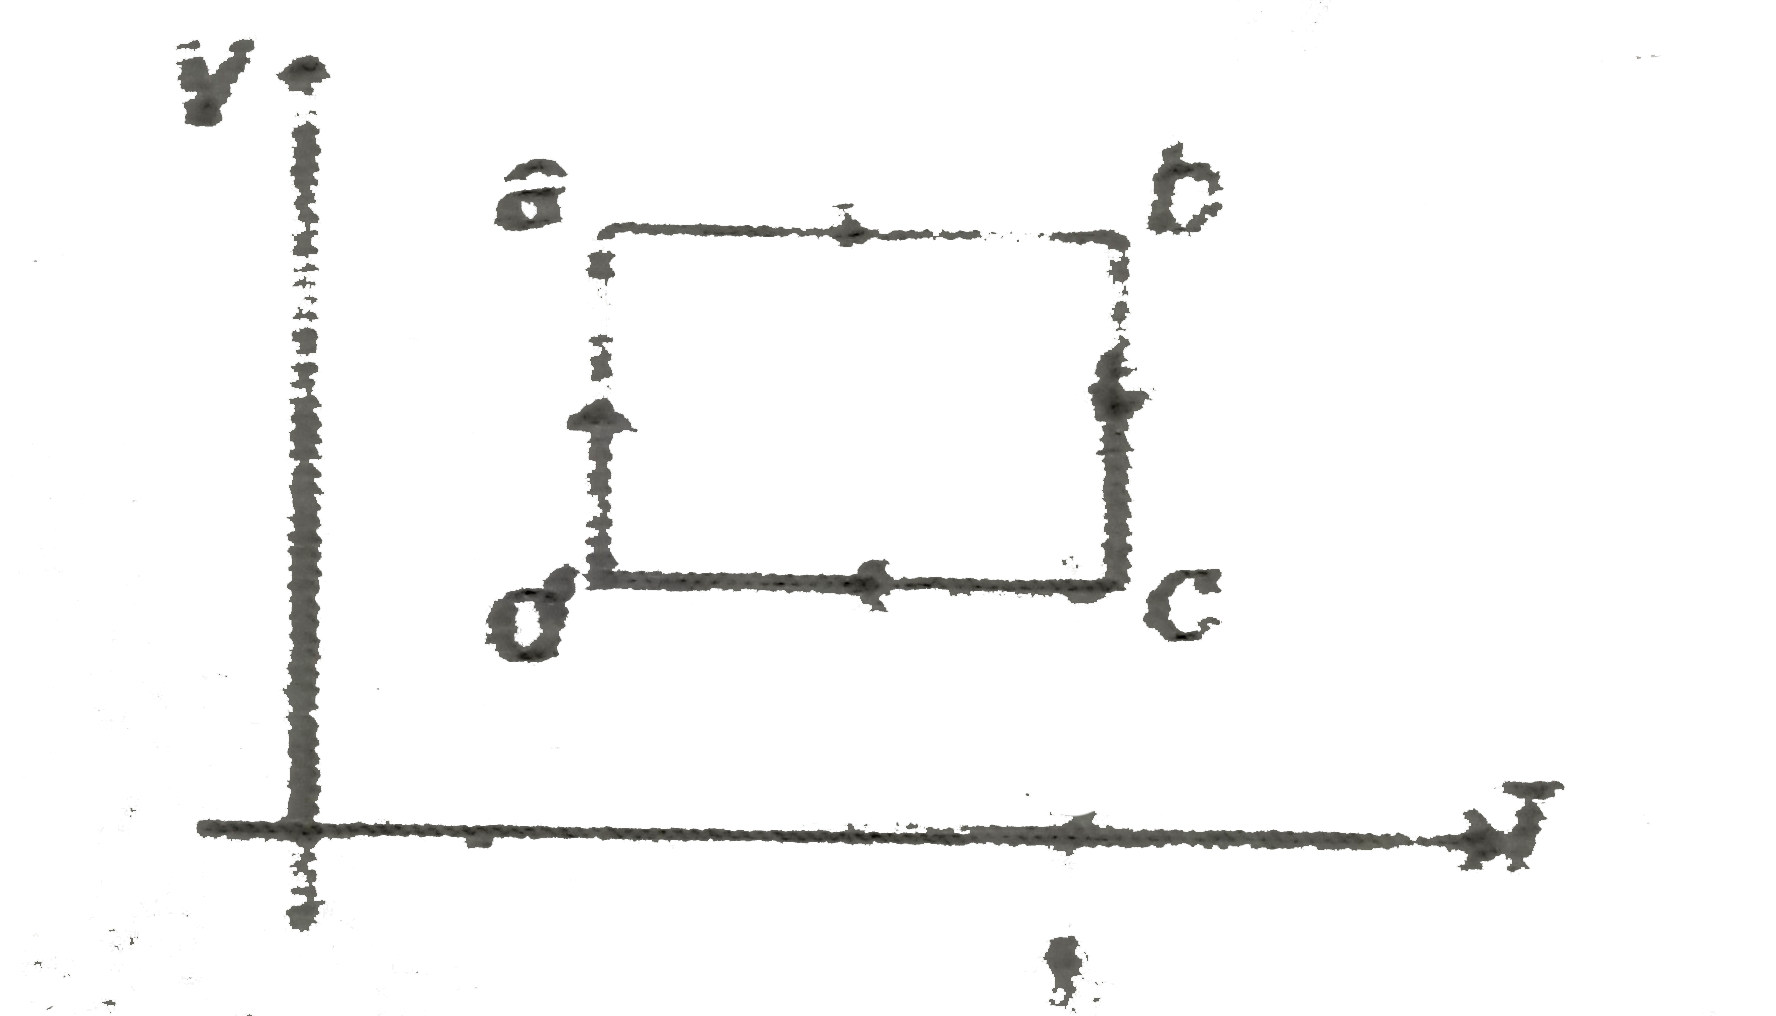
Work done by the gas in complete cyclic process about isView SolutionP−V diagram of an ideal gas is as shown in figure. Work done by the gas in process ABCD is
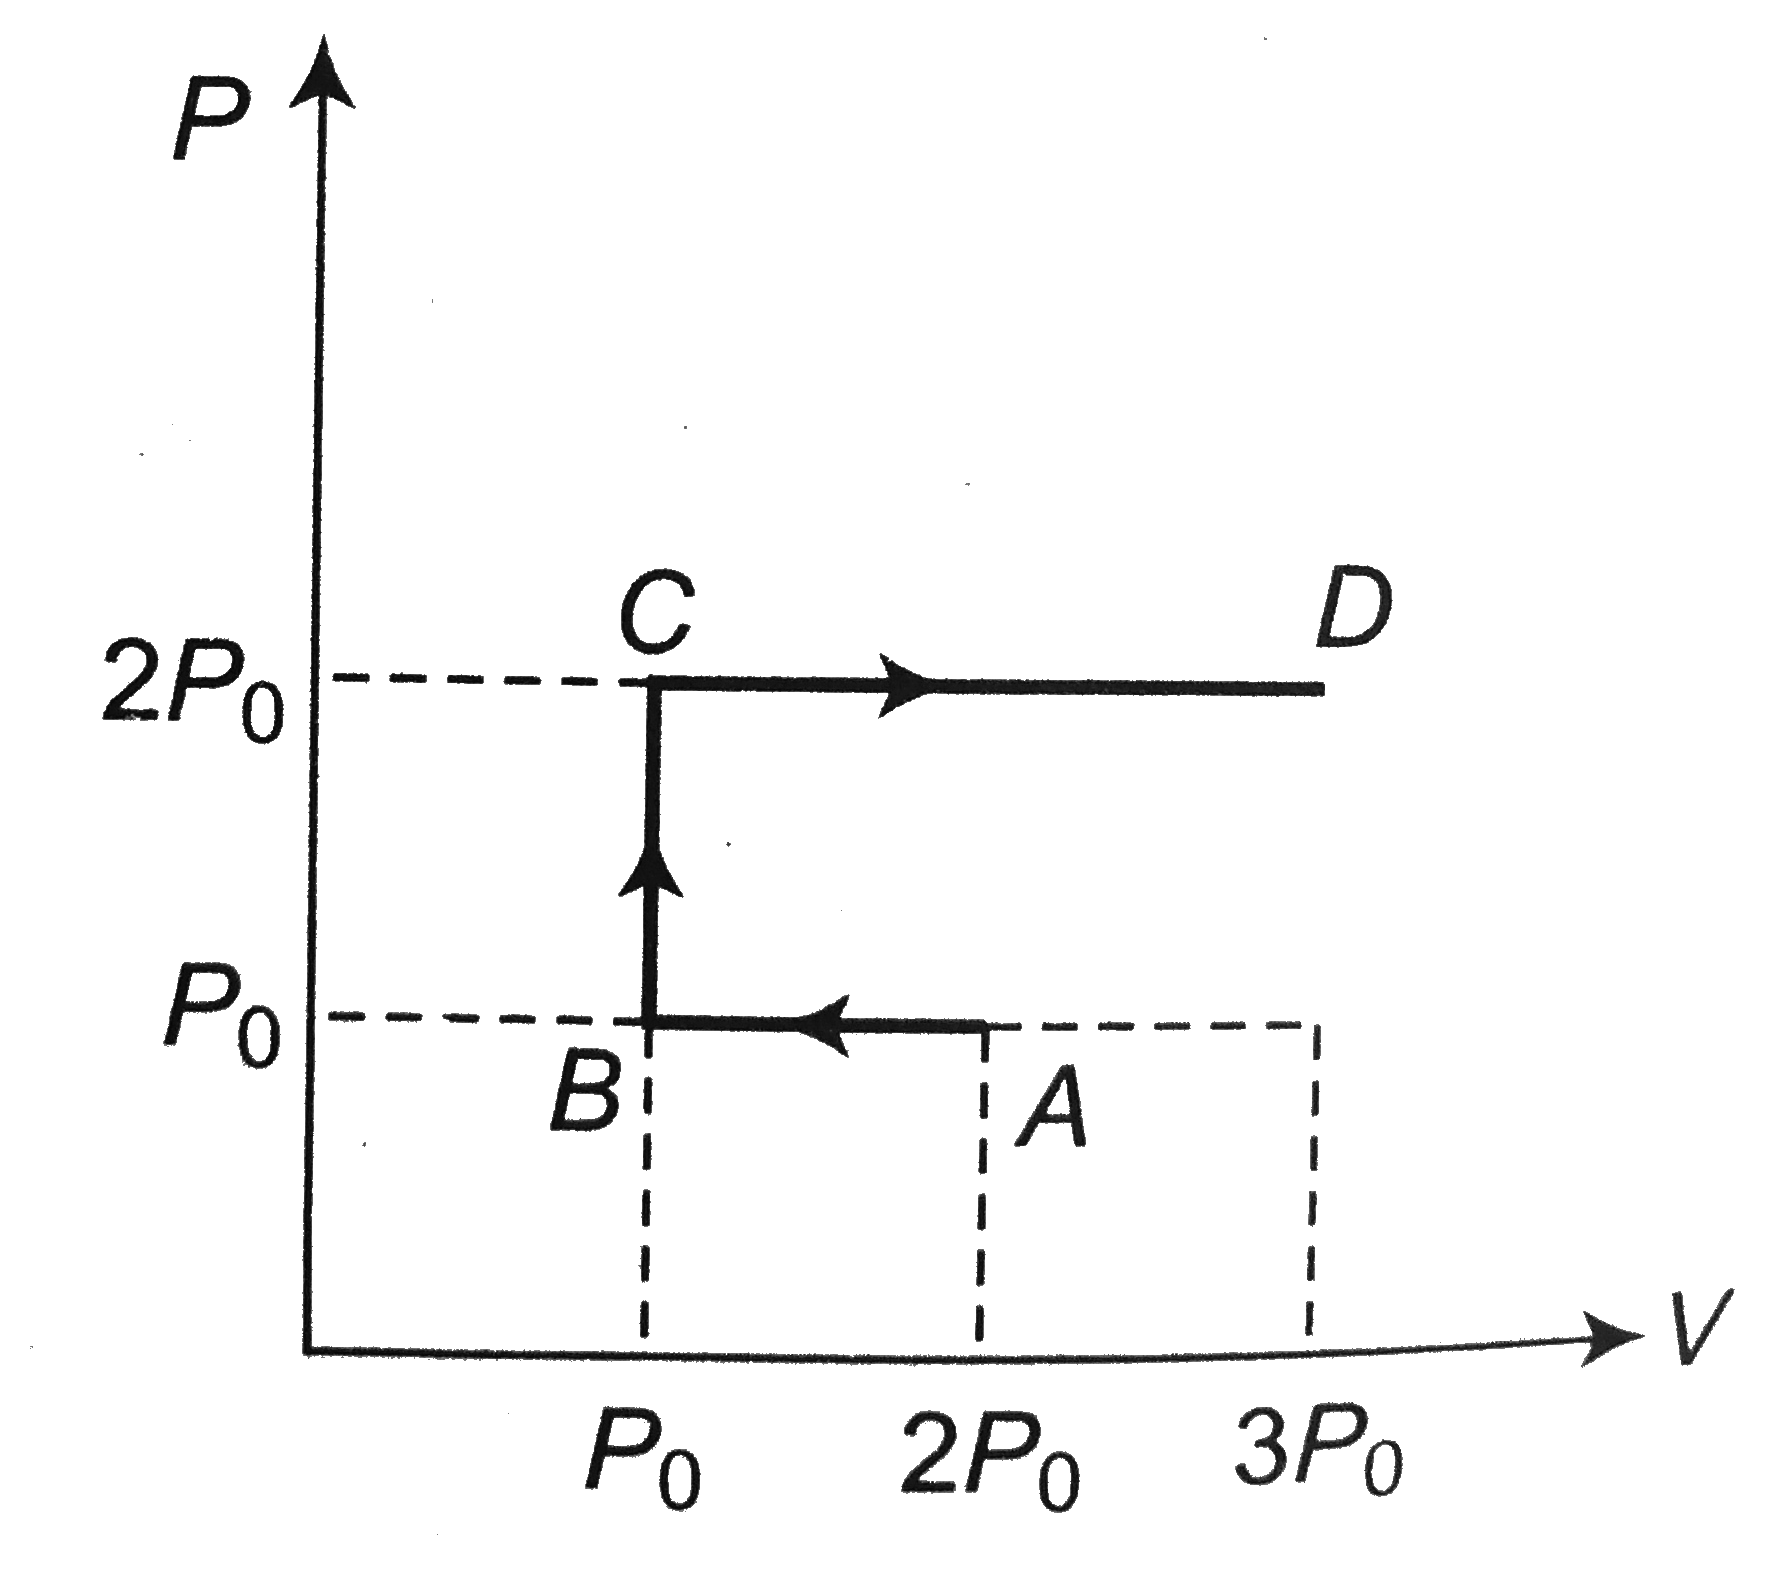 View Solution
The acceleration versus time graph of a particle is shown in the figure. The respective v−t graph of the particle is .
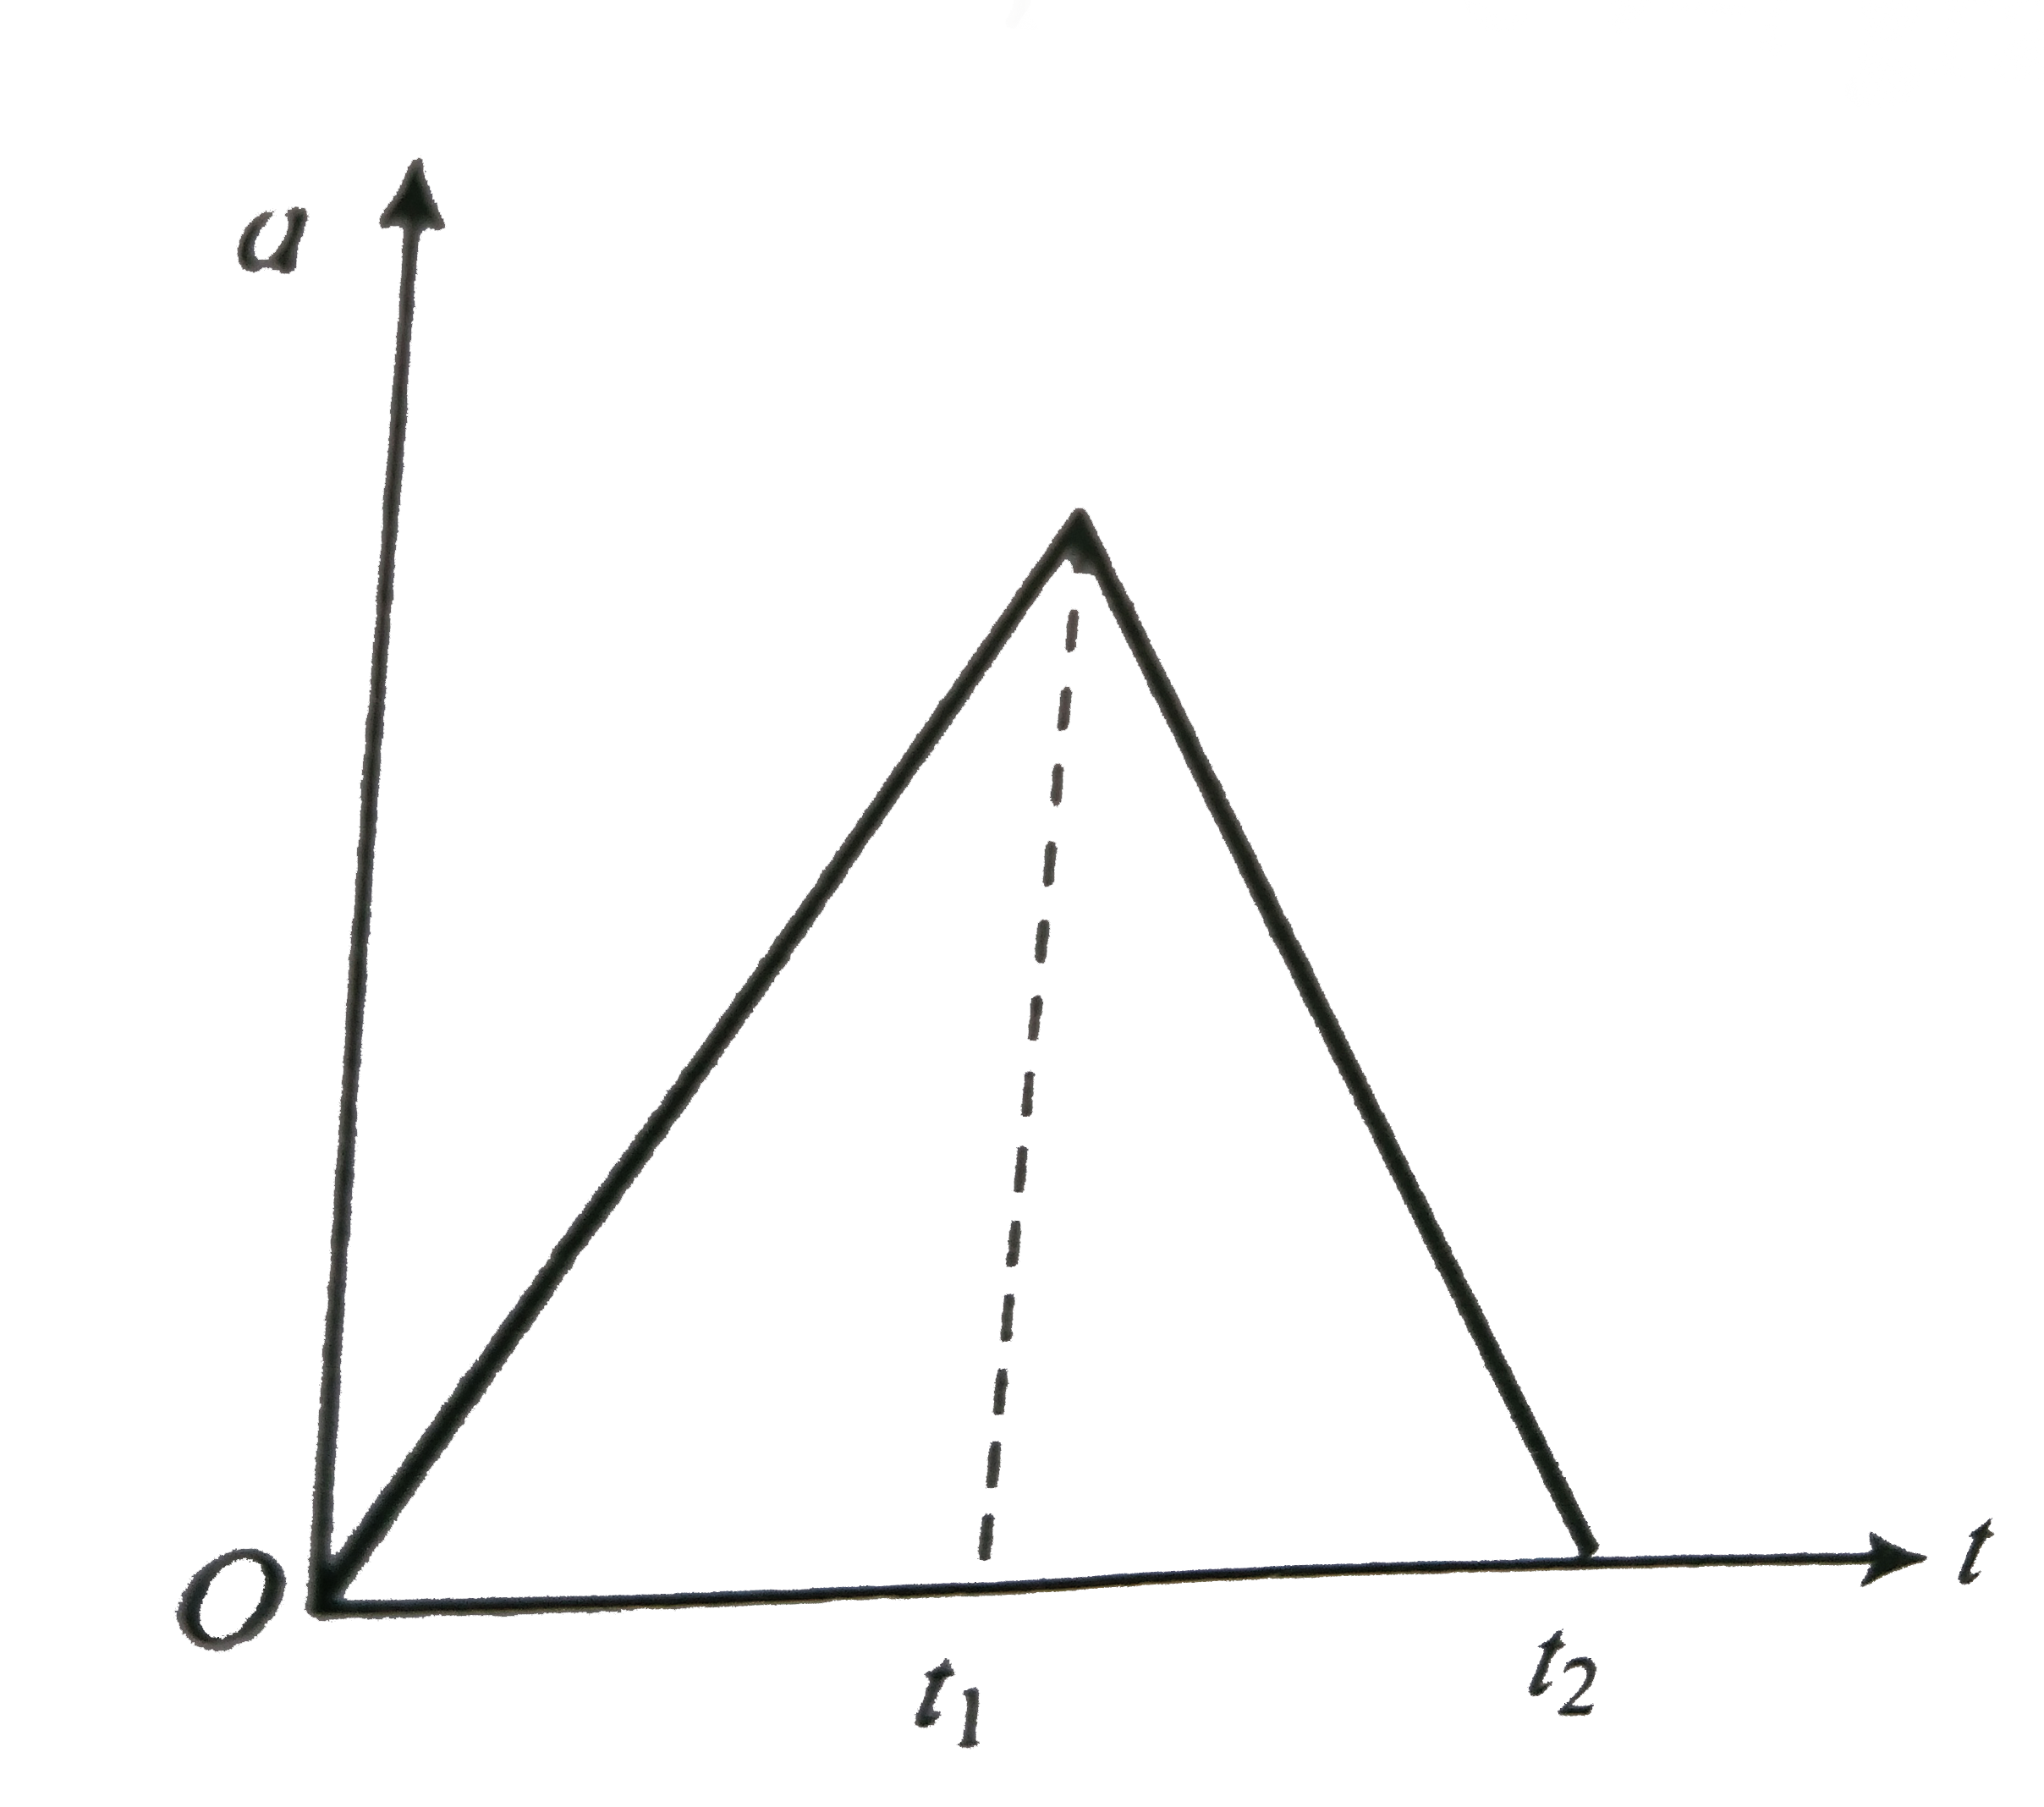 .View Solution

