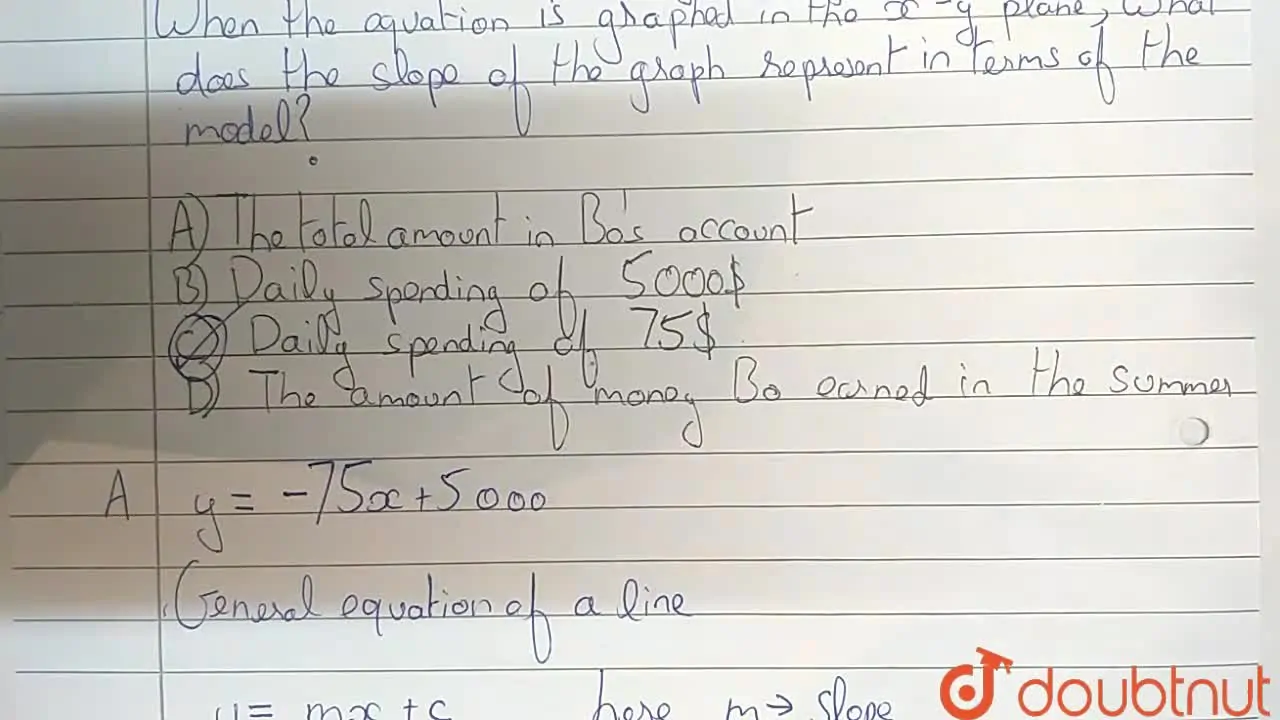
y=−75x+5,000
the equation above models the amount of money y, in dollars, remaining in Bo's bank account x days after the start of the fall semester. The amount of money in Bo's bank account is based on the money he earned over the summer and how much he spends per day during the fall semester. When the equation is graphed in the xy-plane , what does the slope of the graph represent in terms of the model?
The total amount in Bo's bank account
Daily spending of $5,000
Daily spending of $75
The amount of money Bo earned over the summer
The correct Answer is:C
Step by step video, text & image solution for y=-75x+5,000 the equation above models the amount of money y, in dollars, remaining in Bo's bank account x days after the start of the fall semester. The amount of money in Bo's bank account is based on the money he earned over the summer and how much he spends per day during the fall semester. When the equation is graphed in the xy-plane , what does the slope of the graph represent in terms of the model? by Maths experts to help you in doubts & scoring excellent marks in Class 12 exams.
Related Playlists
Similar Questions
y = 19.99 + 1.50x
The equation above models the total cost y, in dollars, that a company charges a customer to rent a truck for one day and drive the truck x miles. The total cost consists of a flat fee plus a charge per mile driven. When the equation is graphed in the xy-plane, what does the y-intercept of the graph represent in terms of the model?View SolutionWhich of the following is the graph of the equation y = 2x − 5 in the xy-plane?
View Solutiony=−x2+120x−2,000
the equation above gives the profit in dollars, y, a coat manufacturer earns day where x is the number of coats sold. What is the maximum profit he earns in dollars?View SolutionAn amount of money invested trebled in 6 years . Find the rate of interest earned .
View SolutionKrishna deposited Rs 2,000 per month in a recurring bank account for 2 years at the rate of 11% per annum interest. The amount Krishna will get at the time of maturity is:
View Solutionx + y = 75
The equation above relates the number of minutes, x, Maria spends running each day and the number of minutes, y, she spends biking each day. In the equation, what does the number 75 represent?View SolutionThe amount of money in the account every year, when Rs 10000 is deposited at compound interest at 8 % per annum.
View Solution
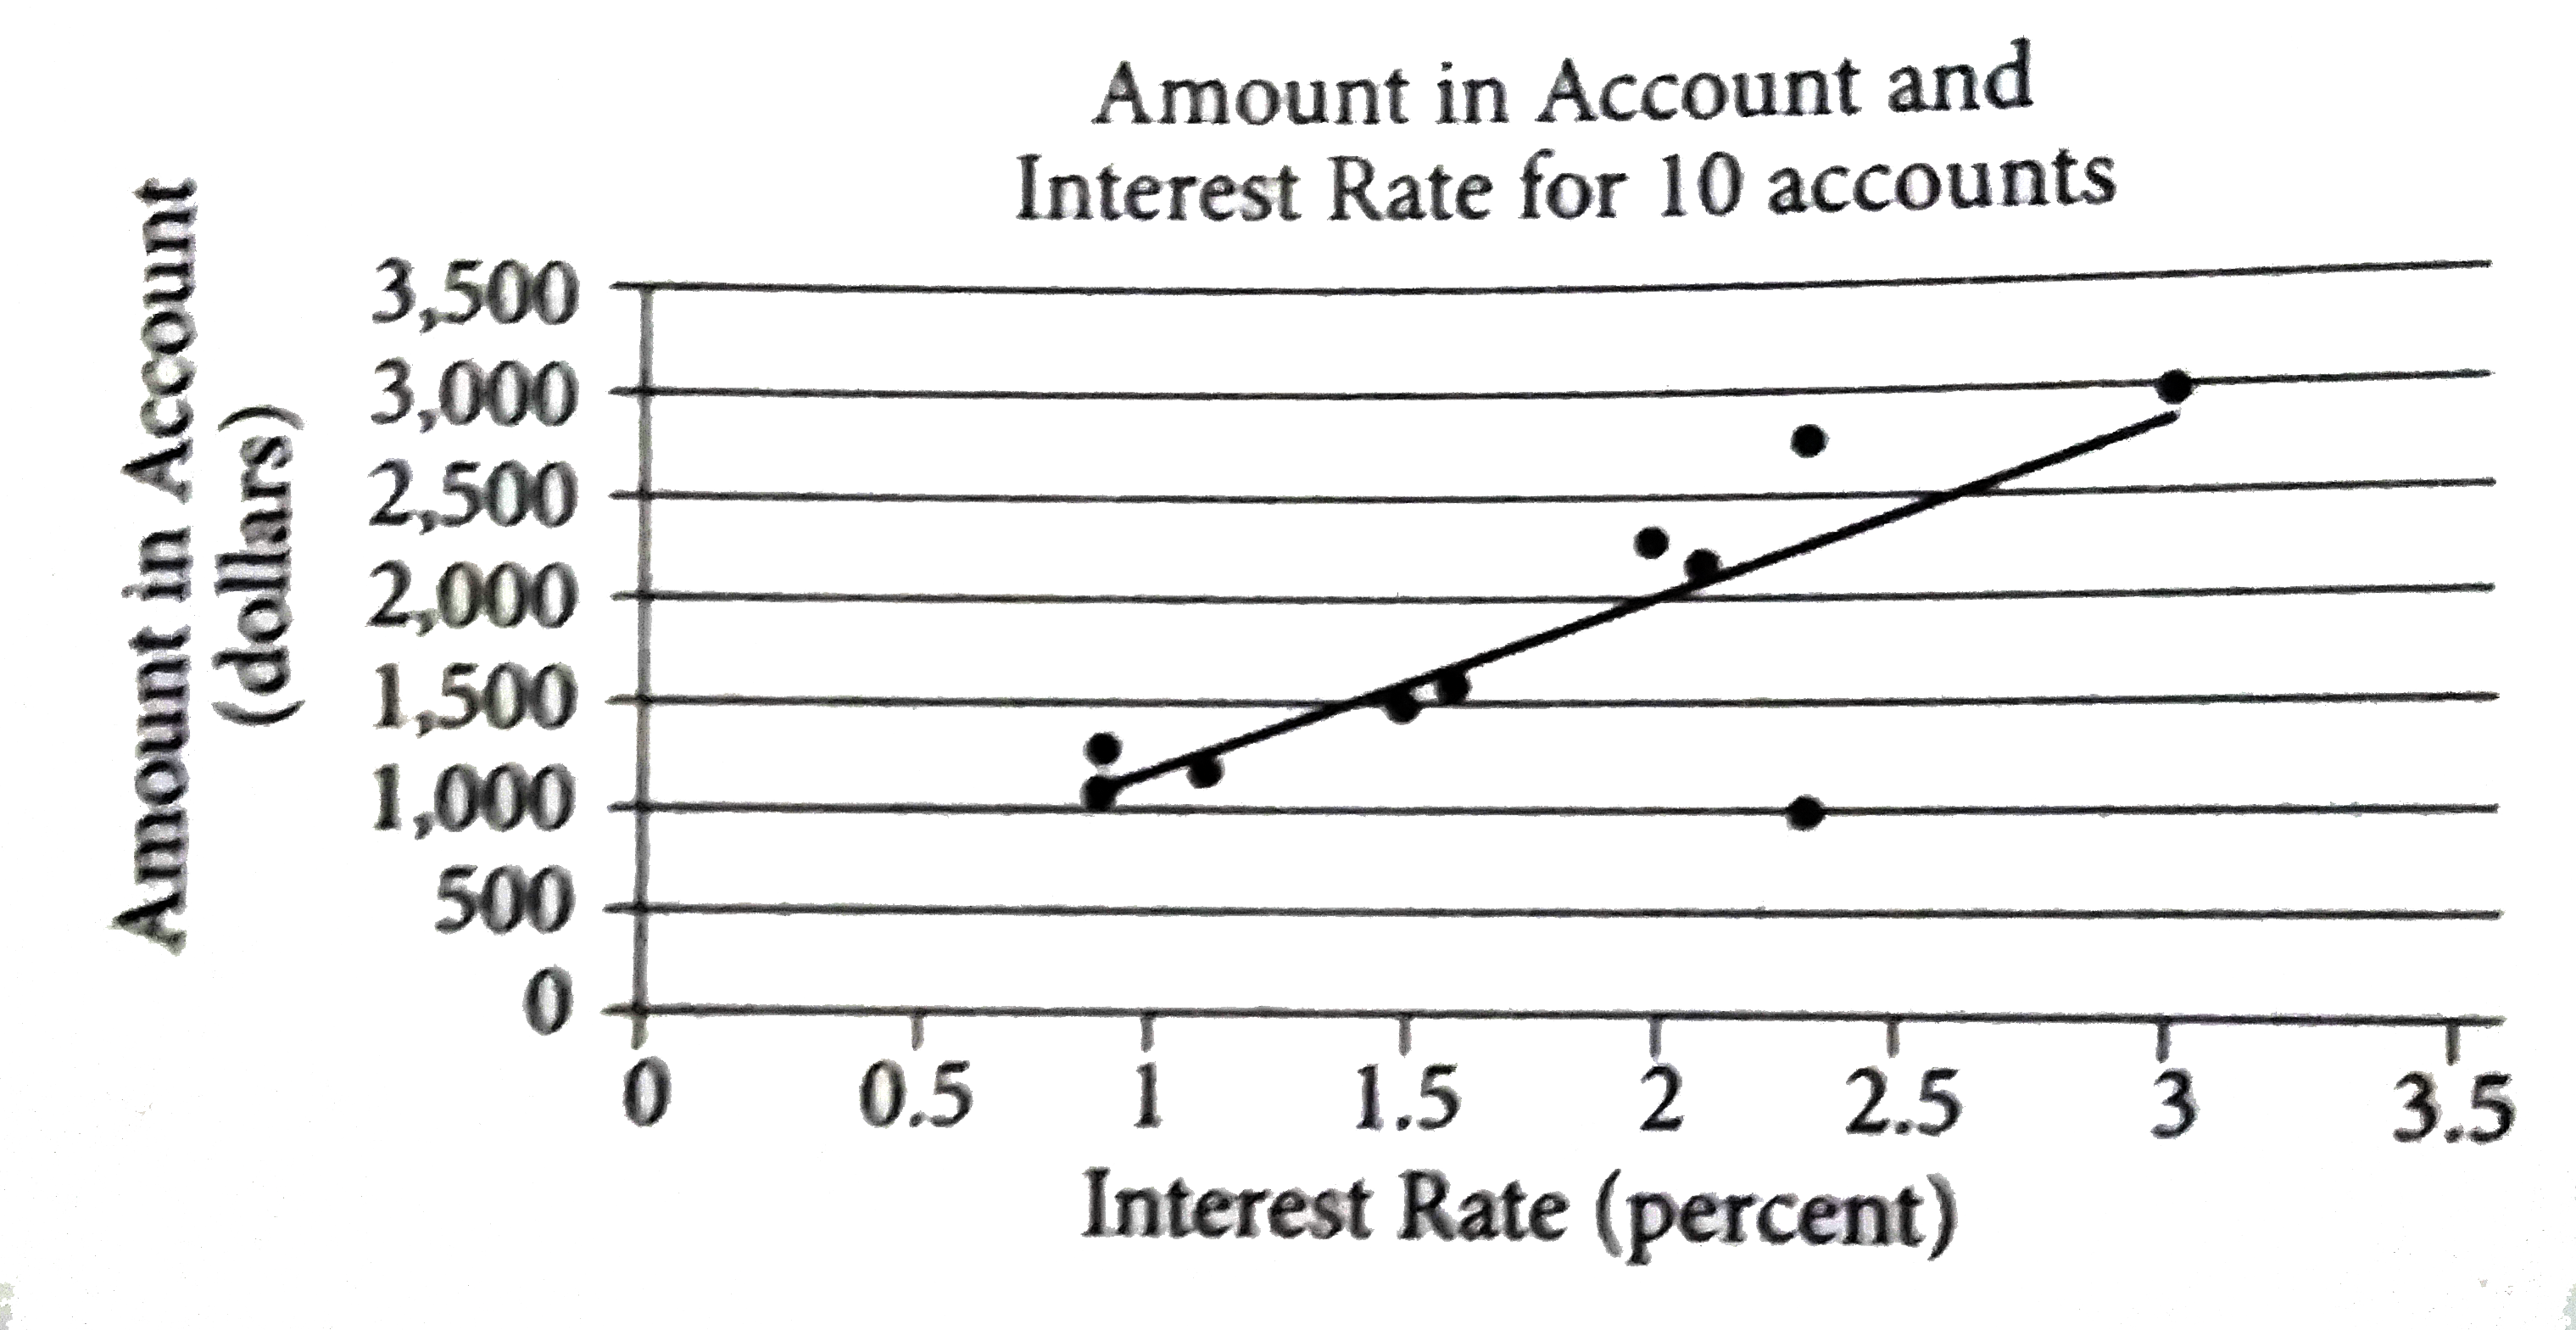
The scatterplot above shows data for ten accounts opened by a company , along with the line of best fit. For the account that contains the least amount of money, which of the following is closest to the difference of the actual amount and the amount predicted by the line of best fit?View Solution
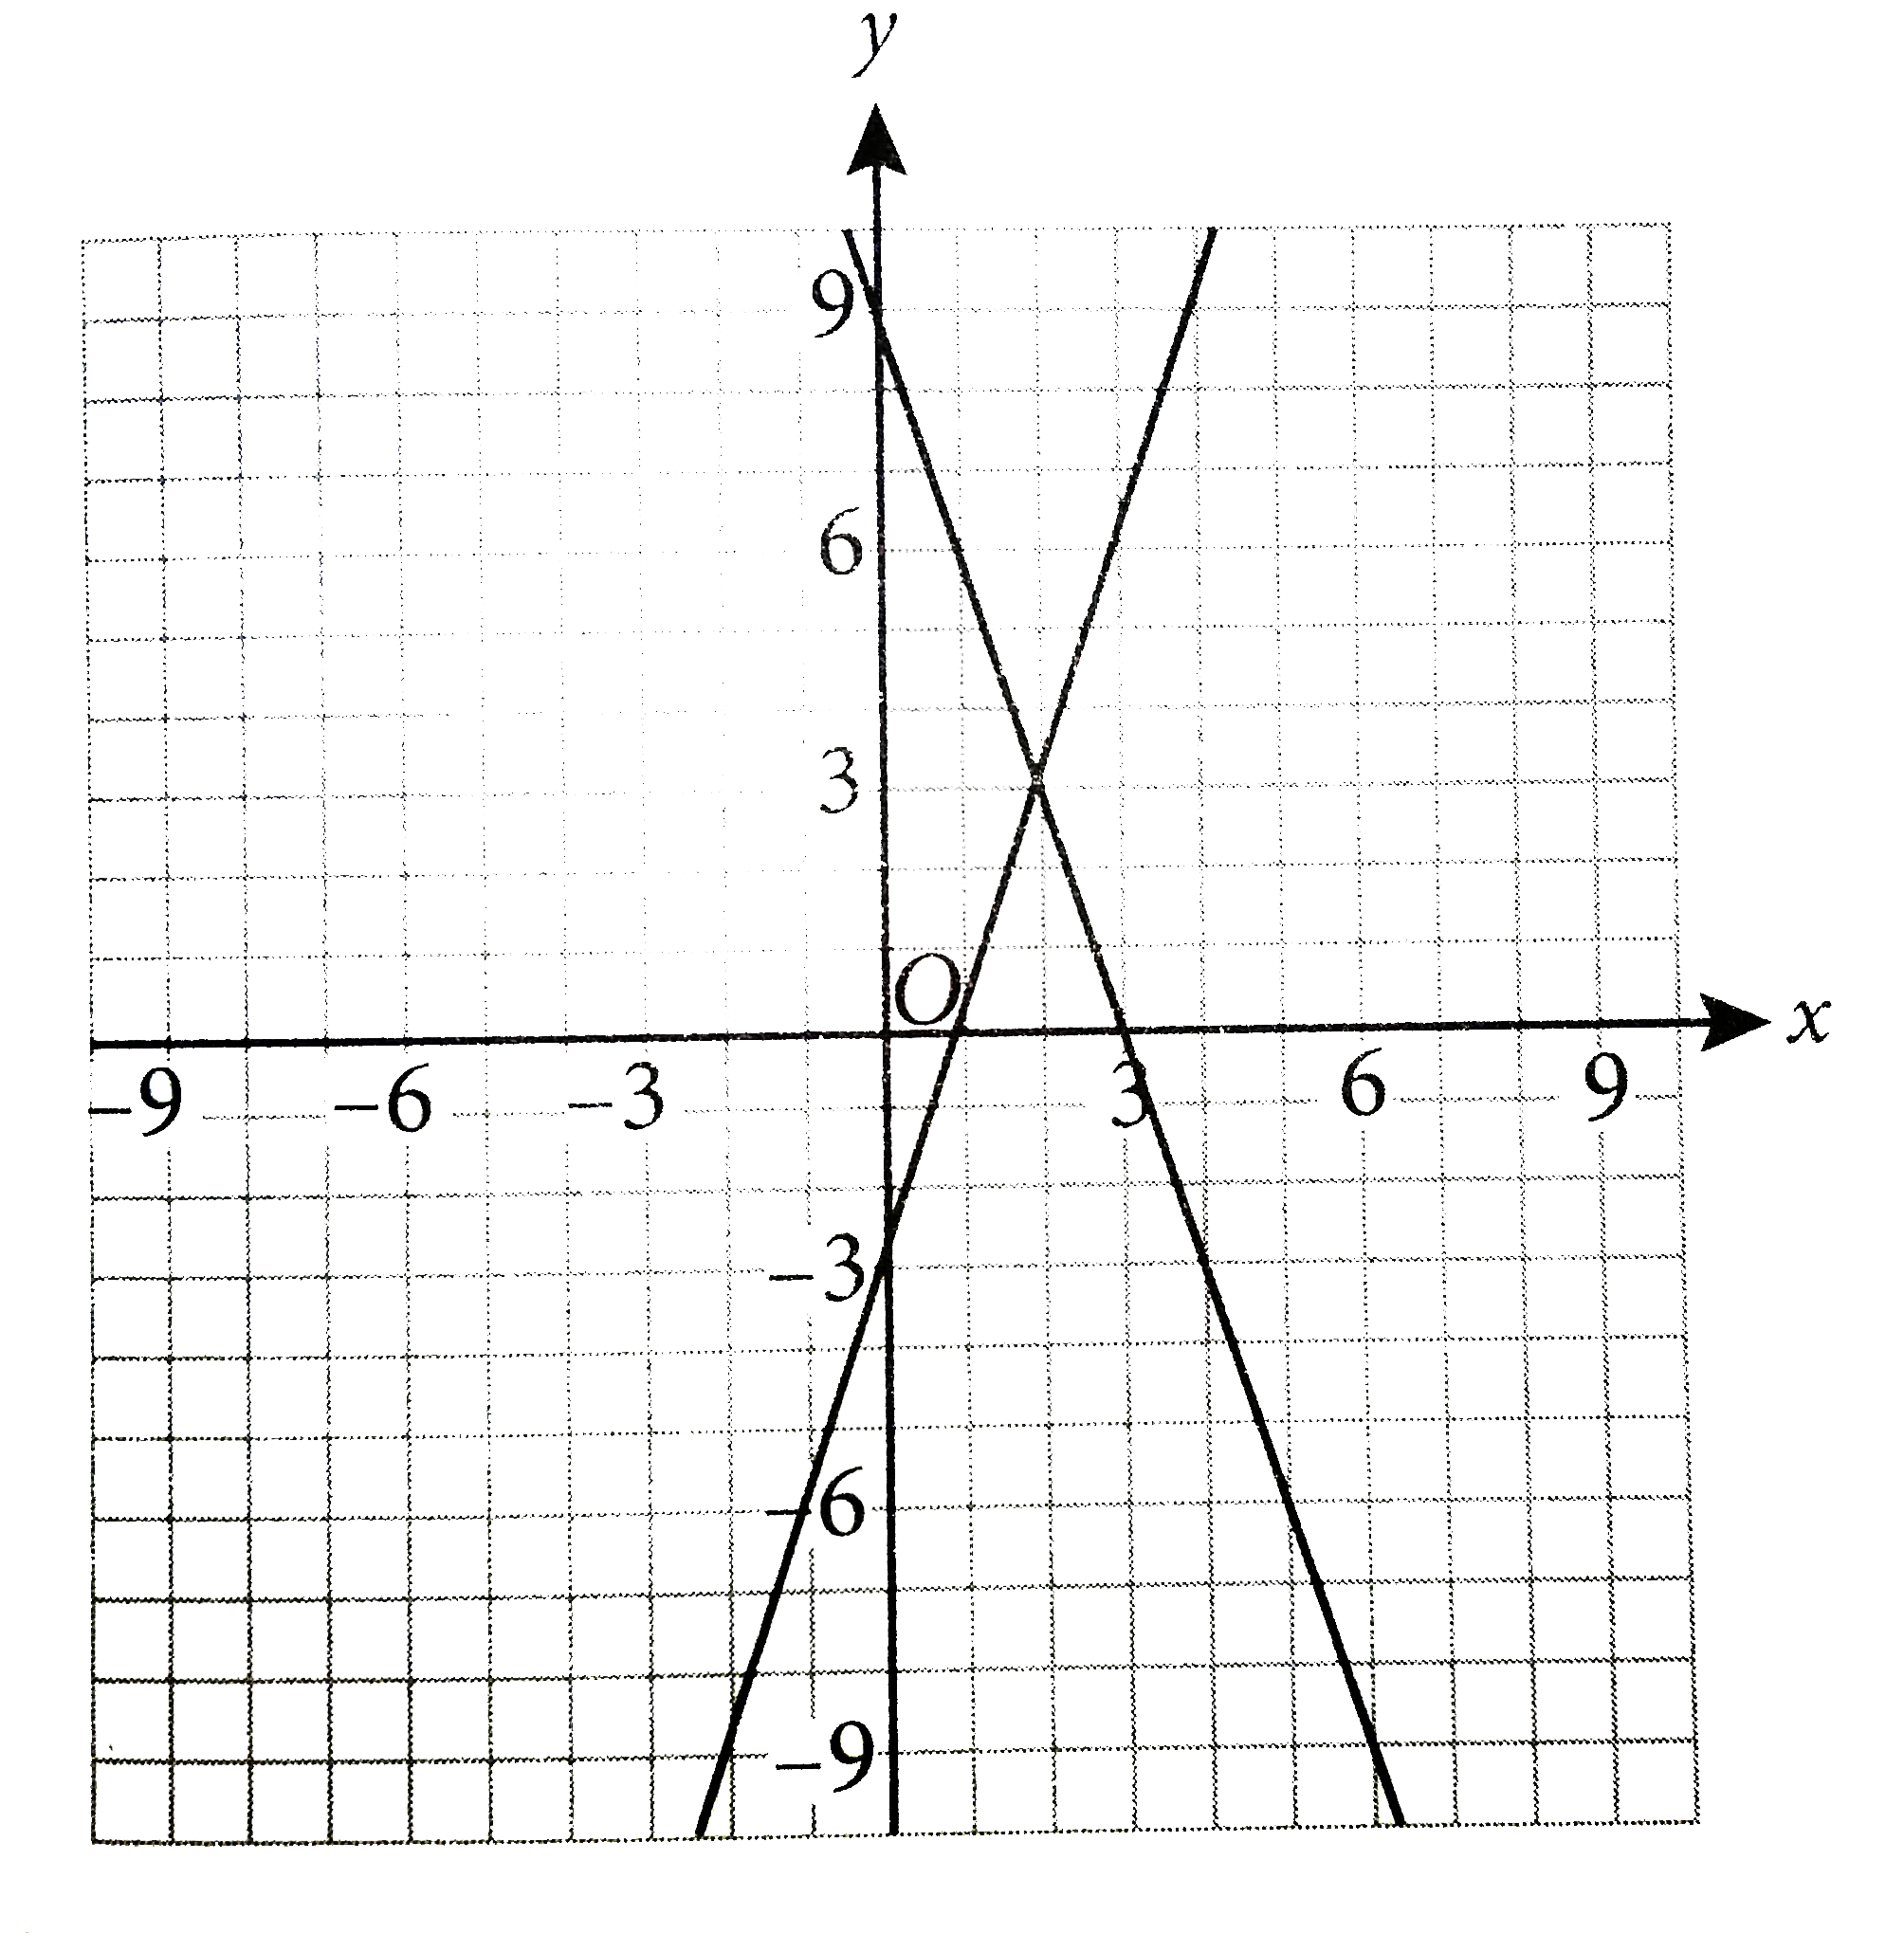
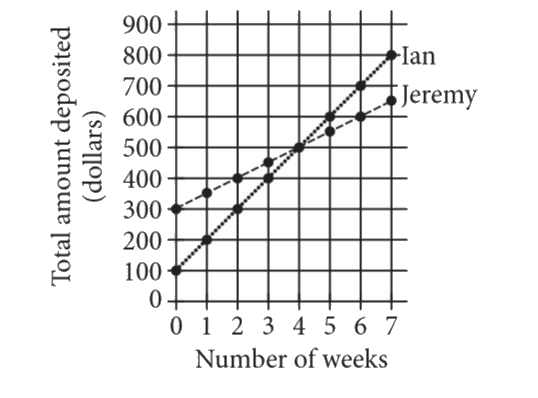
The lines graphed in the xy-plane above represent a system of two linear equations. What is the solution (x,y) to the system?View SolutionThe two graphs above show the total amounts of money that Ian and Jeremy each have deposited into their savings accounts for the first seven weeks after opening their accounts. After they made their initial deposits, how much more did Ian deposit each week than Jeremy?
 View Solution


