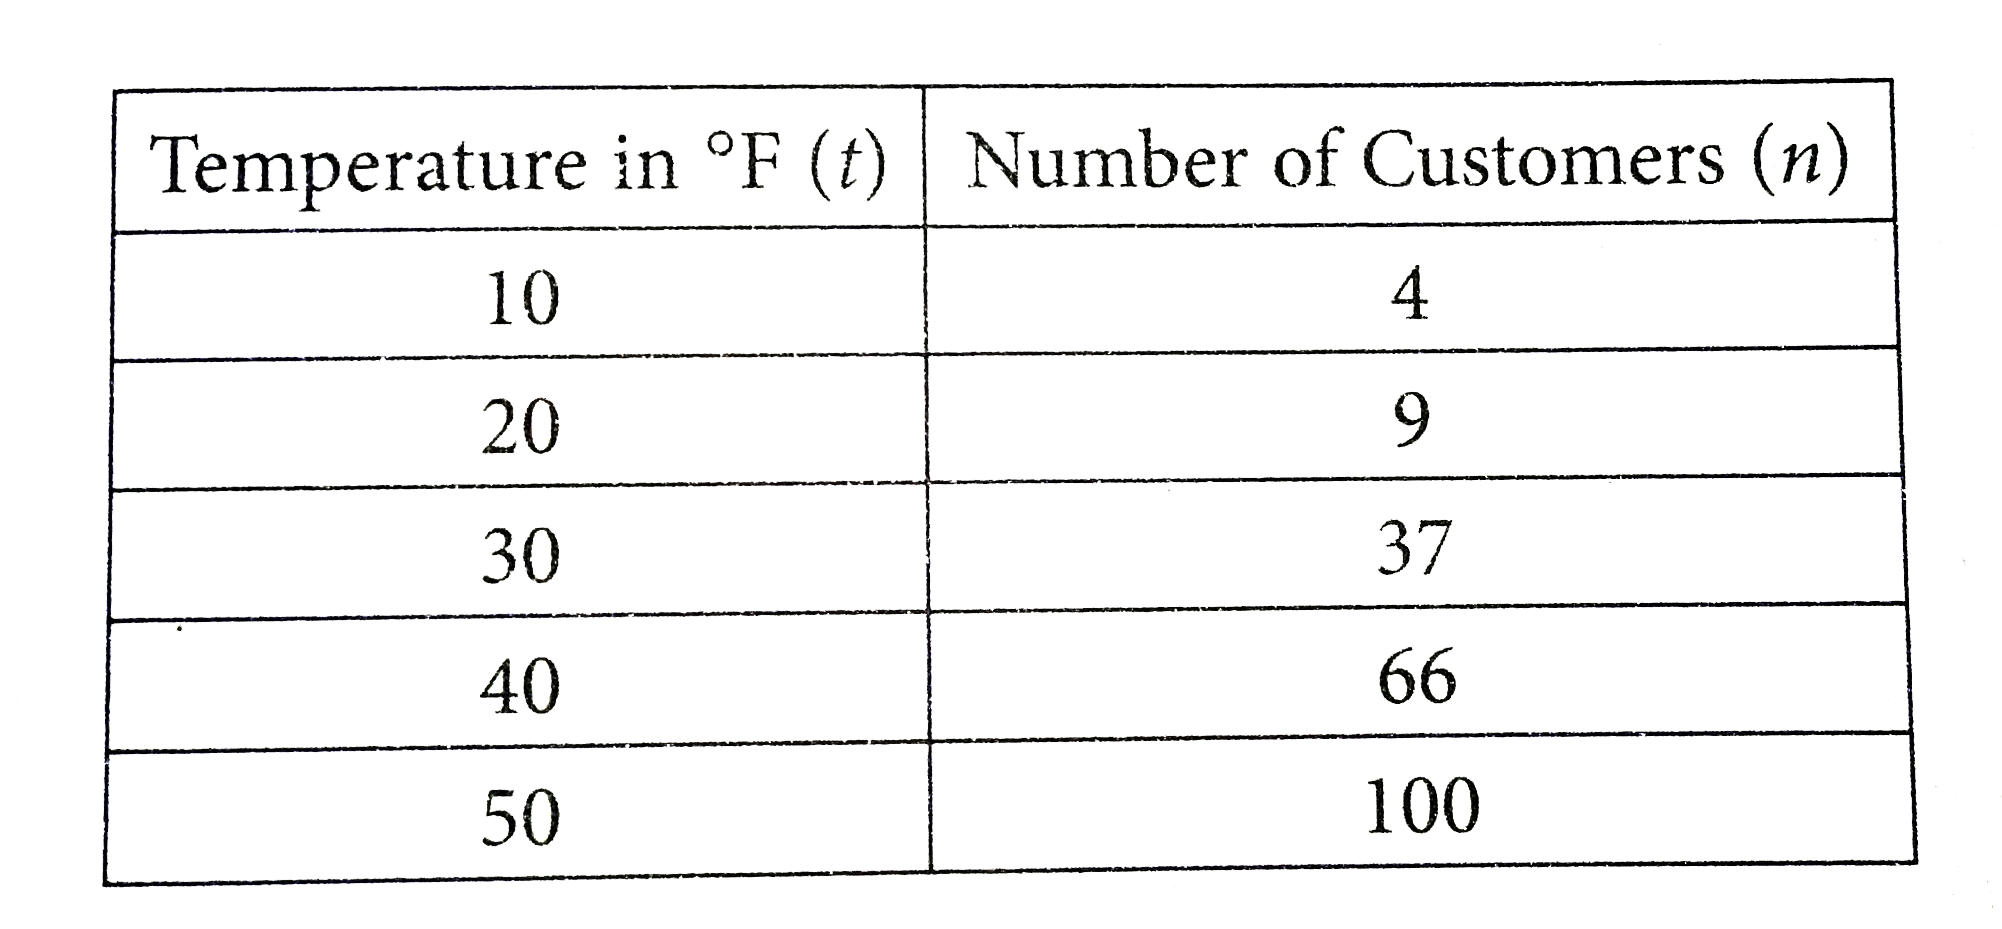
A coffee shop noticed that the outside temperature affected the number of customers who came to the shop that day, as shown in the table above. Which of the following graphs best represents the relationship between the outside temperature t, and the number of customers,n, as indicated by the table?
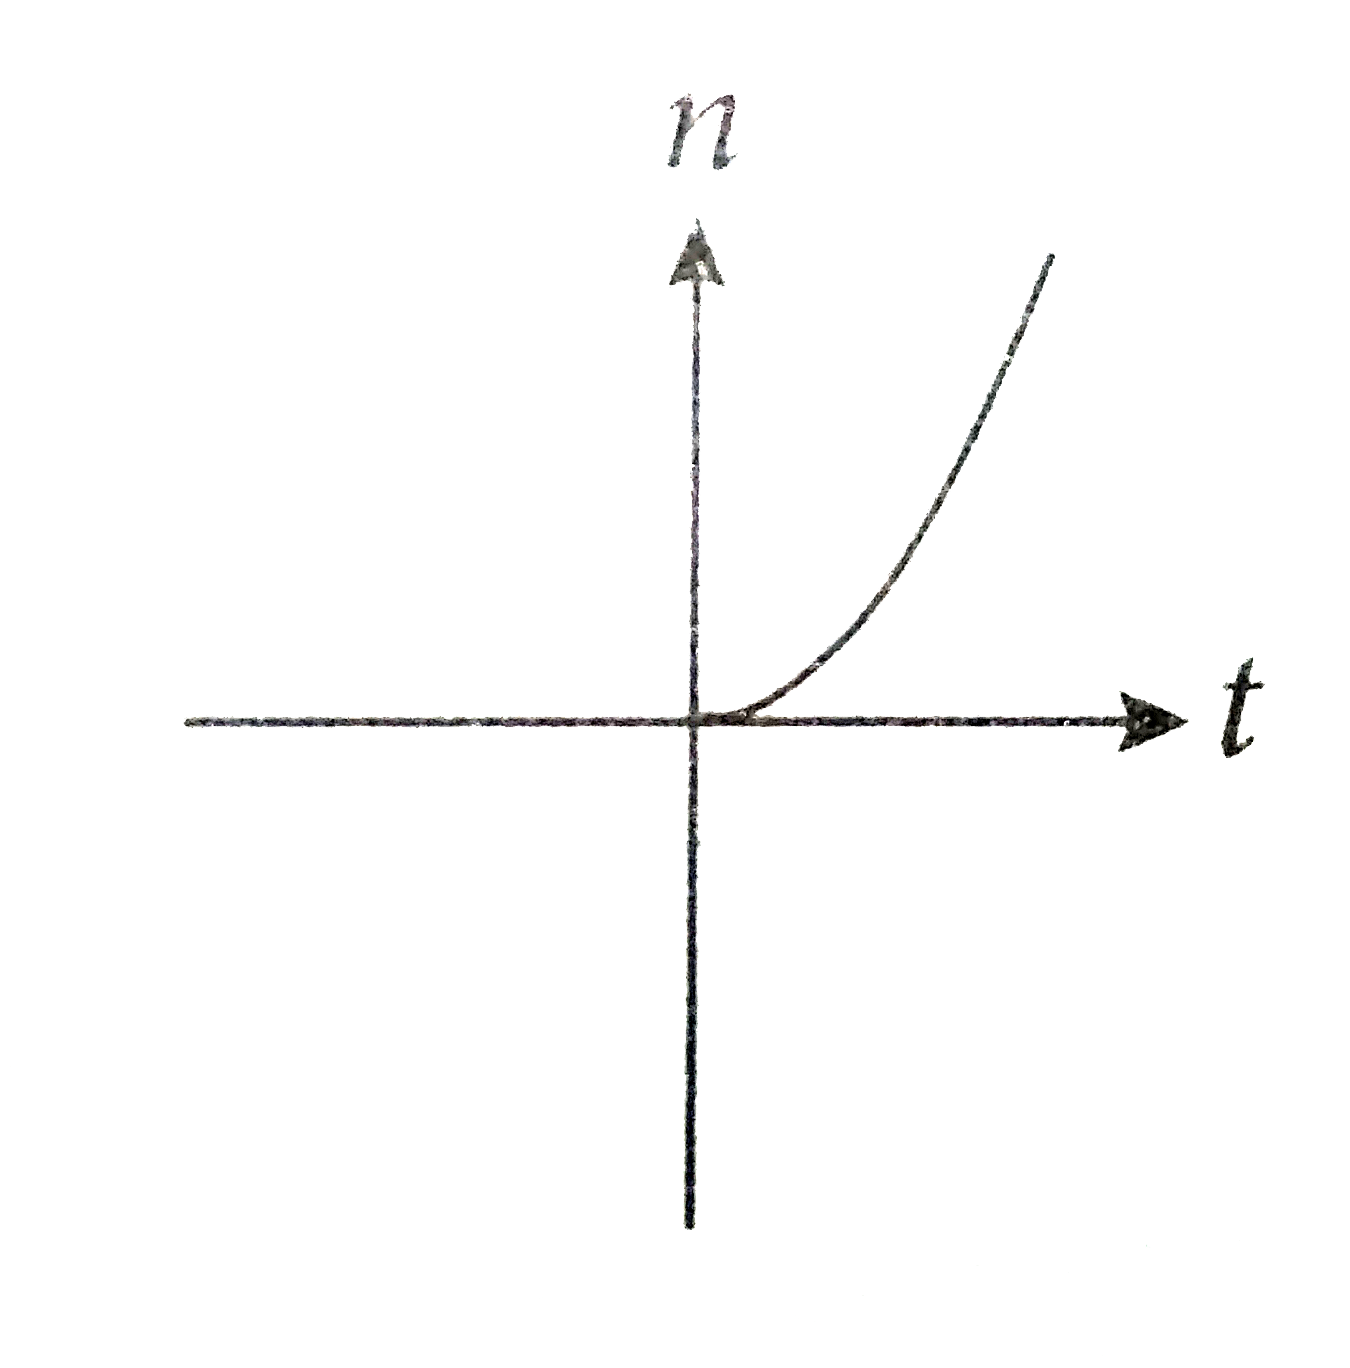
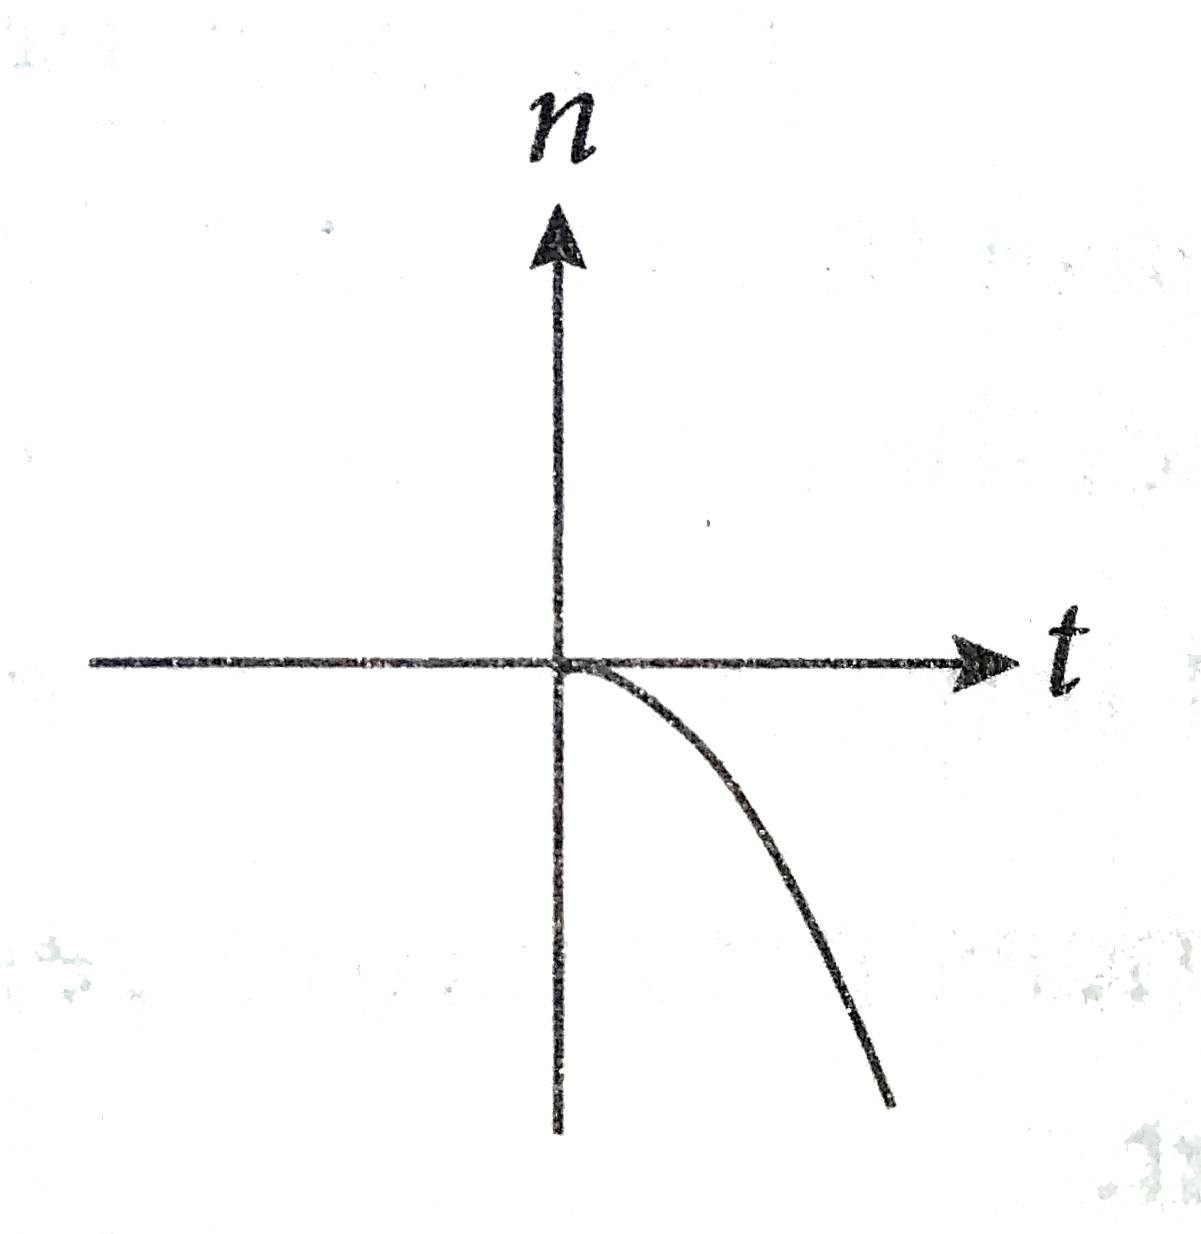
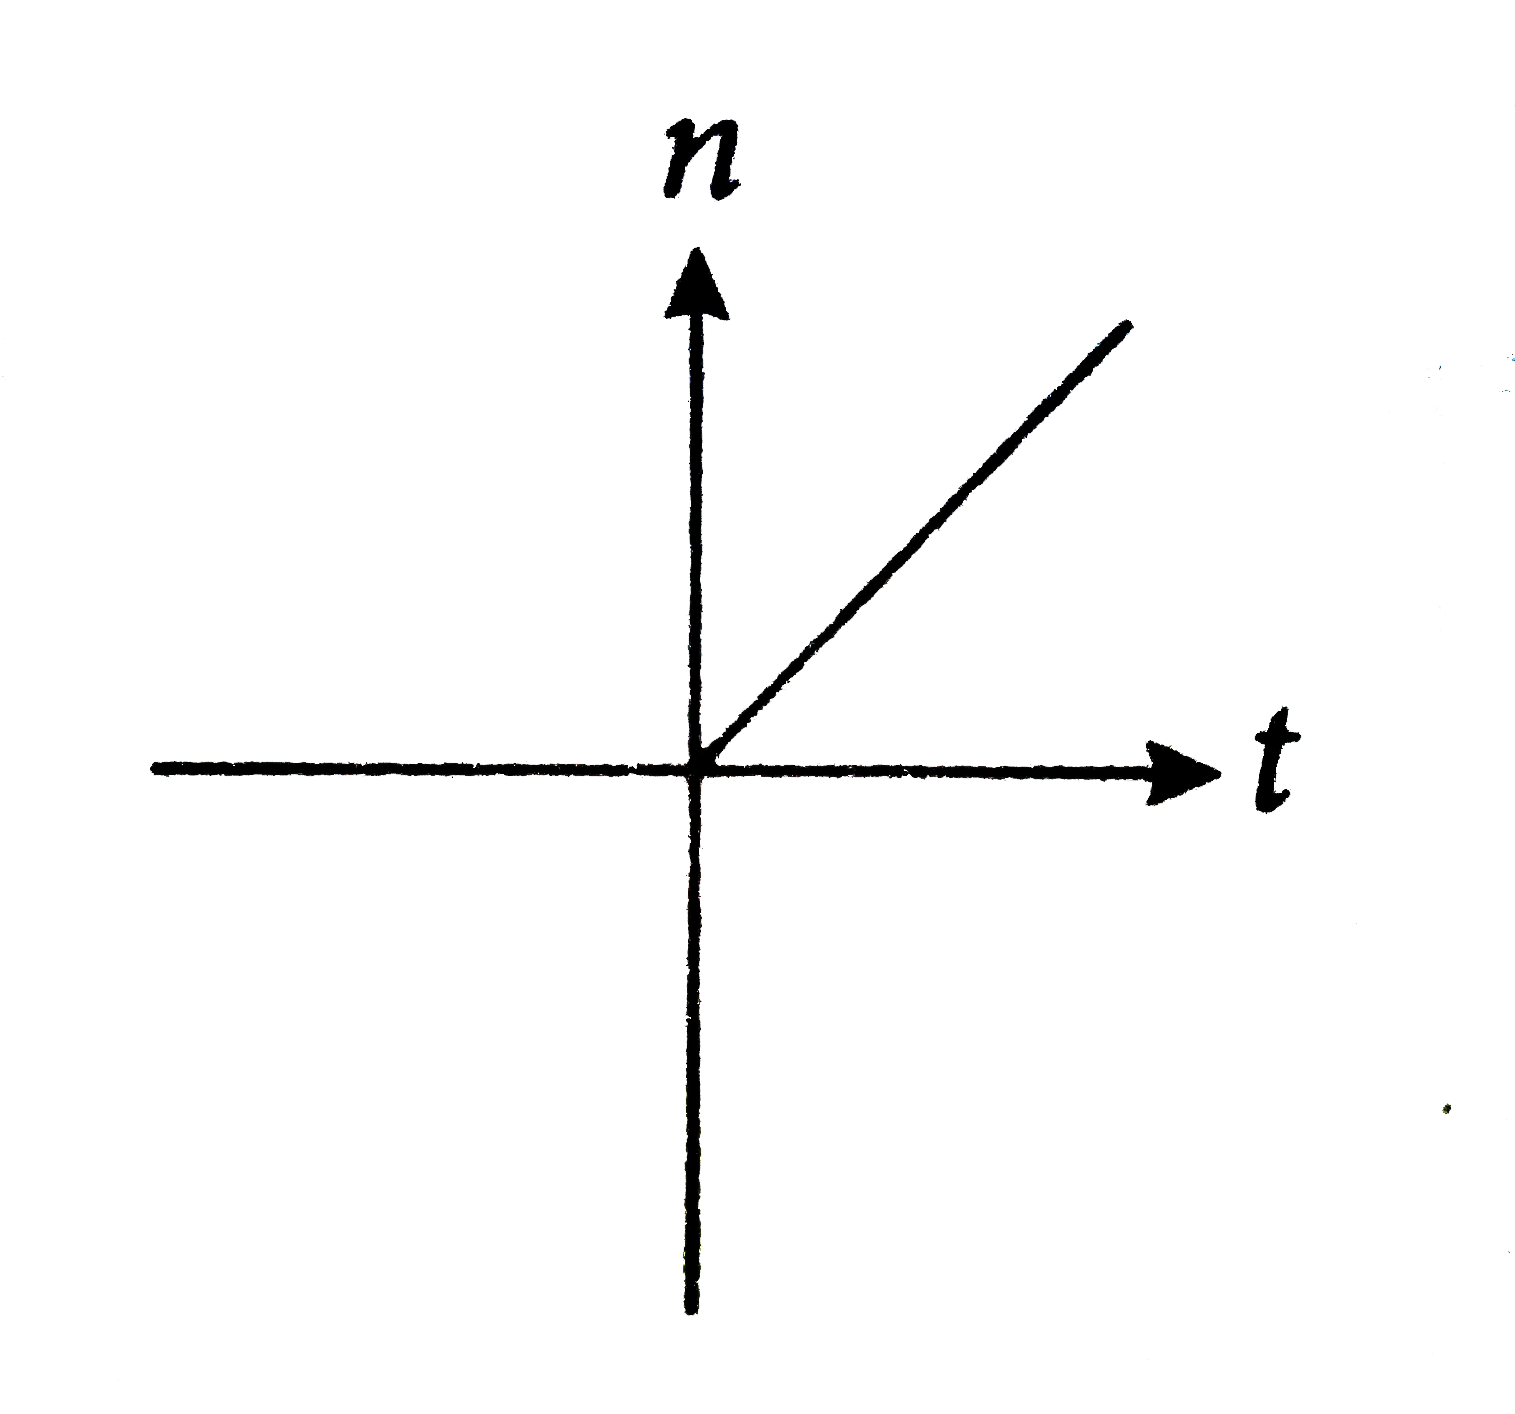
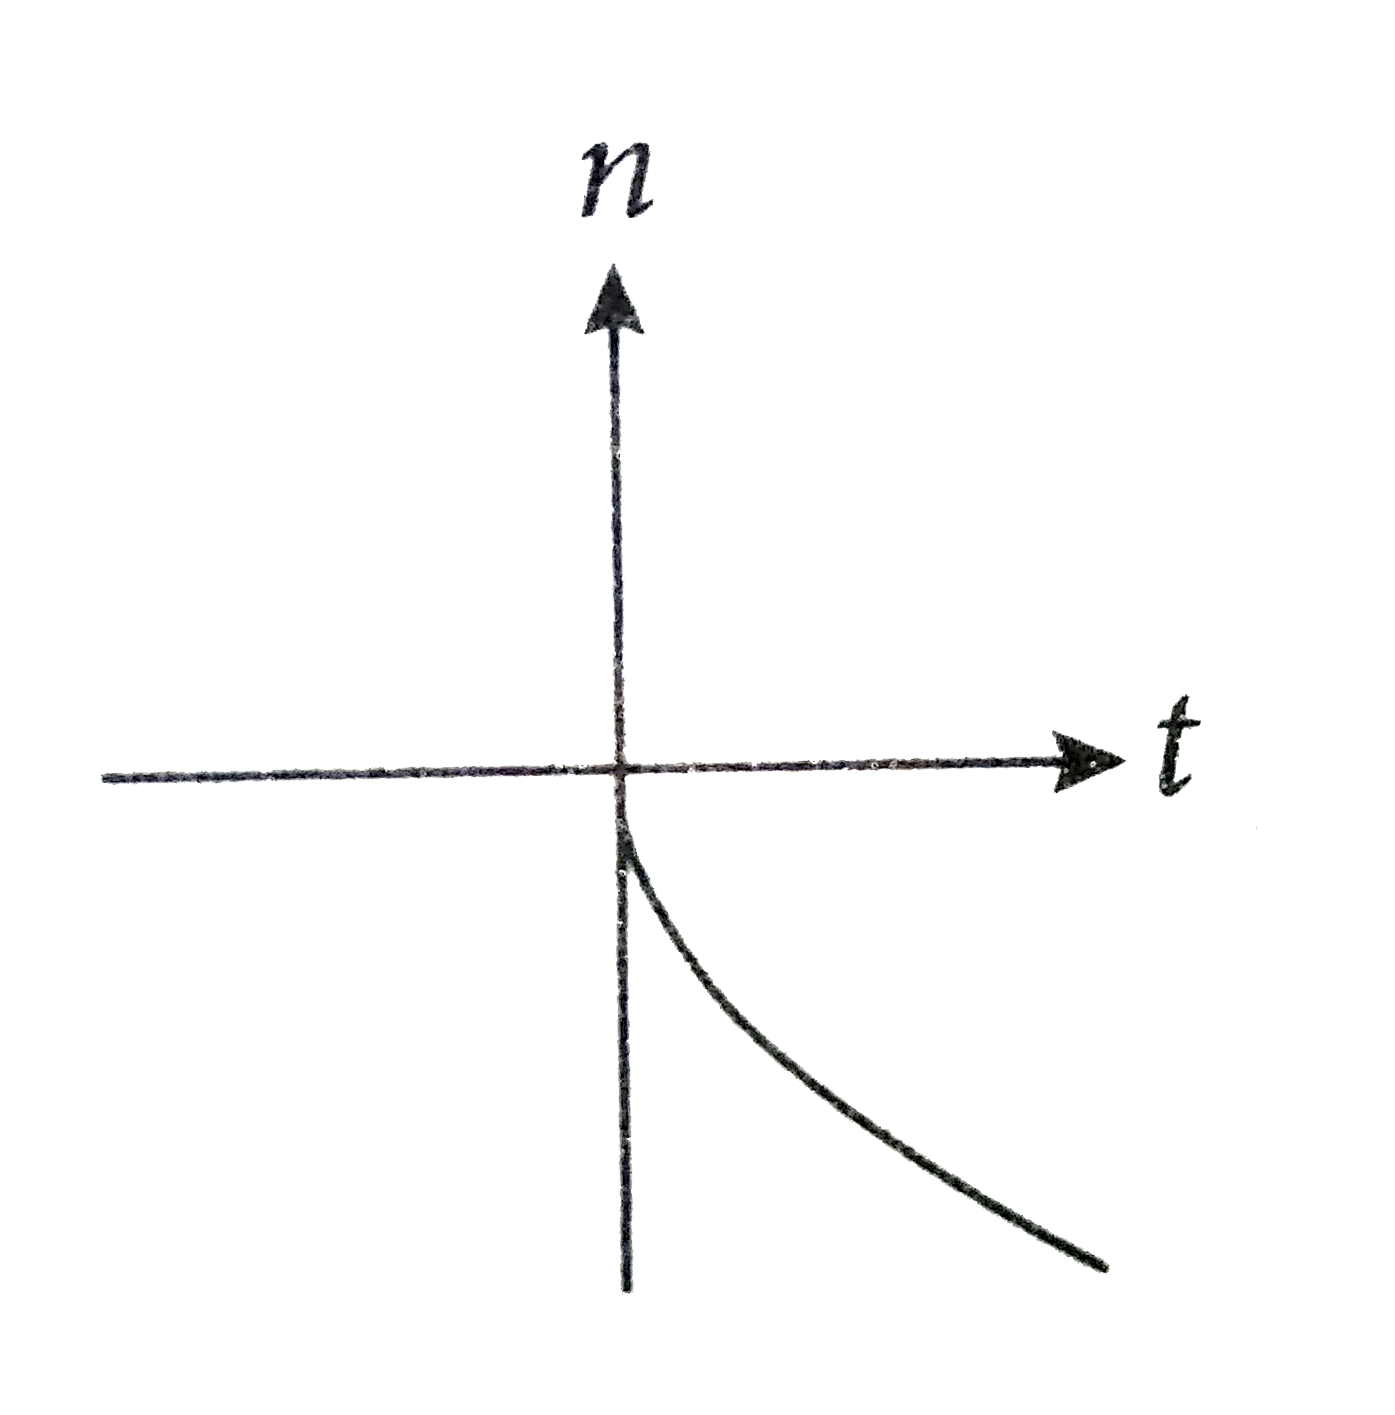
The correct Answer is:A
Step by step video, text & image solution for A coffee shop noticed that the outside temperature affected the number of customers who came to the shop that day, as shown in the table above. Which of the following graphs best represents the relationship between the outside temperature t, and the number of customers,n, as indicated by the table? by Maths experts to help you in doubts & scoring excellent marks in Class 12 exams.
Updated on:21/07/2023Topper's Solved these Questions
- ADVANCED ARITHMETICBOOK - PRINCETONCHAPTER - ADVANCED ARITHMETICEXERCISE - Advanced Arithmetic Drill: Calculator-Permitted Section
16 Videos
- ADDITIONAL TOPICSBOOK - PRINCETONCHAPTER - ADDITIONAL TOPICSEXERCISE - QUICK QUIZ #9
3 Videos
- ALEGBRABOOK - PRINCETONCHAPTER - ALEGBRAEXERCISE - QUICK QUIZ #6
3 Videos
Similar Questions
20-2x
20-x
20
20+x
20+2x
What is the average (arithmetic mean) of the list of number above?
View Solution
The table above provides values for the function g for selected values of t. Which of the following defines the function g?
View SolutionIf (3x)2=81, which of the following is a possible value of x?
View SolutionHow many lines of symmetry does the above figure have ?
View SolutionWhich of the following are correct chain isomers of butane ? (i)
View SolutionDetermine the point of symmetry of a regular hexagon.
View SolutionDtermine the images of the following figure about the given line :
View SolutionMatch the following Column A to Column B

View SolutionMatch the following Column A to Column B

View SolutionMatch the following Column A to Column B

View SolutionThe inequation represented by the graph given below is :
View SolutionThe inequation that best describes the graph given below is _________
View SolutionThe inequation that best describes the following graph is _________
View SolutionWhich inequations represent the shaded region in the given figure
View SolutionThe equation of straight line shown in figure is :
ltimg src="https://d10lpgp6xz60nq.cloudfront.net/physics_images/ALN_PHY_R04_E01_020_Q01.png" width="80%"gt
View Solution
