A thin rod of length 'L' is lying along the x-axis with its ends at x=0 and x=L its linear (mass/length) varies with xask(xL)n, where n can be zero of any positive number. If to position xCM of the centre of mass of the rod is plotted against 'n', which of the following graphs best apporximates the dependence of xCM on n?
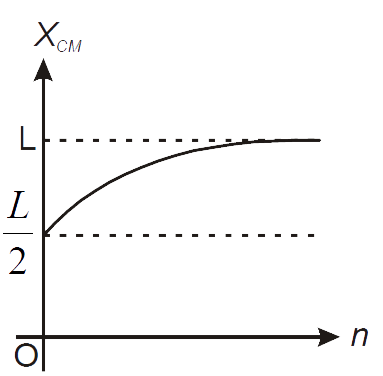
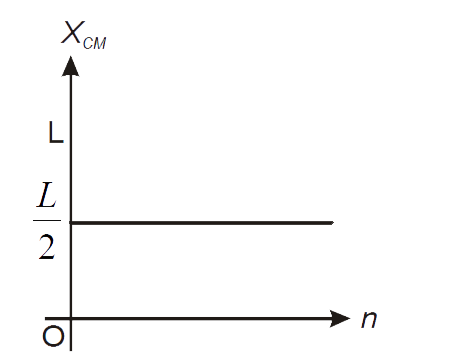
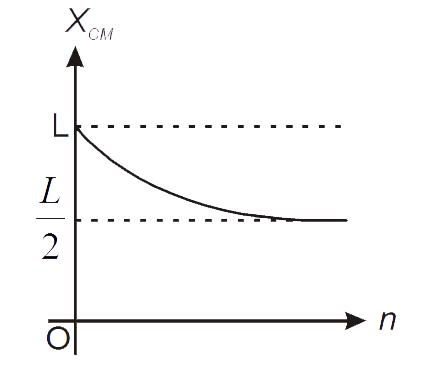
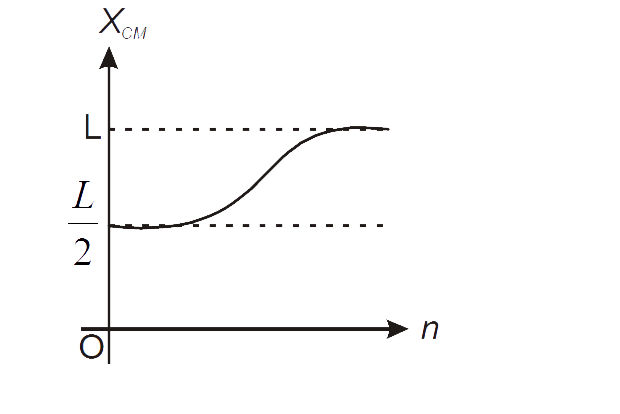
The correct Answer is:A
Step by step video, text & image solution for A thin rod of length 'L' is lying along the x-axis with its ends at x=0 and x=L its linear (mass/length) varies with x as k((x)/(L))^n, where n can be zero of any positive number. If to position x_(CM) of the centre of mass of the rod is plotted against 'n', which of the following graphs best apporximates the dependence of x_(CM) on n? by Physics experts to help you in doubts & scoring excellent marks in Class 12 exams.
Updated on:21/07/2023Topper's Solved these Questions
- CENTRE OF MASSBook:MOTIONChapter:CENTRE OF MASSExercise:Exercise - 4 Level-II
Explore 20 Videos
- CENTRE OF MASSBook:MOTIONChapter:CENTRE OF MASSExercise:Exercise - 3 Level-II
Explore 16 Videos
- Capacitance Book:MOTIONChapter:Capacitance Exercise:EXERCISE -4 LEVEL II
Explore 19 Videos
- CIRCULAR MOTIONBook:MOTIONChapter:CIRCULAR MOTIONExercise:EXERCISE - 4
Explore 16 Videos
Similar Questions
A thin rod of length 6m is lying along the x-axis with its ends at x=0 and x=6m. It linear density (mass/length) varies with x as kx4. Find the position of centre of mass of rod in meters.
View SolutionA rod of length L is placed along the x-axis between x = 0 and x = L. The linear density (mass/ length) λ of the rod varies with the distance x from the origin as λ=Rx. Here, R is a positive constant. Find the position of centre of mass of this rod.
View Solution
Knowledge Check
A thin rod of length L is lying along the x-axis with its ends at x = 0 and x = L. Its linear density (mass/length) varies with x as k(xL)n where n can be zero or any positive number. If the position XCM of the centre of mass of the rod is plotted against n, which of the following graphs best approximates the dependence of XCM on n?
A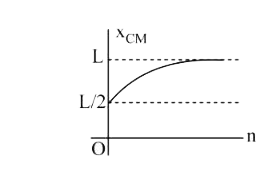 B
B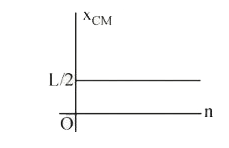 C
C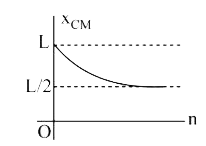 D
D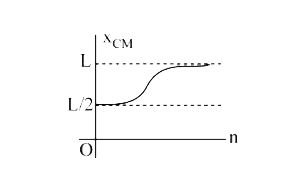
A thin rod of length L is lying along the x-axis with its ends at x = 0 and x = L. Its linear density (mass/length) varies with x as k(xL)n where n can be zero or any positive integer. If position Xcm of centre of mass of the rod is plotted against n, which of the following graphs best approximates the dependence of xCM on n?
A B
B C
C D
D
A thin rod of length 6 m is lying along the x-axis with its ends at x=0 and x=6m. Its linear density *mass/length ) varies with x as kx4. Find the position of centre of mass of rod in meters.
A5mB3mC2mD4m
A rod of length L is placed along the x-axis between x = 0 and x = L. The linear density (mass/length) λ of the rod varies with the distance x from the origin as λ = Rx. Here, R is a positive constant. Find the position of centre of mass of this rod.
View SolutionA rod of length L is placed along the x-axis between x=0 and x=L. The linear mass density (mass/length) ρ of the rod varies with the distance x from the origin as ρ=a+bx. Here, a and b are constants. Find the position of centre of mass of this rod.
View SolutionA rod of length L is placed along the x-axis between x=0 and x=L. The linear mass density is λ such that λ=a+bx. Find the mass of the rod.
View SolutionSolve (x−1)n=xn, where n is a positive integer.
View SolutionA rod of length L is placed along the X-axis between x=0andx=L. The linear density (mass/length) ρ of the rod varies with the distance x from the origin as ρj=a+bx. a. Find the SI units of a and b. b. Find the mass of the rod in terms of a,b, and L.
View Solution

