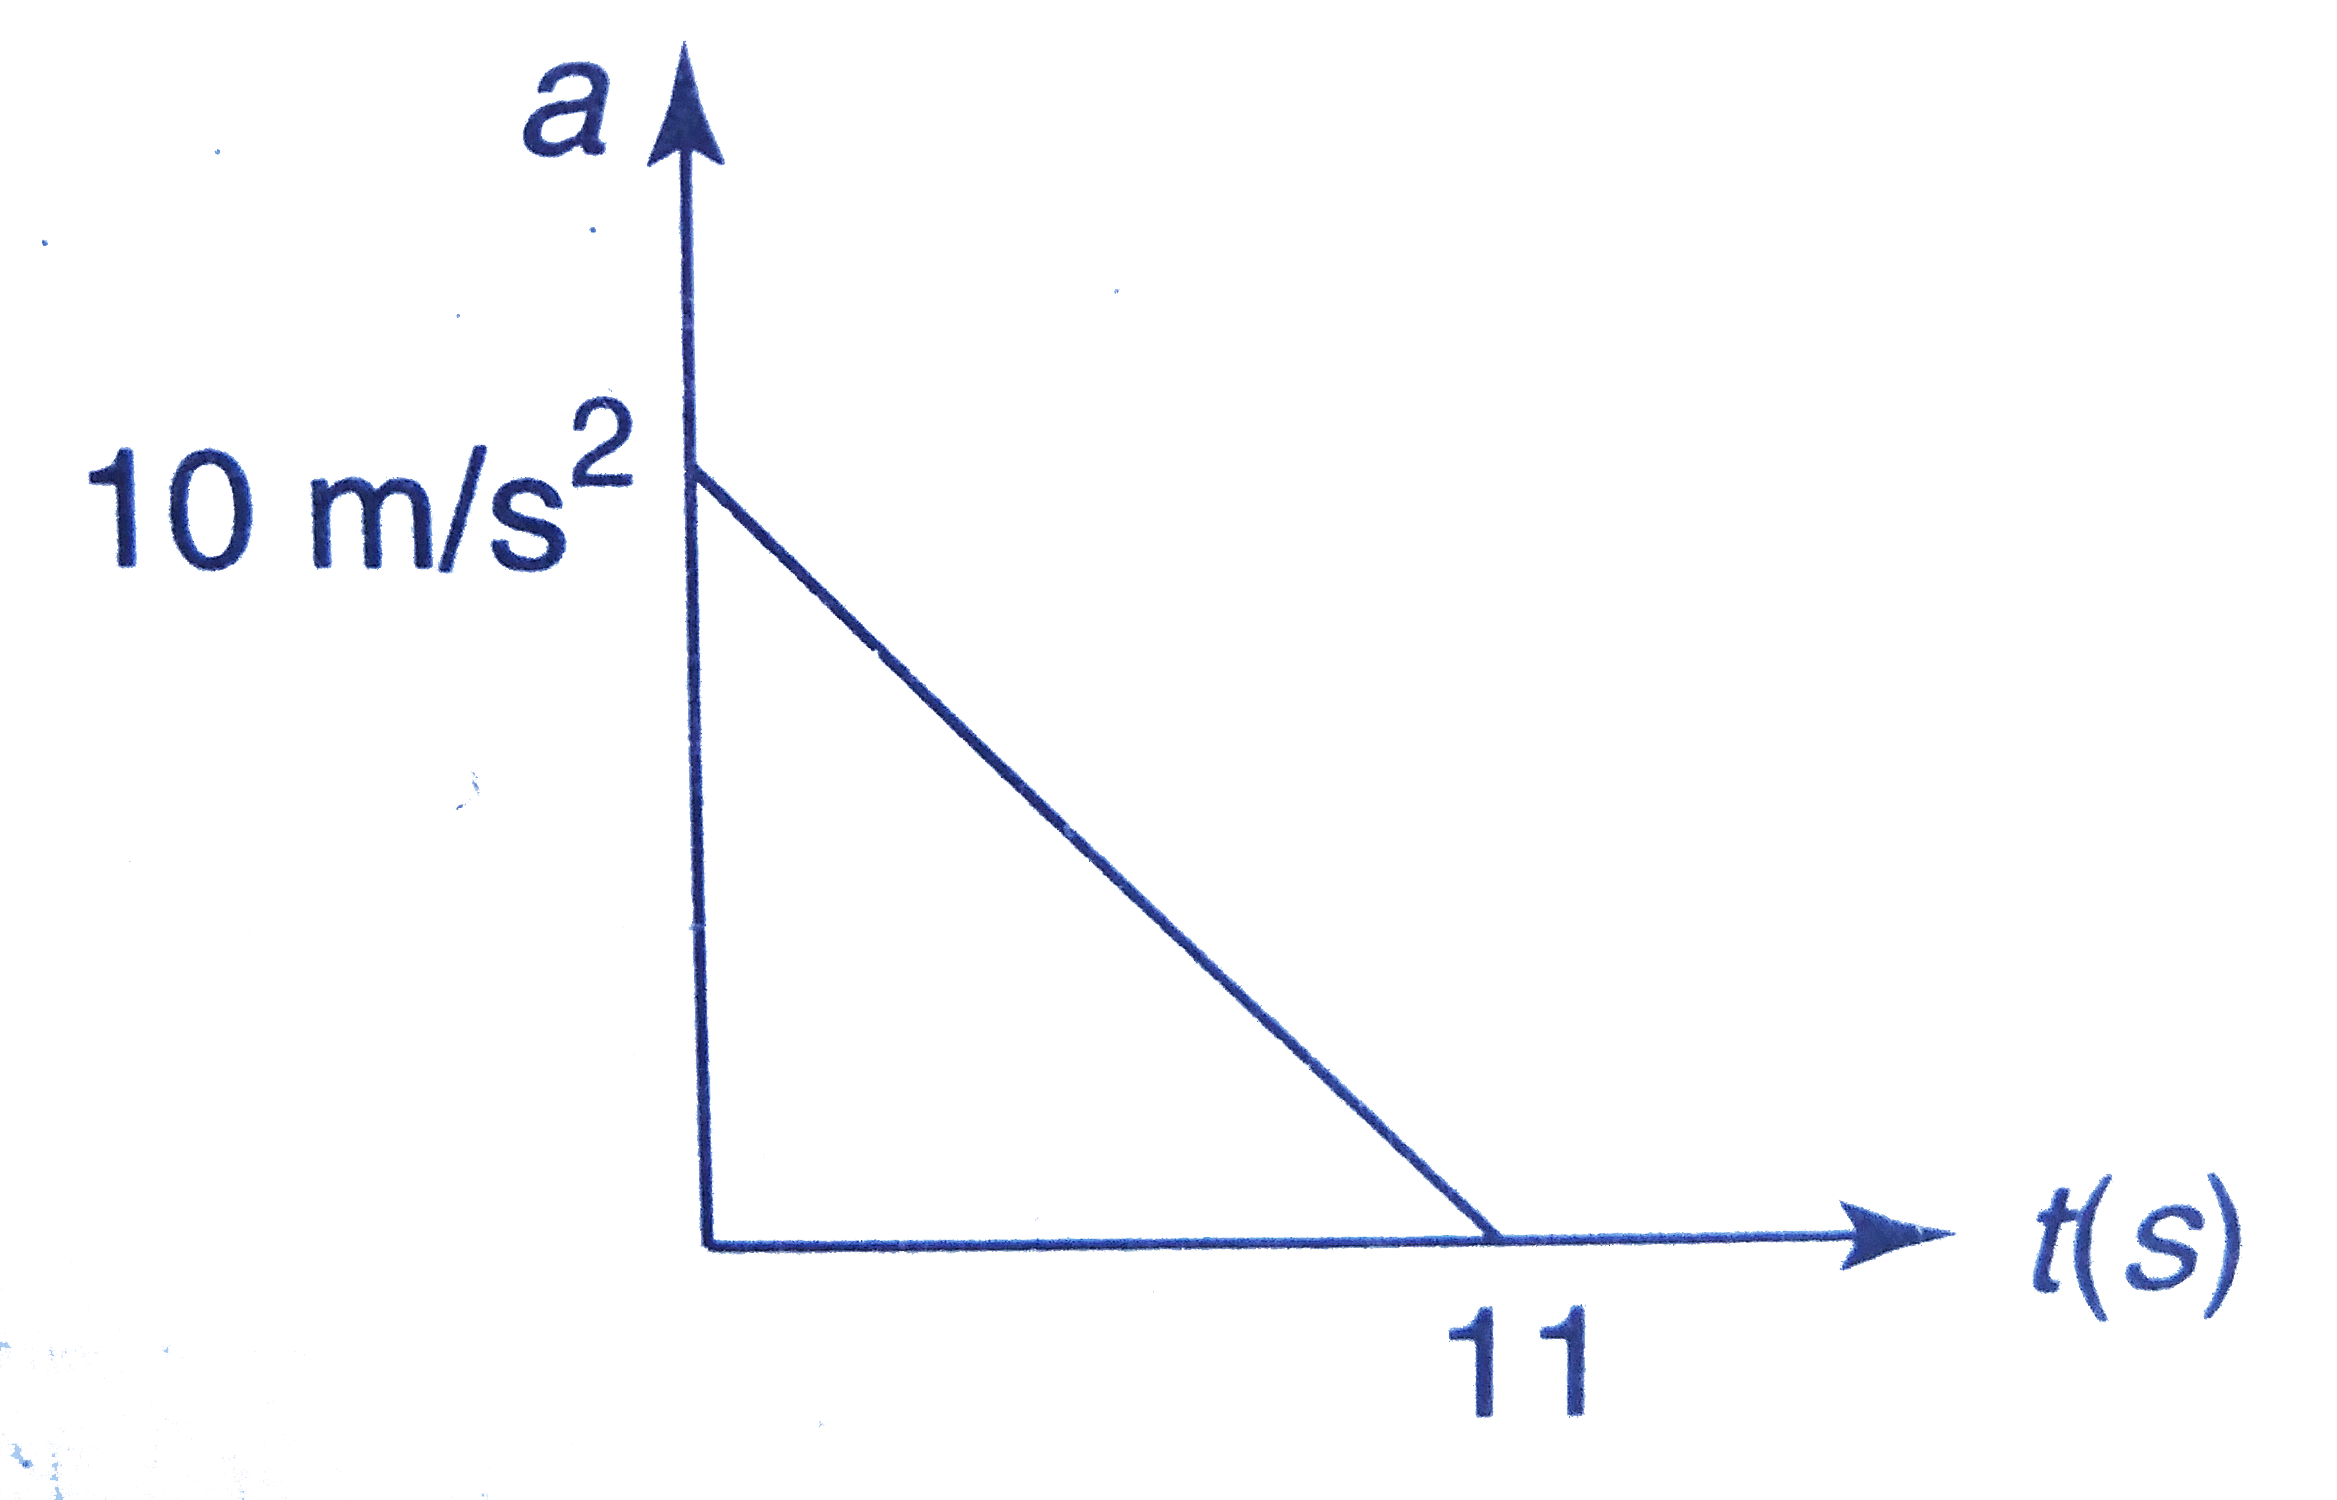
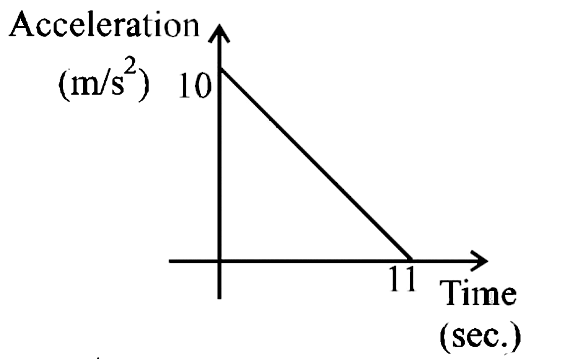
A particle starting from rest. Its acceleration (a) versus time (t) is as shown in the figure.
The maximum speed of the particle will be.
110ms−1
55ms−1
550ms−1
660ms−1
The correct Answer is:B
Till 11s, acceleration is positive, so velocity will go on increaseing up to 11 s and maximum velocity will happened at 11s. The area under the acceleration -time graph gives change in velocity. Since particle starts with u=0, change in velocity is
vf−vi=vmax−0= Area under a−t graph
or vmax=12×10×11=55ms−1
Topper's Solved these Questions
- MOTION IN A STRAIGHT LINEBook:GRB PUBLICATIONChapter:MOTION IN A STRAIGHT LINEExercise:More than one choice is correct
Explore 16 Videos
- MOTION IN A STRAIGHT LINEBook:GRB PUBLICATIONChapter:MOTION IN A STRAIGHT LINEExercise:Assertion Reason
Explore 12 Videos
- MOTION IN A STRAIGHT LINEBook:GRB PUBLICATIONChapter:MOTION IN A STRAIGHT LINEExercise:Problems and Practice
Explore 16 Videos
- FRICTION AND CIRCULAR MOTION Book:GRB PUBLICATIONChapter:FRICTION AND CIRCULAR MOTION Exercise:Comprehension type
Explore 11 Videos
- MOTION IN TWO AND THREE DIMENSIONSBook:GRB PUBLICATIONChapter:MOTION IN TWO AND THREE DIMENSIONSExercise:All Questions
Explore 210 Videos
Similar Questions
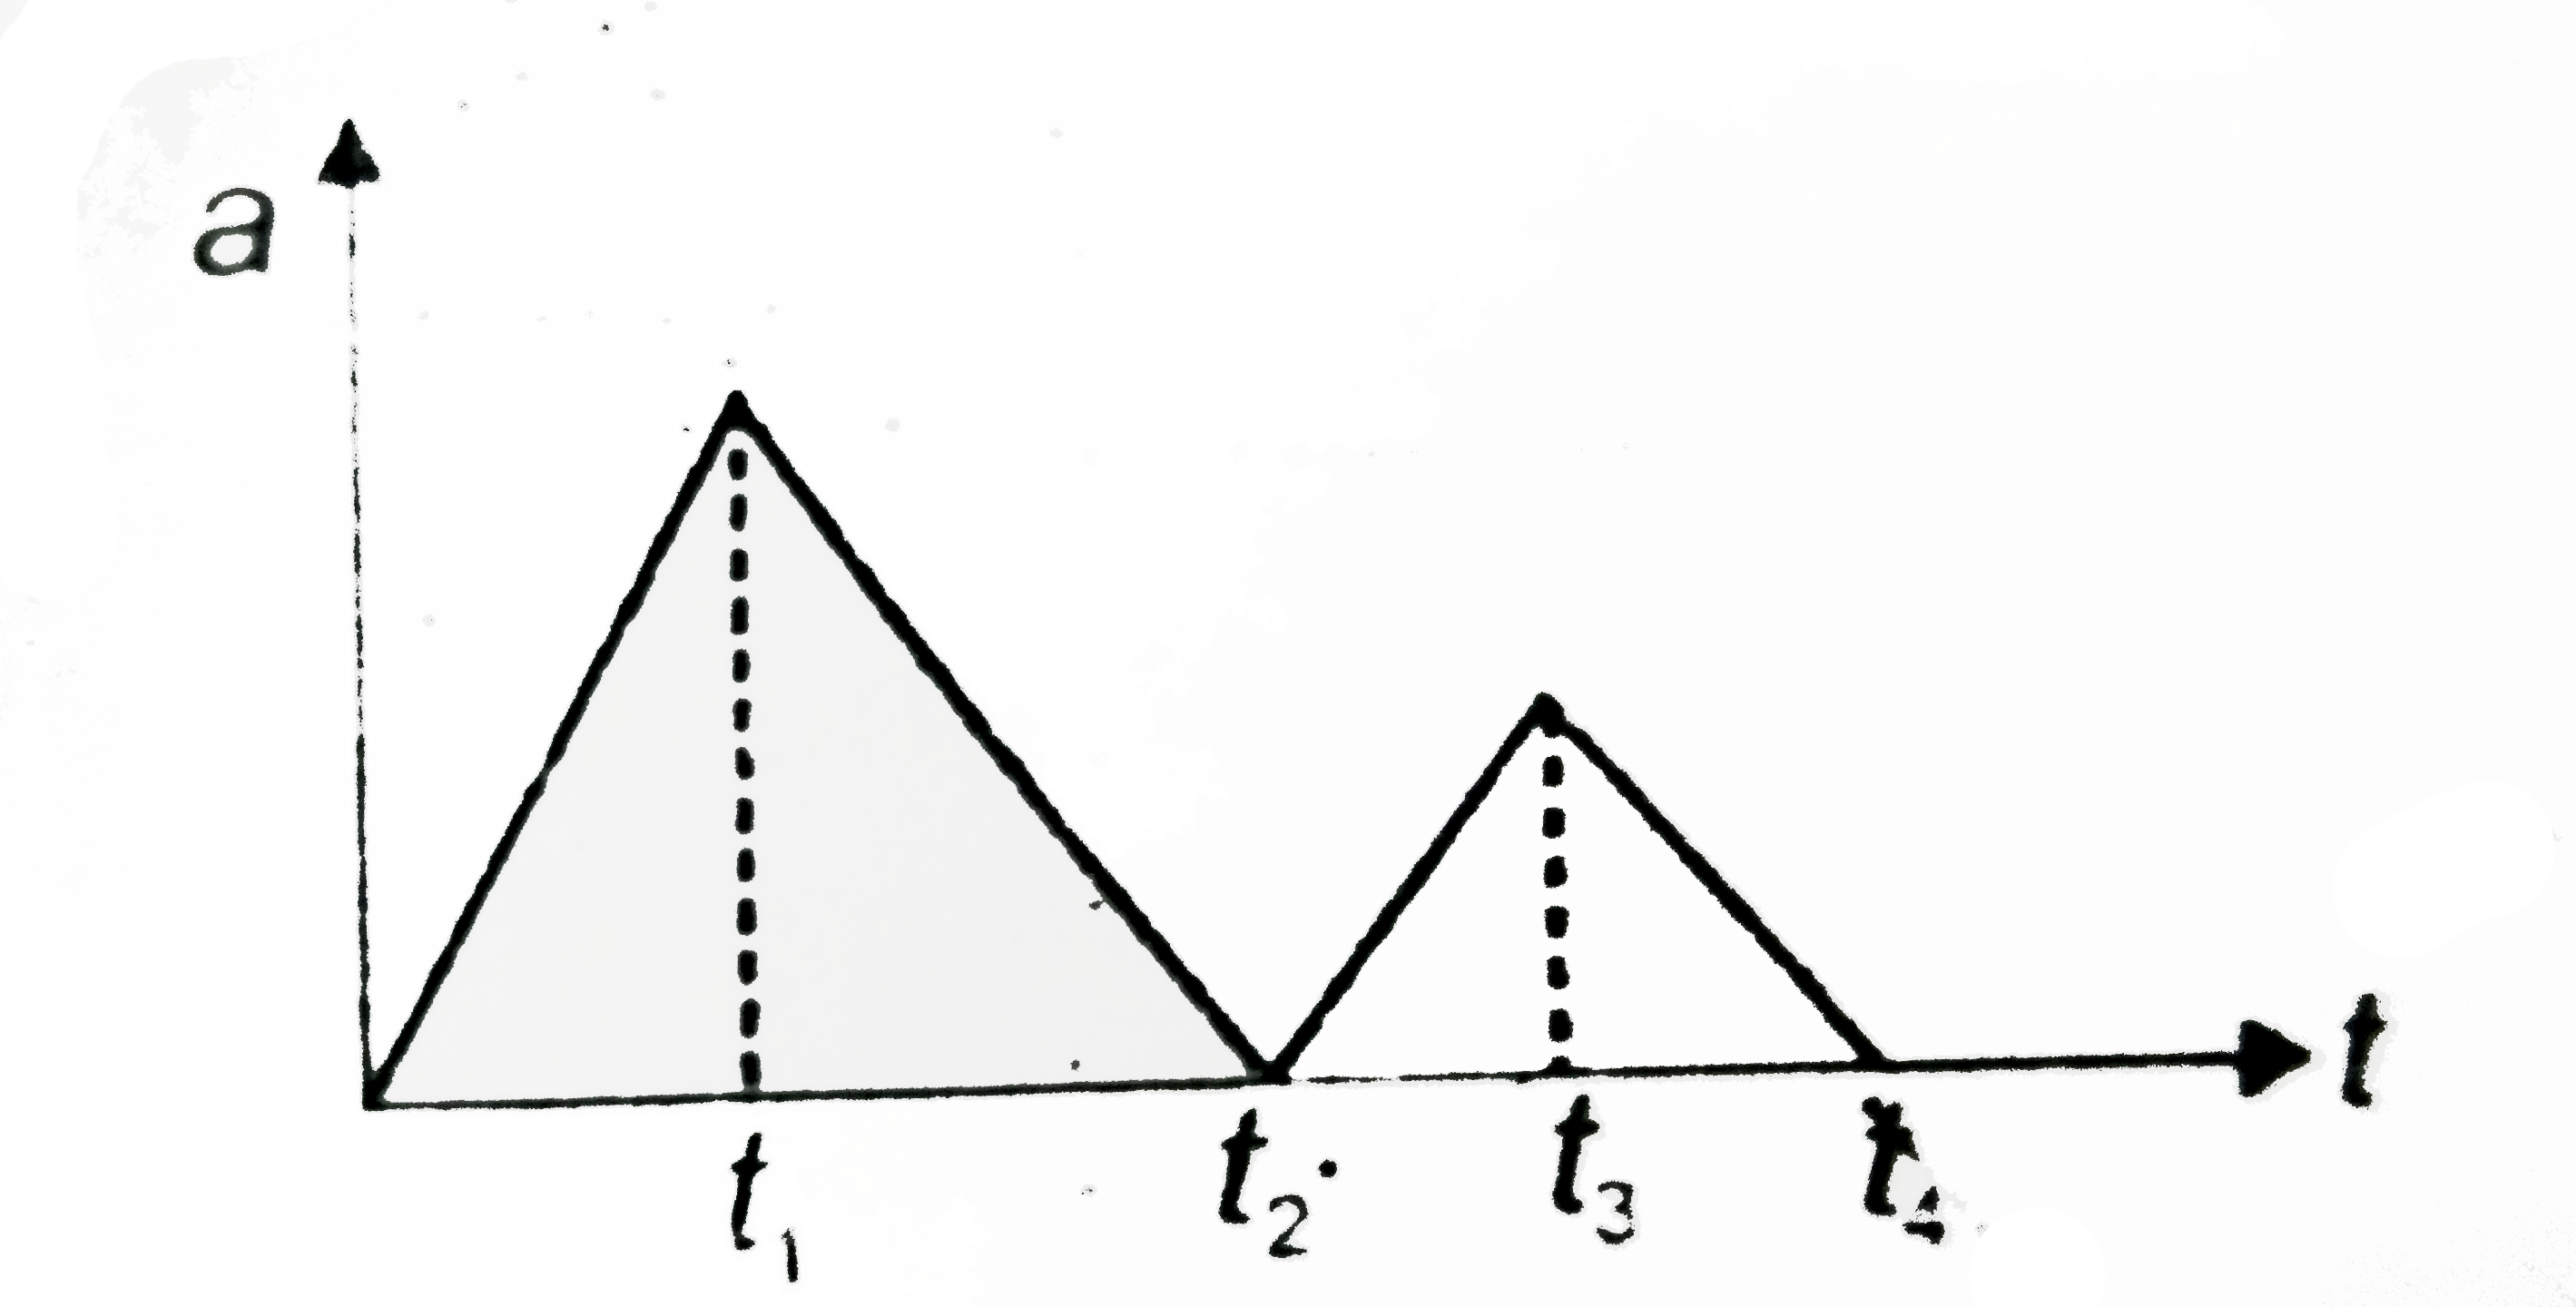
A particle starts moving from rest on a straight line. Its acceleration a verses time t is shown in the figure. The speed of the particle is maximum at the instant
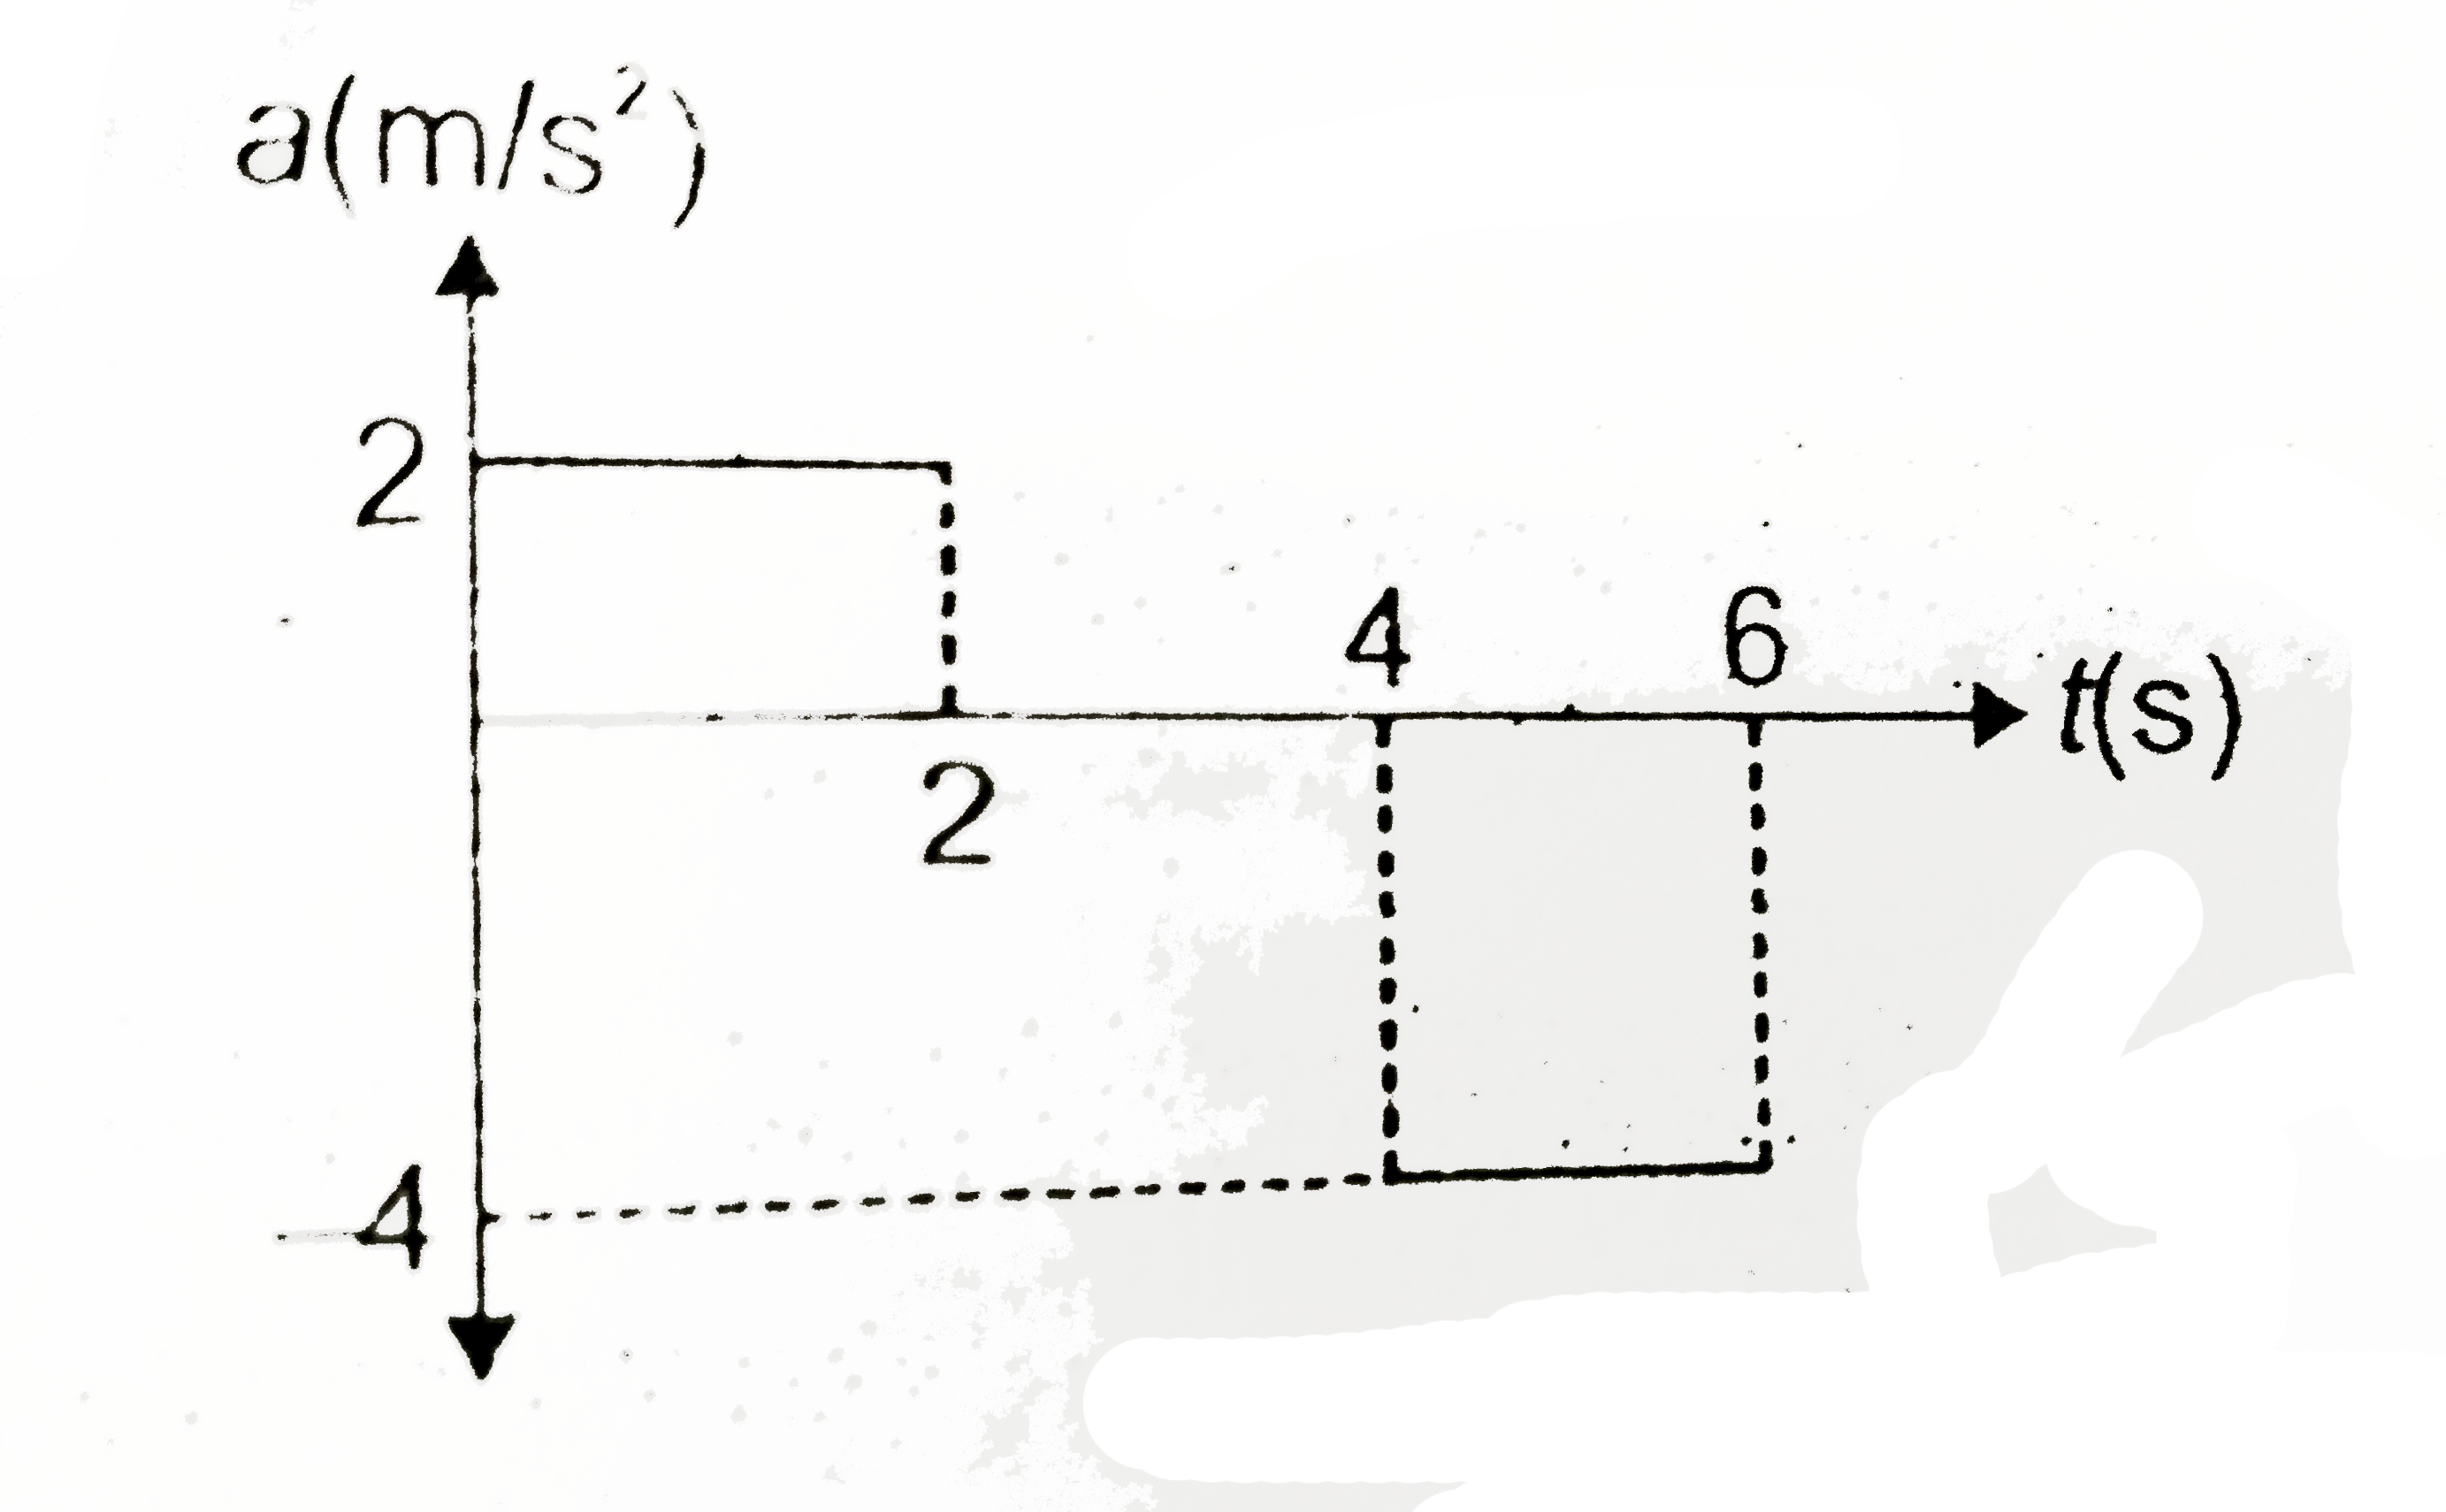
View SolutionA particle starts from rest. Its acceleration is varying with time as shown in the figure. When the particle comes to rest, its distance from its starting point is
View Solution
Knowledge Check
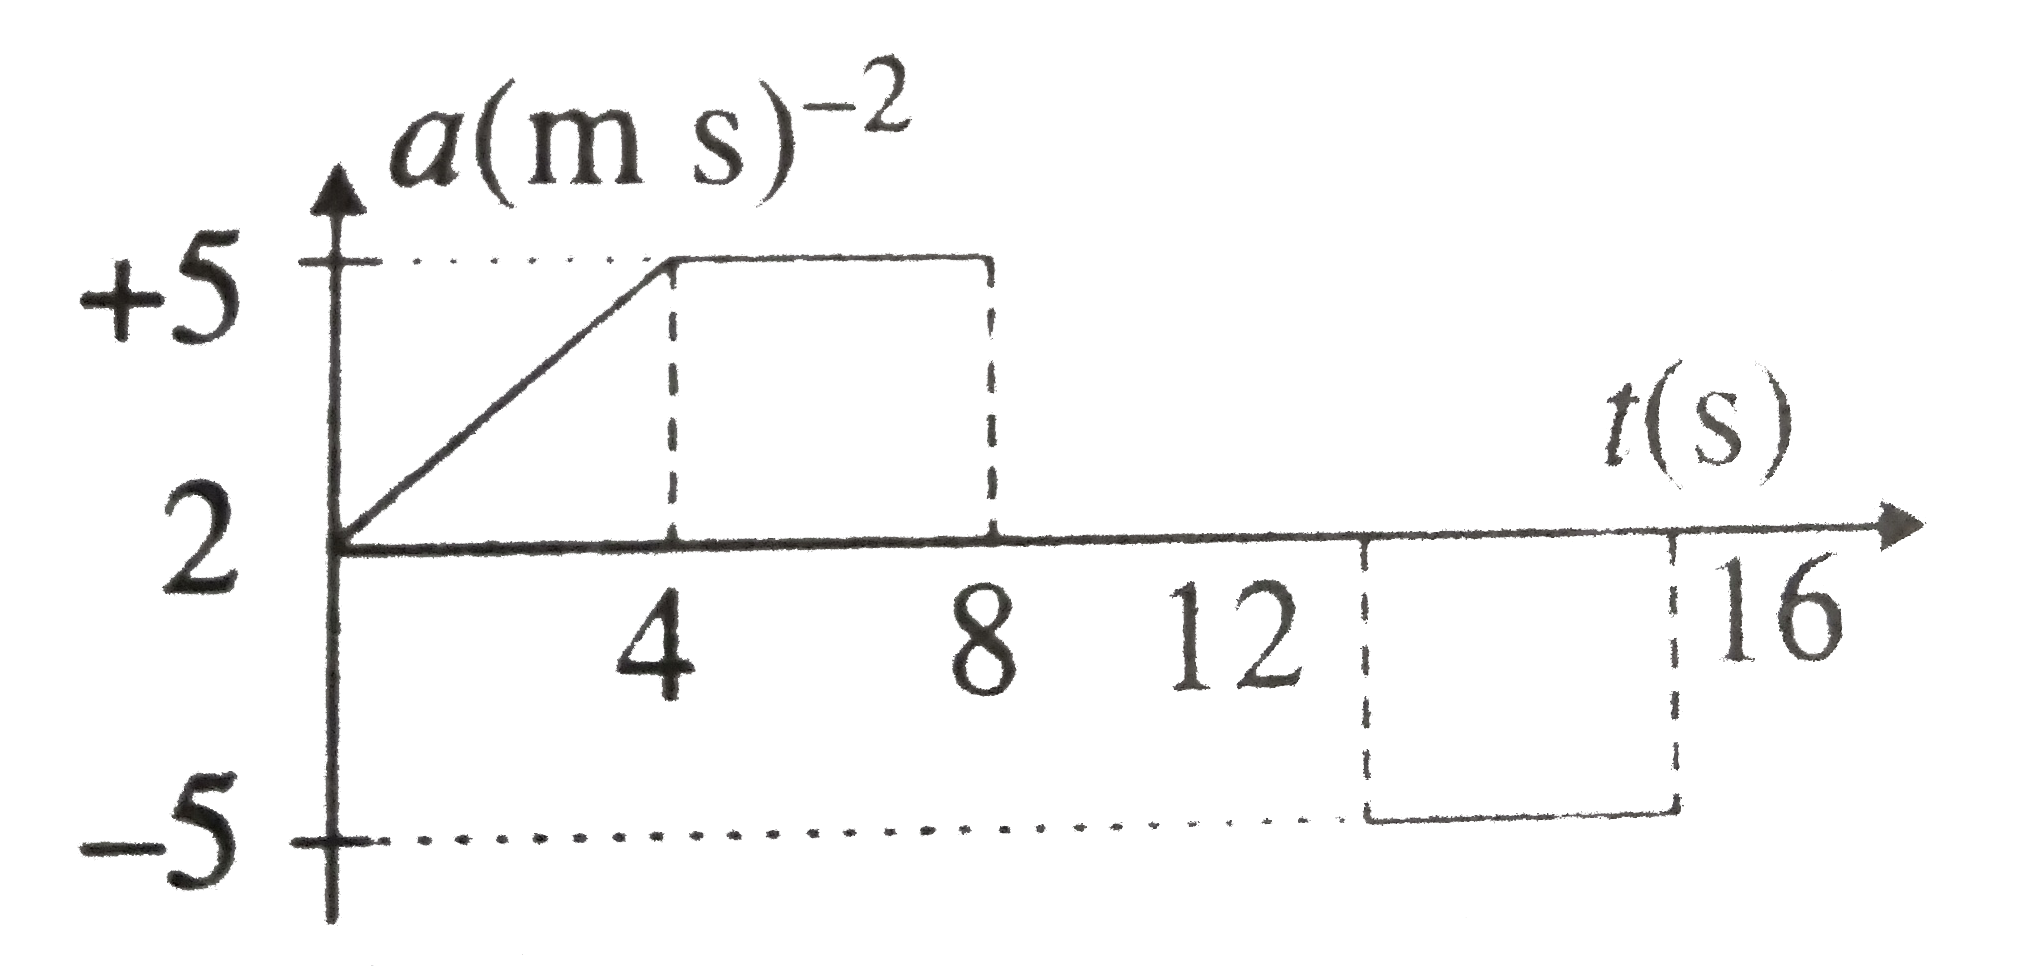
The acceleration of a particle starting from rest and travelling along a straight line is shown in figure. The maximum speed of the particle is
 A20ms−1B30ms−1C40ms−1D60ms−1
A particle starts from rest. Its acceleration at time t=0 is 5m/s2 which varies with time as shown in the figure. The maximum speed of the particle will be
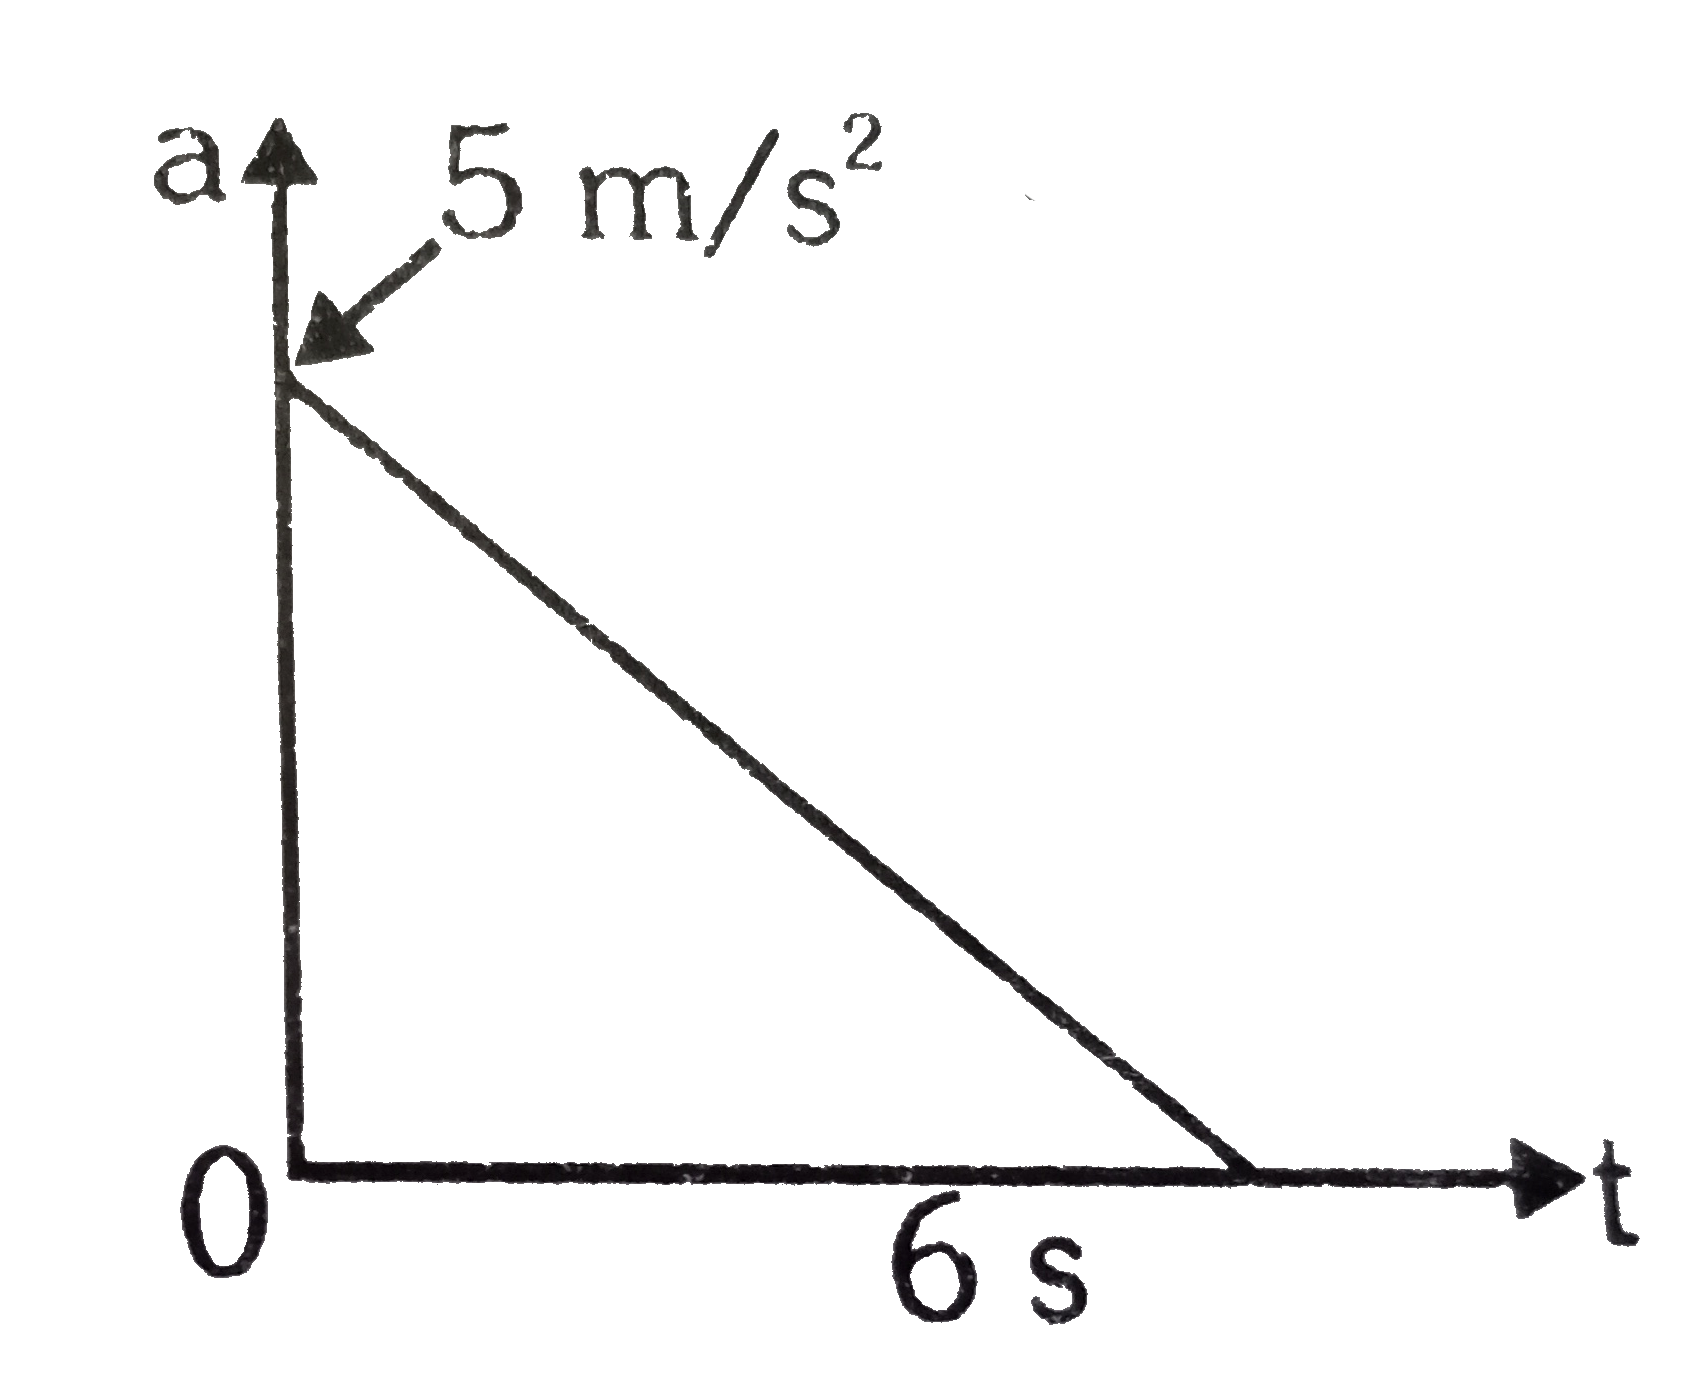 A7.5m/sB15m/sC30m/sD37.5 m/s
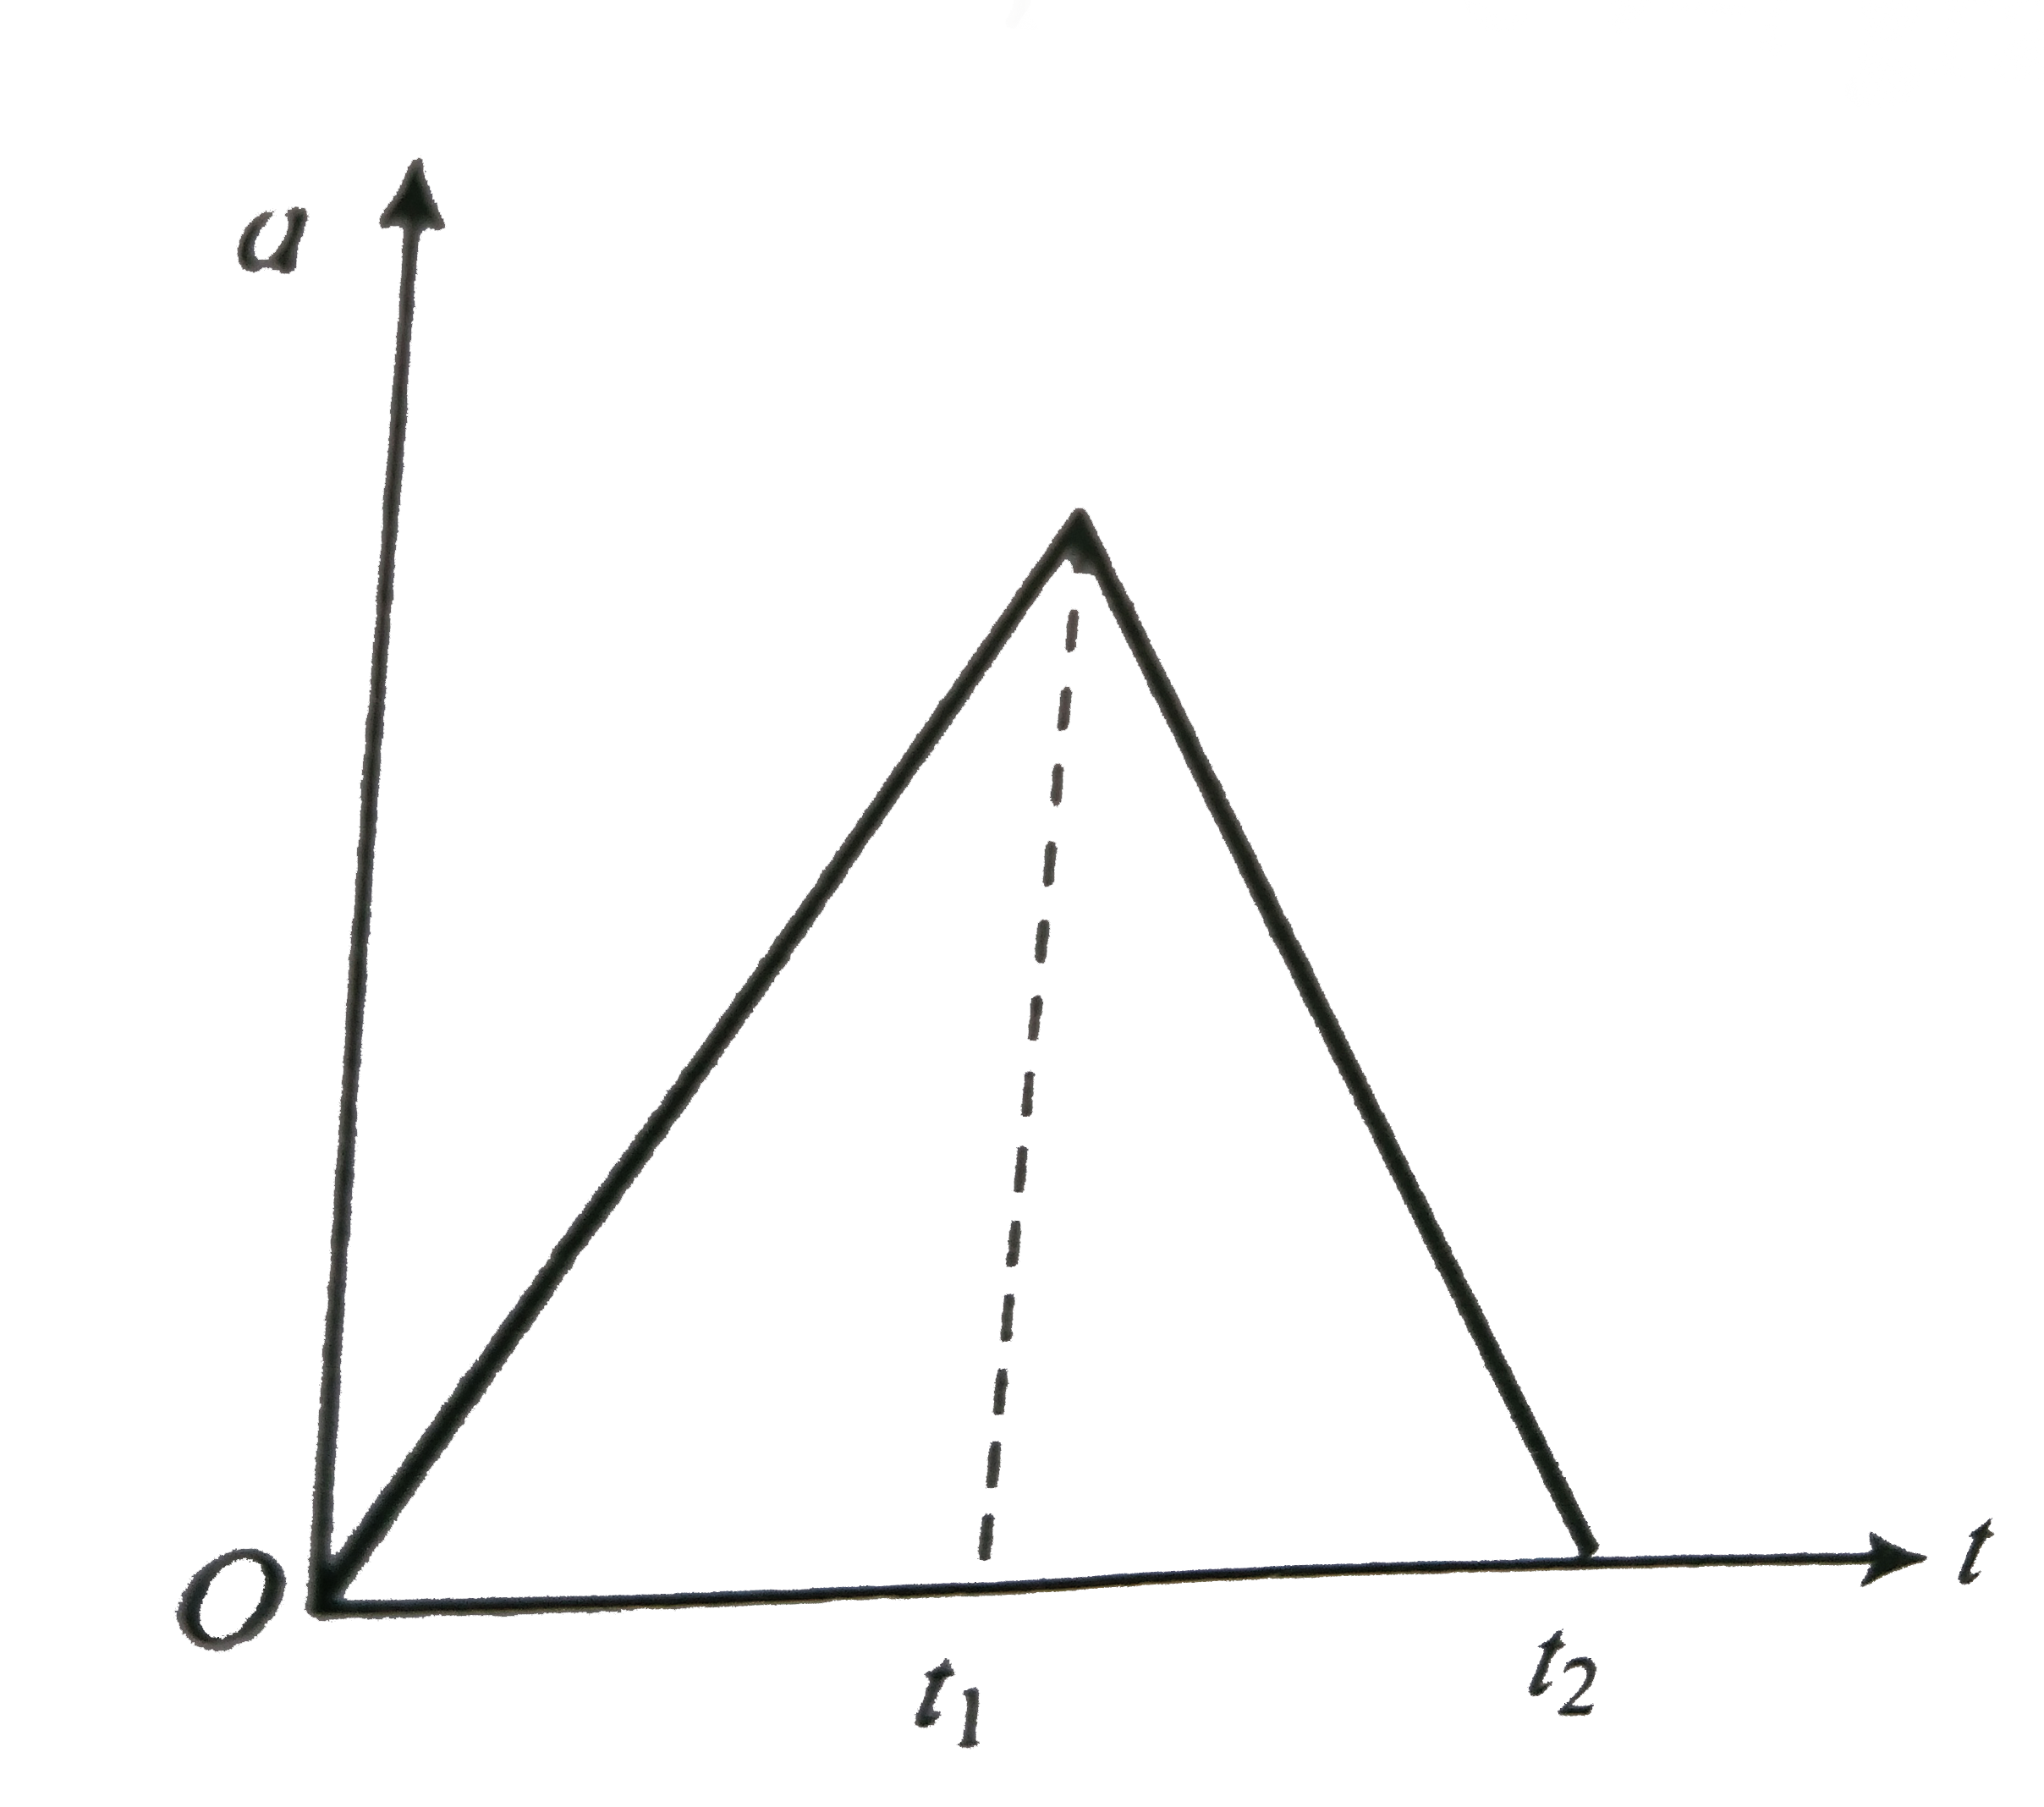
The acceleration versus time graph of a particle is shown in the figure. The respective v−t graph of the particle is .
 .A
.A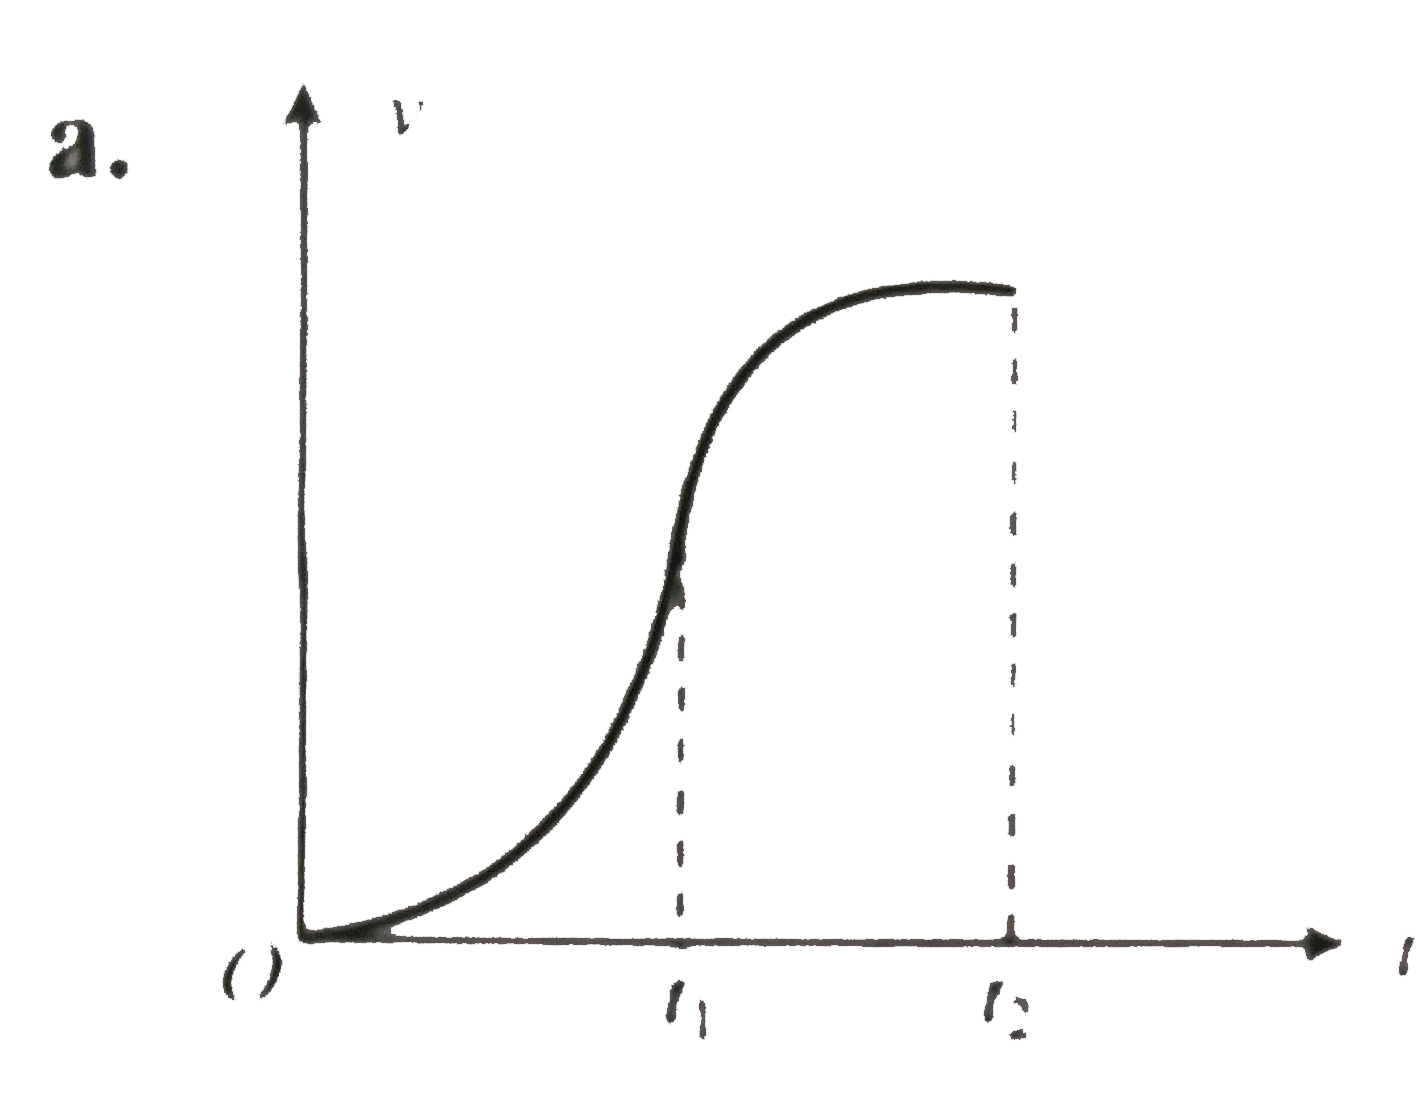 .B
.B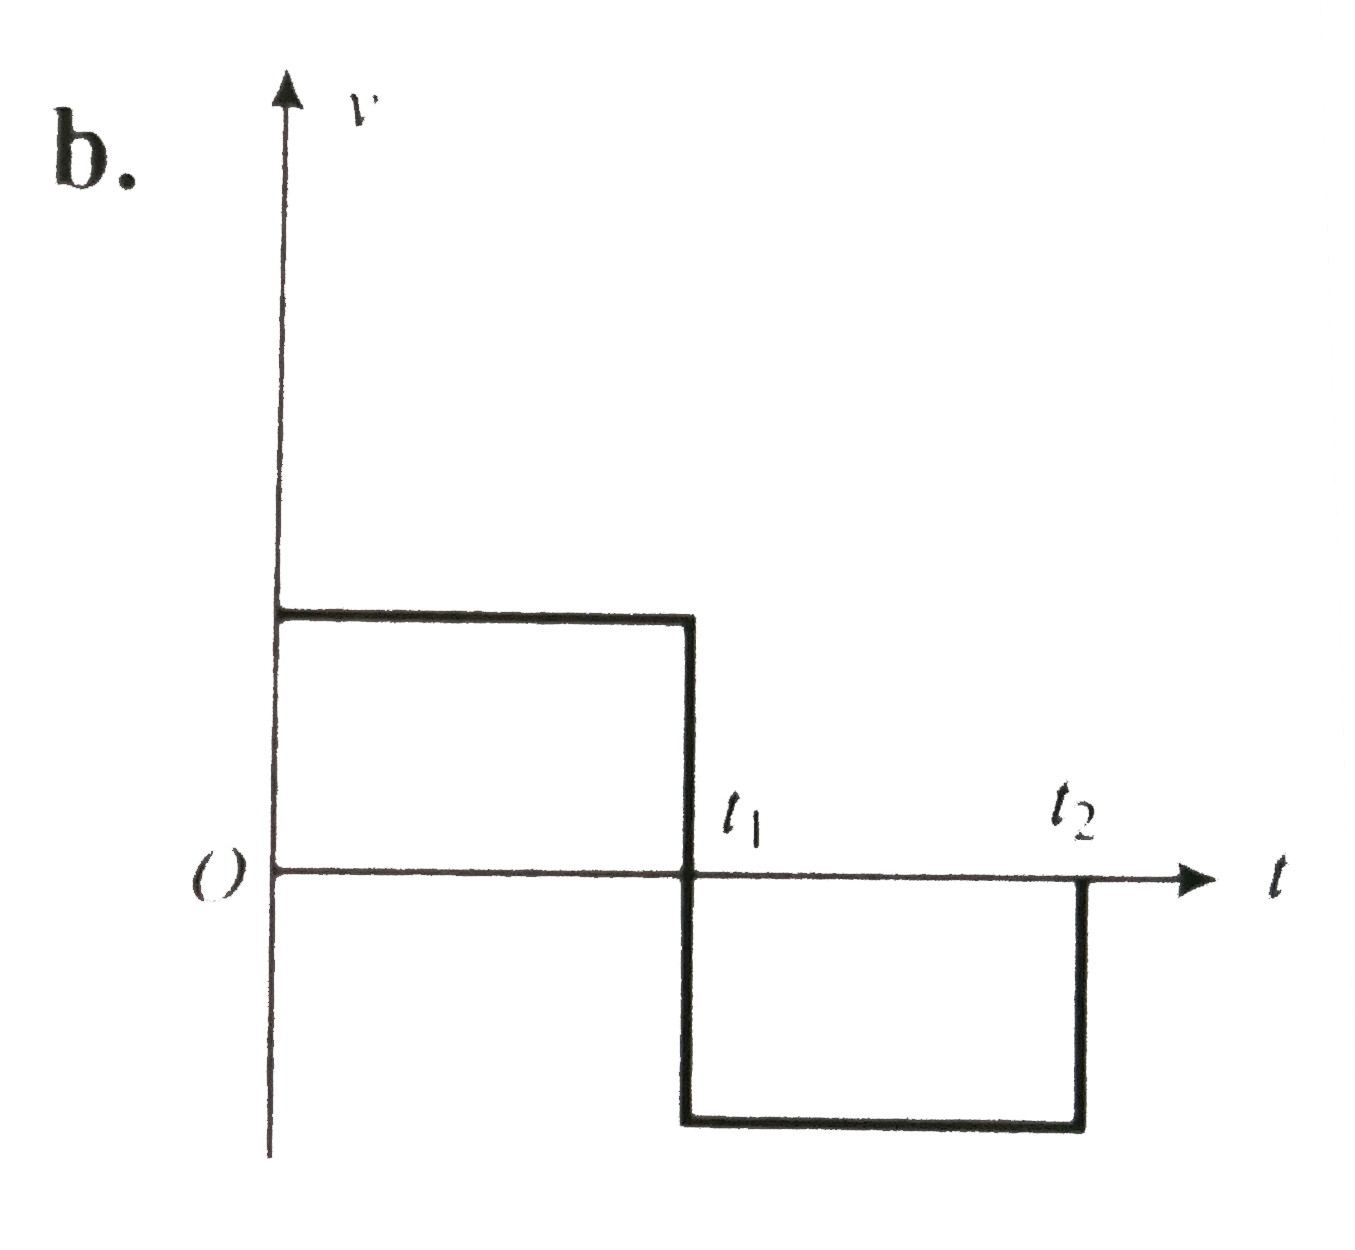 .C
.C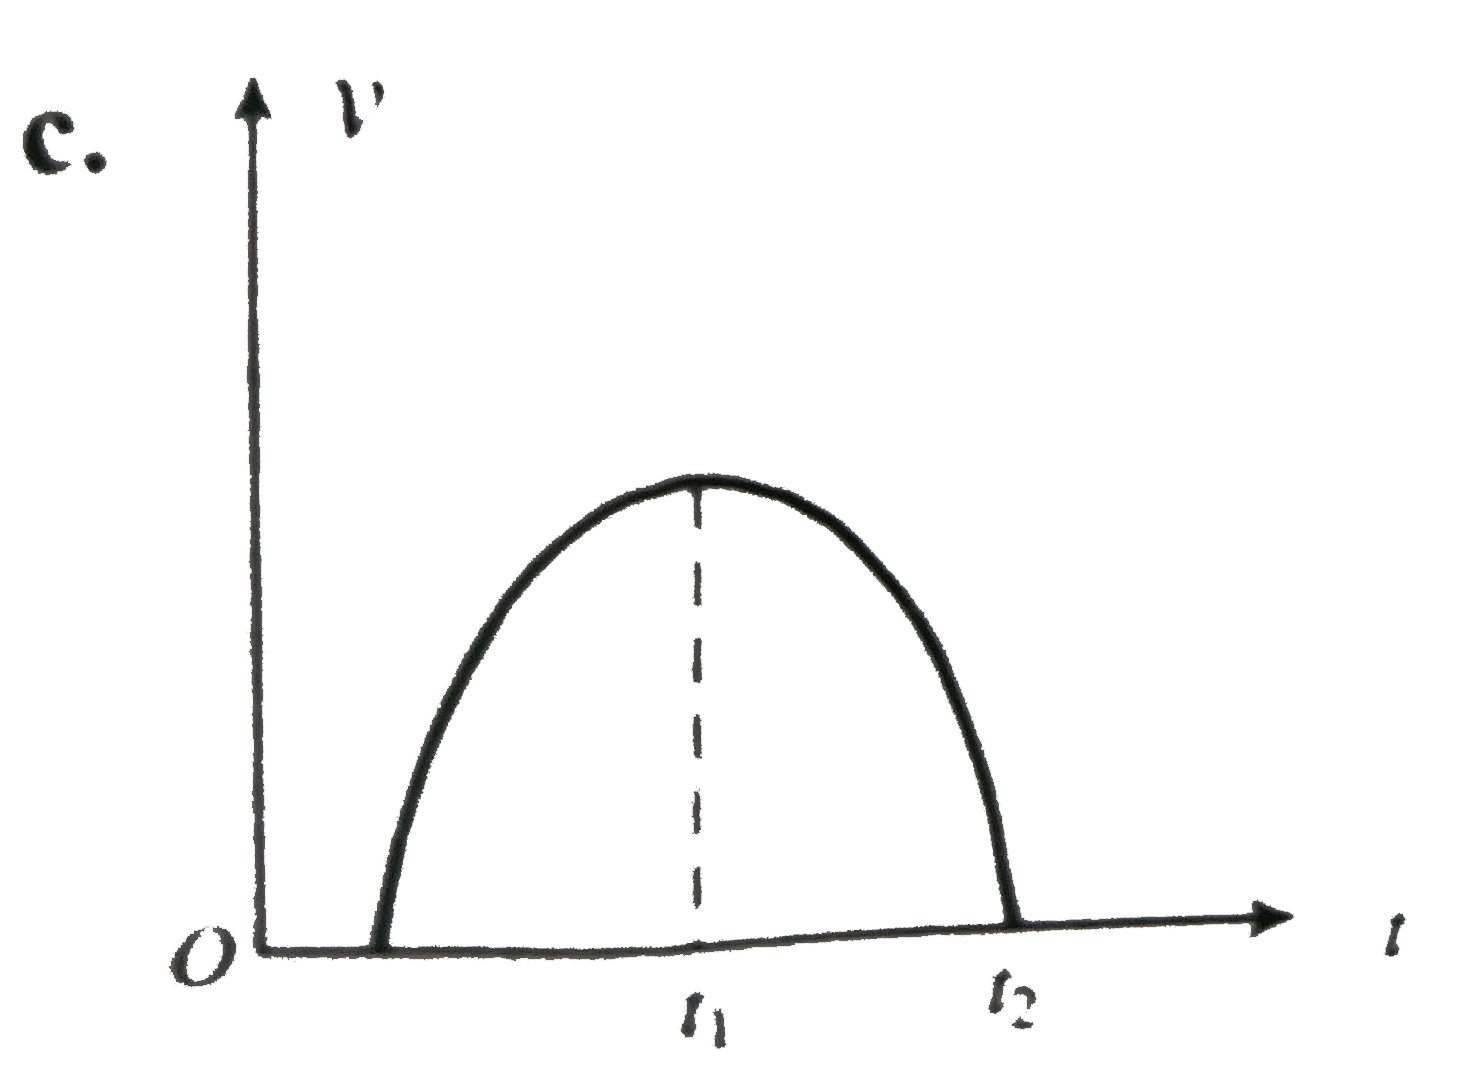 .D
.D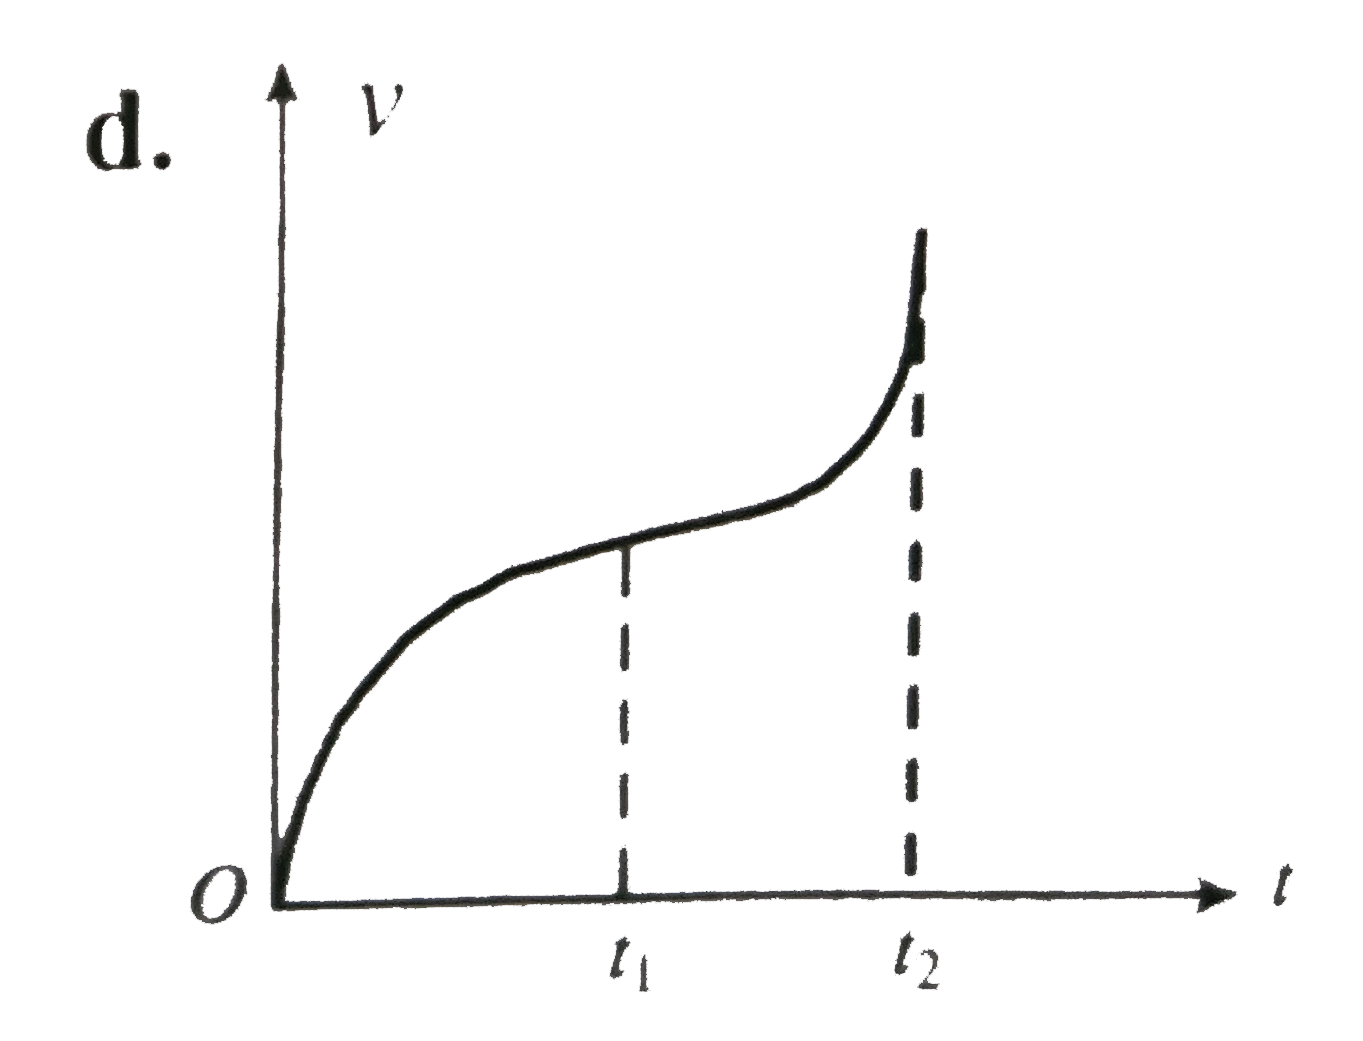 .
.
A particle starts from rest at the origin and moves along the positive x direction. Its acceleration a versus position x graph is shown in the figure. The velocity of the particle at x = 6 m is?
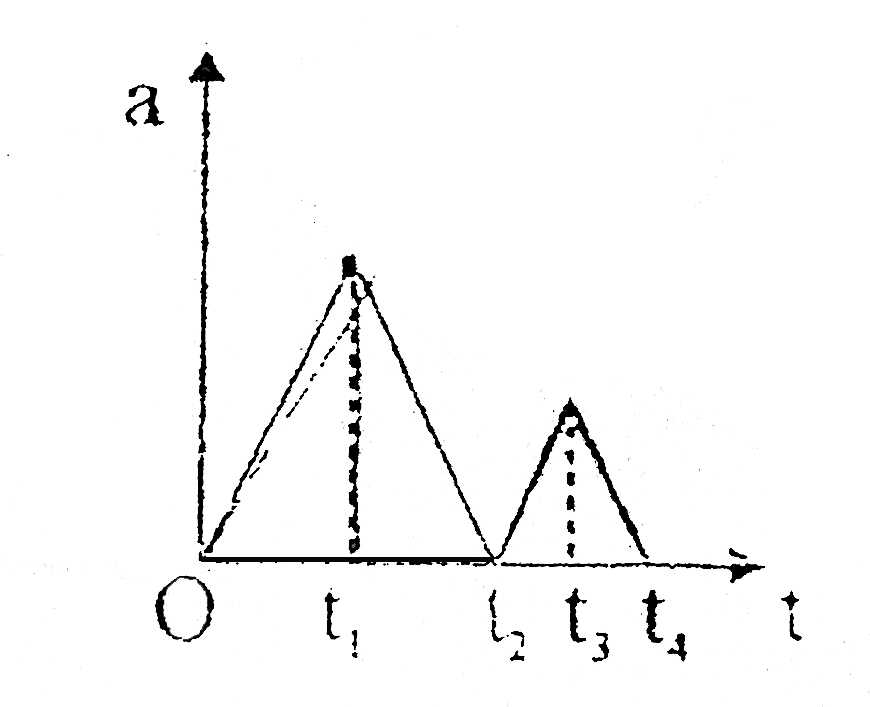
View SolutionA particle starts moving from rest in a from rest in a straight line. Its acceleration vs time (a−t) graph is shown in figure. The speed of particle is maximum at.
View SolutionA body starts from rest at time t=0 , the acceleration time graph is shown in the figure . The maximum velocity attained by the body will be
View SolutionA particle start from rest, with uniform acceleration at time t, choose the correct option
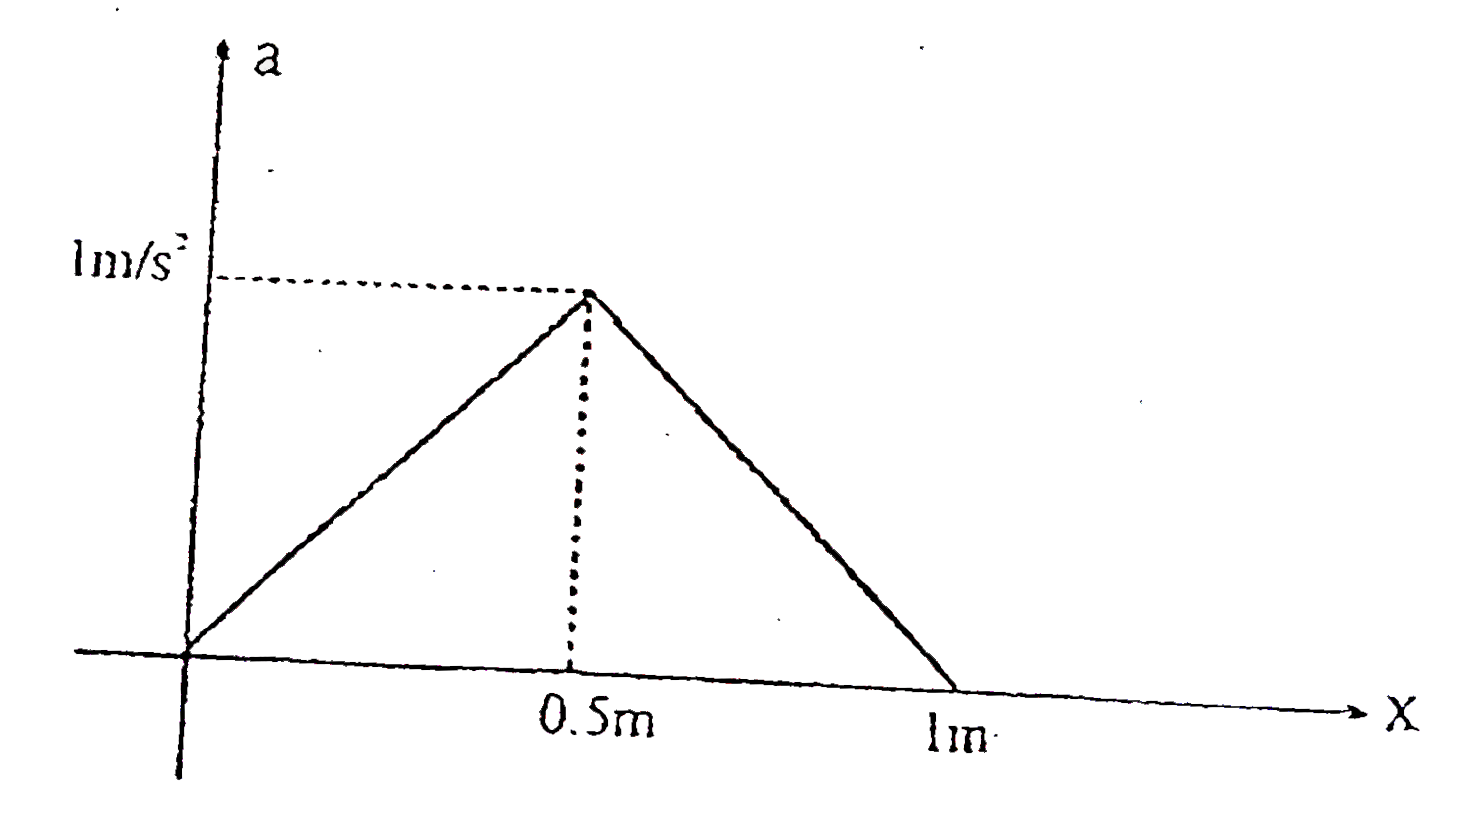
View SolutionA Body intially at rest, starts moving along x−axis in such a way so that its acceleration vs displacement plot is as shown in figure. The maximum velocity of particle is :−
View Solution

