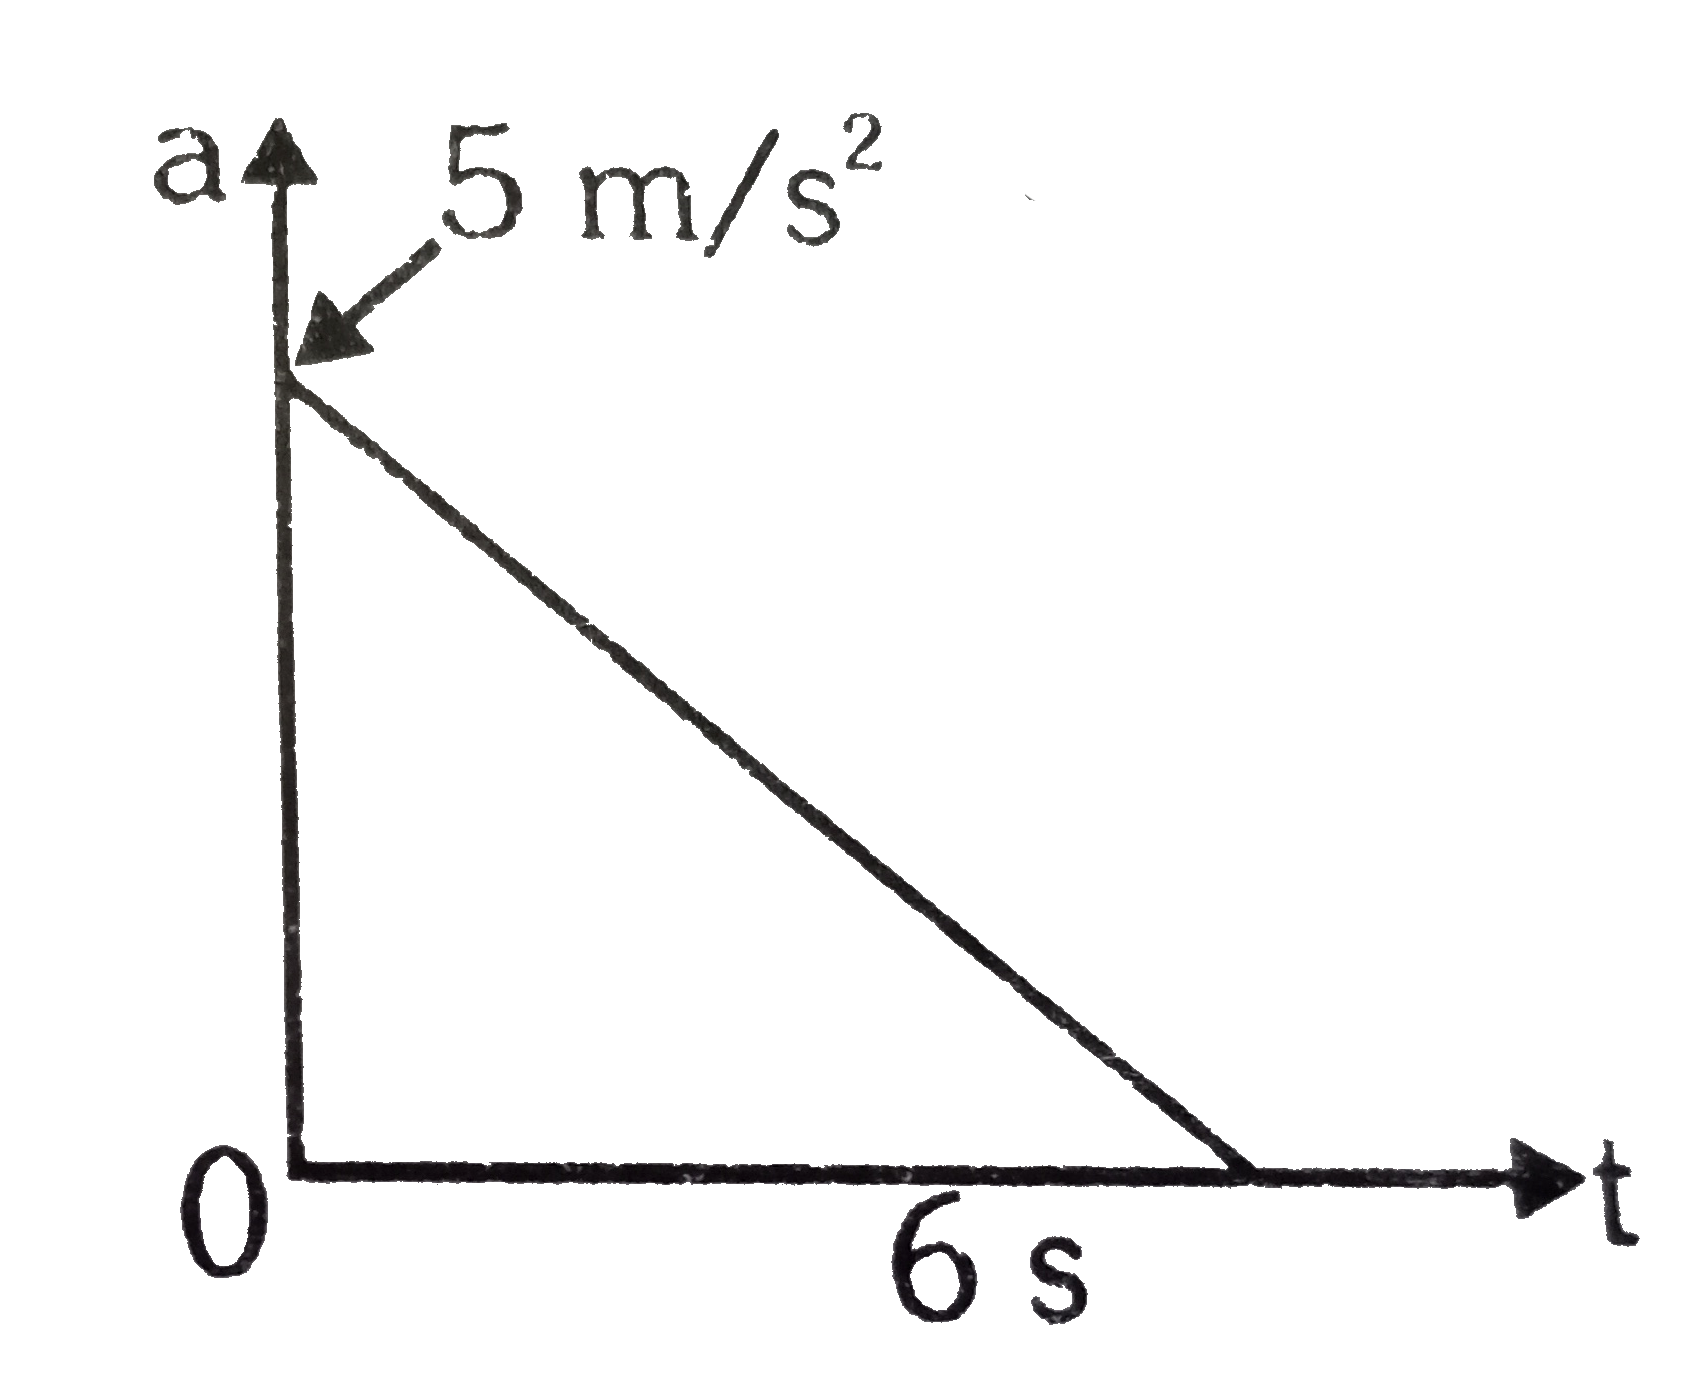
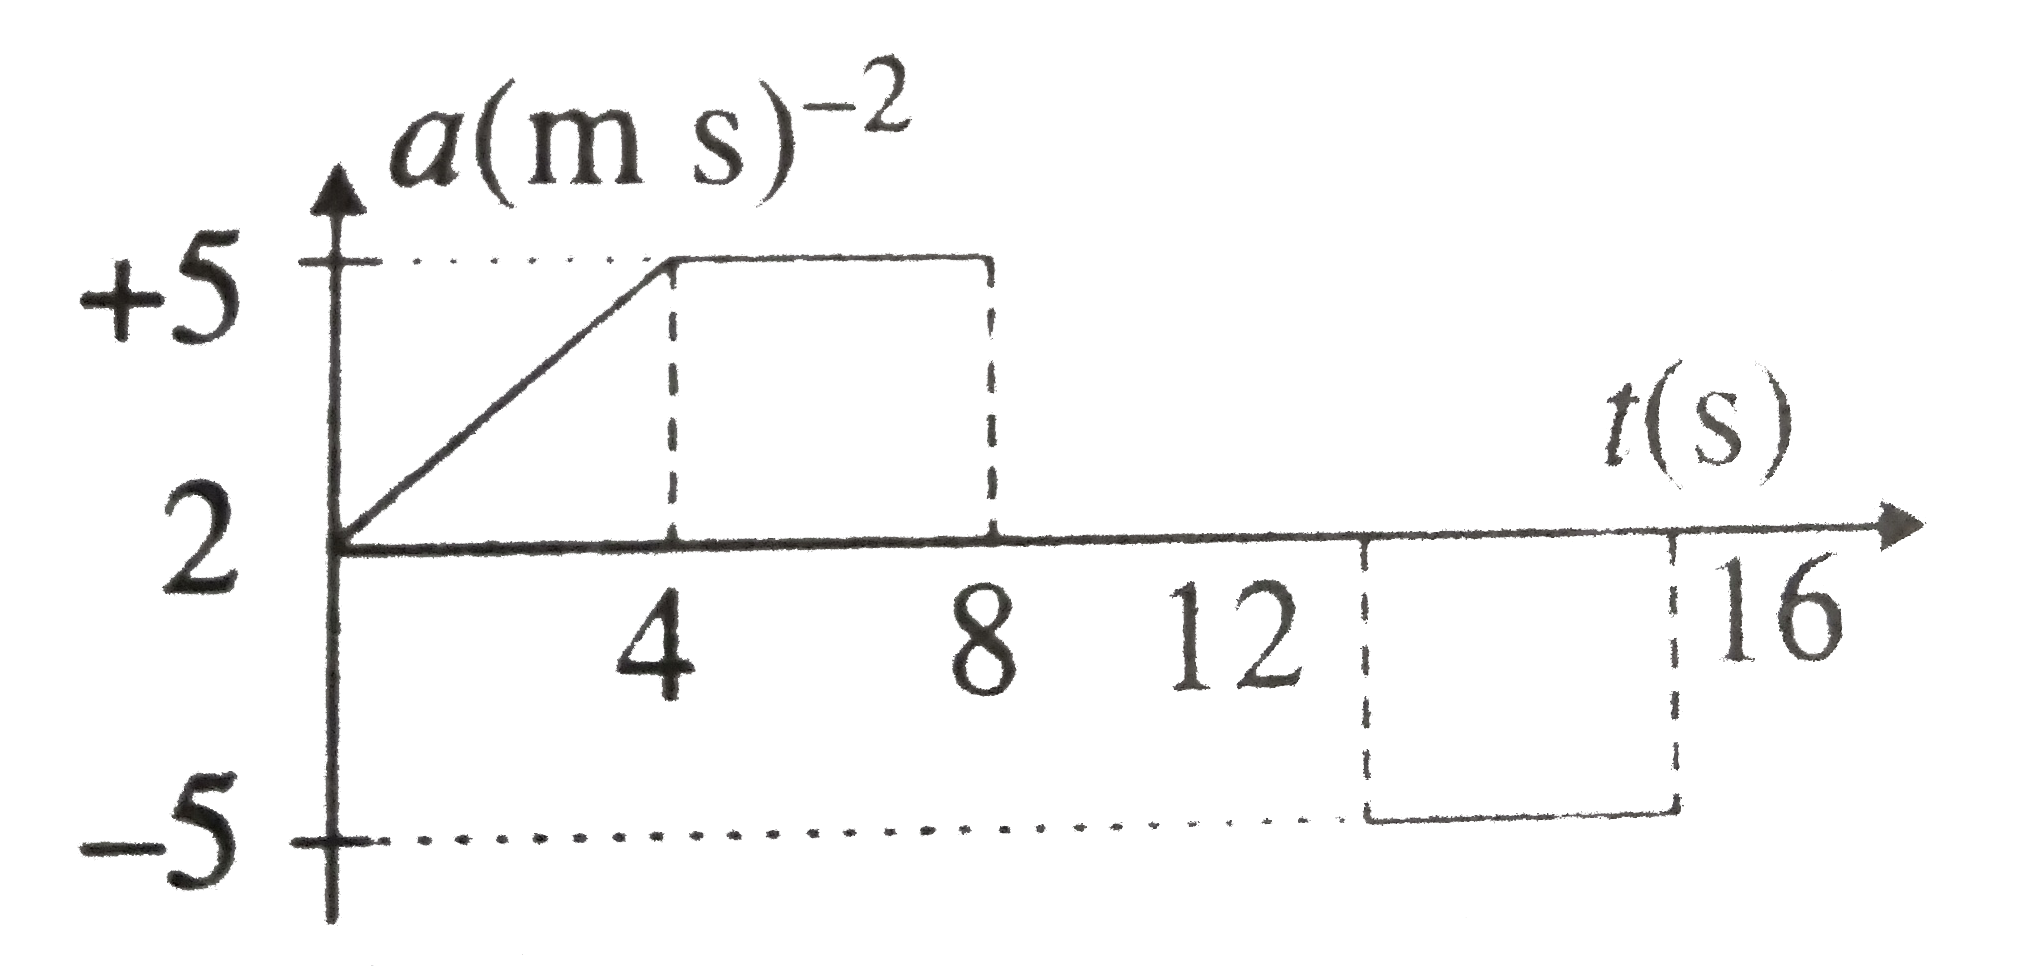
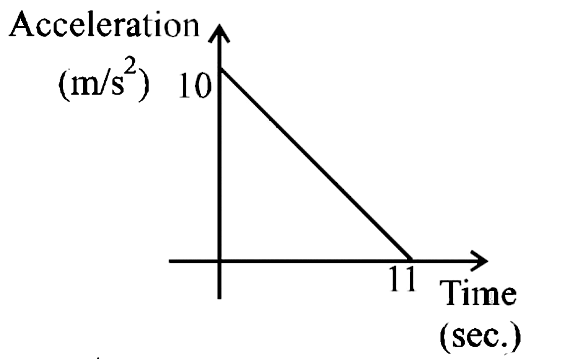
A particle starts from rest. Its acceleration at time t=0 is 5m/s2 which varies with time as shown in the figure. The maximum speed of the particle will be
7.5m/s
15m/s
30m/s
37.5 m/s
The correct Answer is:B
Area under a-t graph gives the change in velocity during given time interval.
∴umax=12×5×6=15m/s
Since initial velocity=0
∴ Maximum speed of the particle =15m/s
Topper's Solved these Questions
- MOTION IN A PALNEBOOK - ALLENCHAPTER - MOTION IN A PALNEEXERCISE - EXERCISE-2
170 Videos
- MOTION IN A PALNEBOOK - ALLENCHAPTER - MOTION IN A PALNEEXERCISE - EXERCISE-3
41 Videos
- MOTION IN A PALNEBOOK - ALLENCHAPTER - MOTION IN A PALNEEXERCISE - SOLVED EXAMPLE
28 Videos
- KINEMATICS-2DBOOK - ALLENCHAPTER - KINEMATICS-2DEXERCISE - Exercise (O-2)
48 Videos
- NEWTON'S LAWS OF MOTION & FRICTIONBOOK - ALLENCHAPTER - NEWTON'S LAWS OF MOTION & FRICTIONEXERCISE - EXERCISE (JA)
4 Videos
Similar Questions
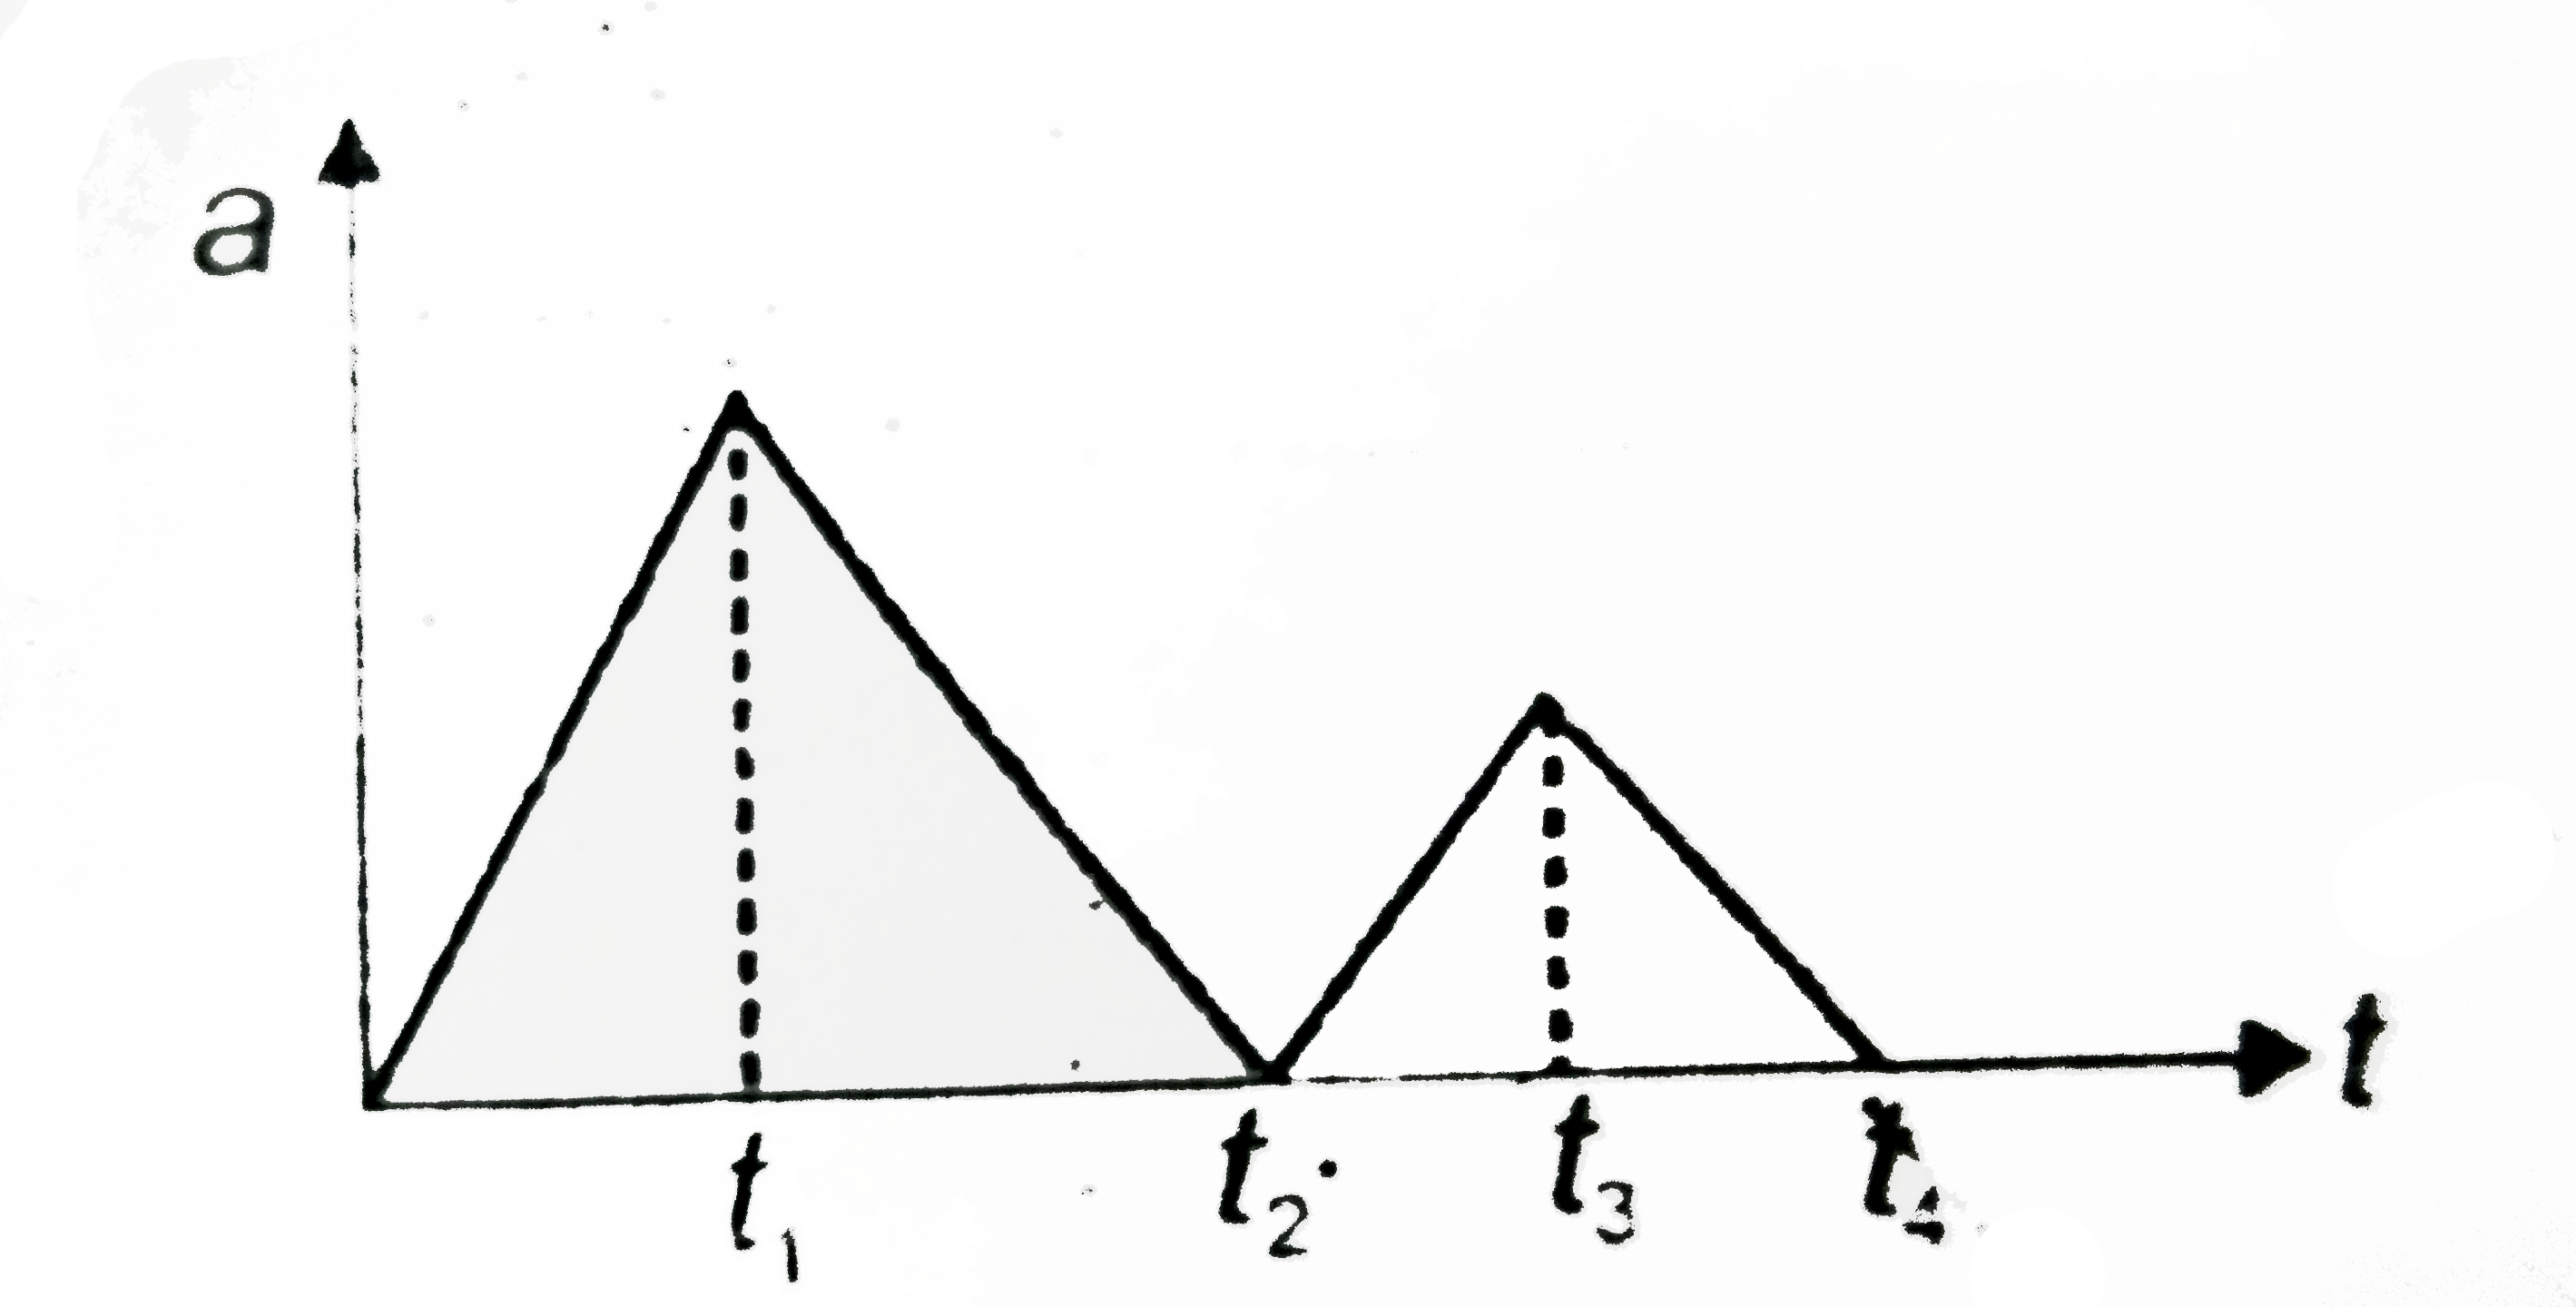
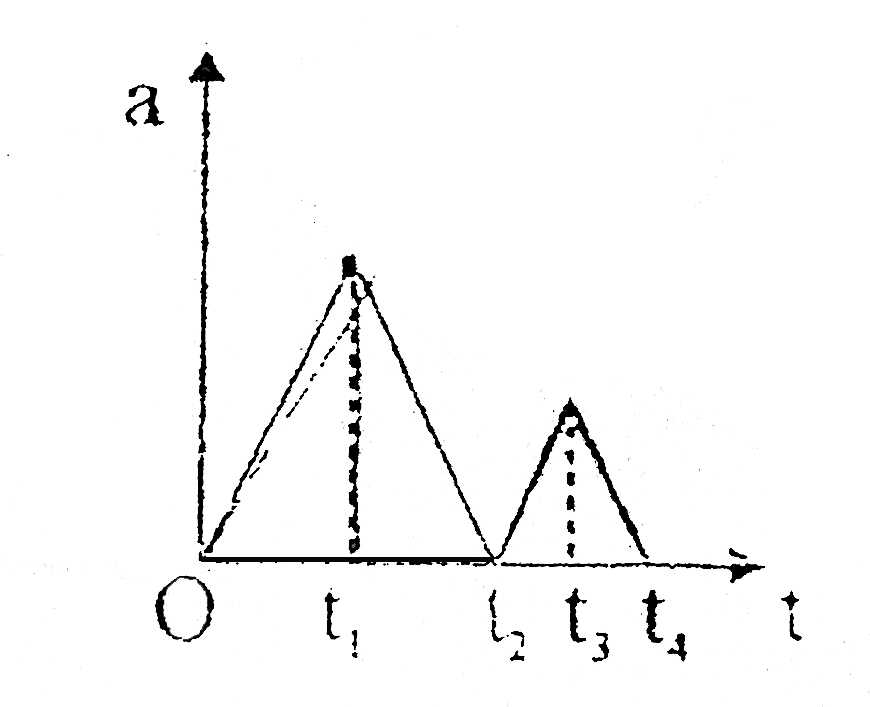
A particle starts moving from rest on a straight line. Its acceleration a verses time t is shown in the figure. The speed of the particle is maximum at the instant
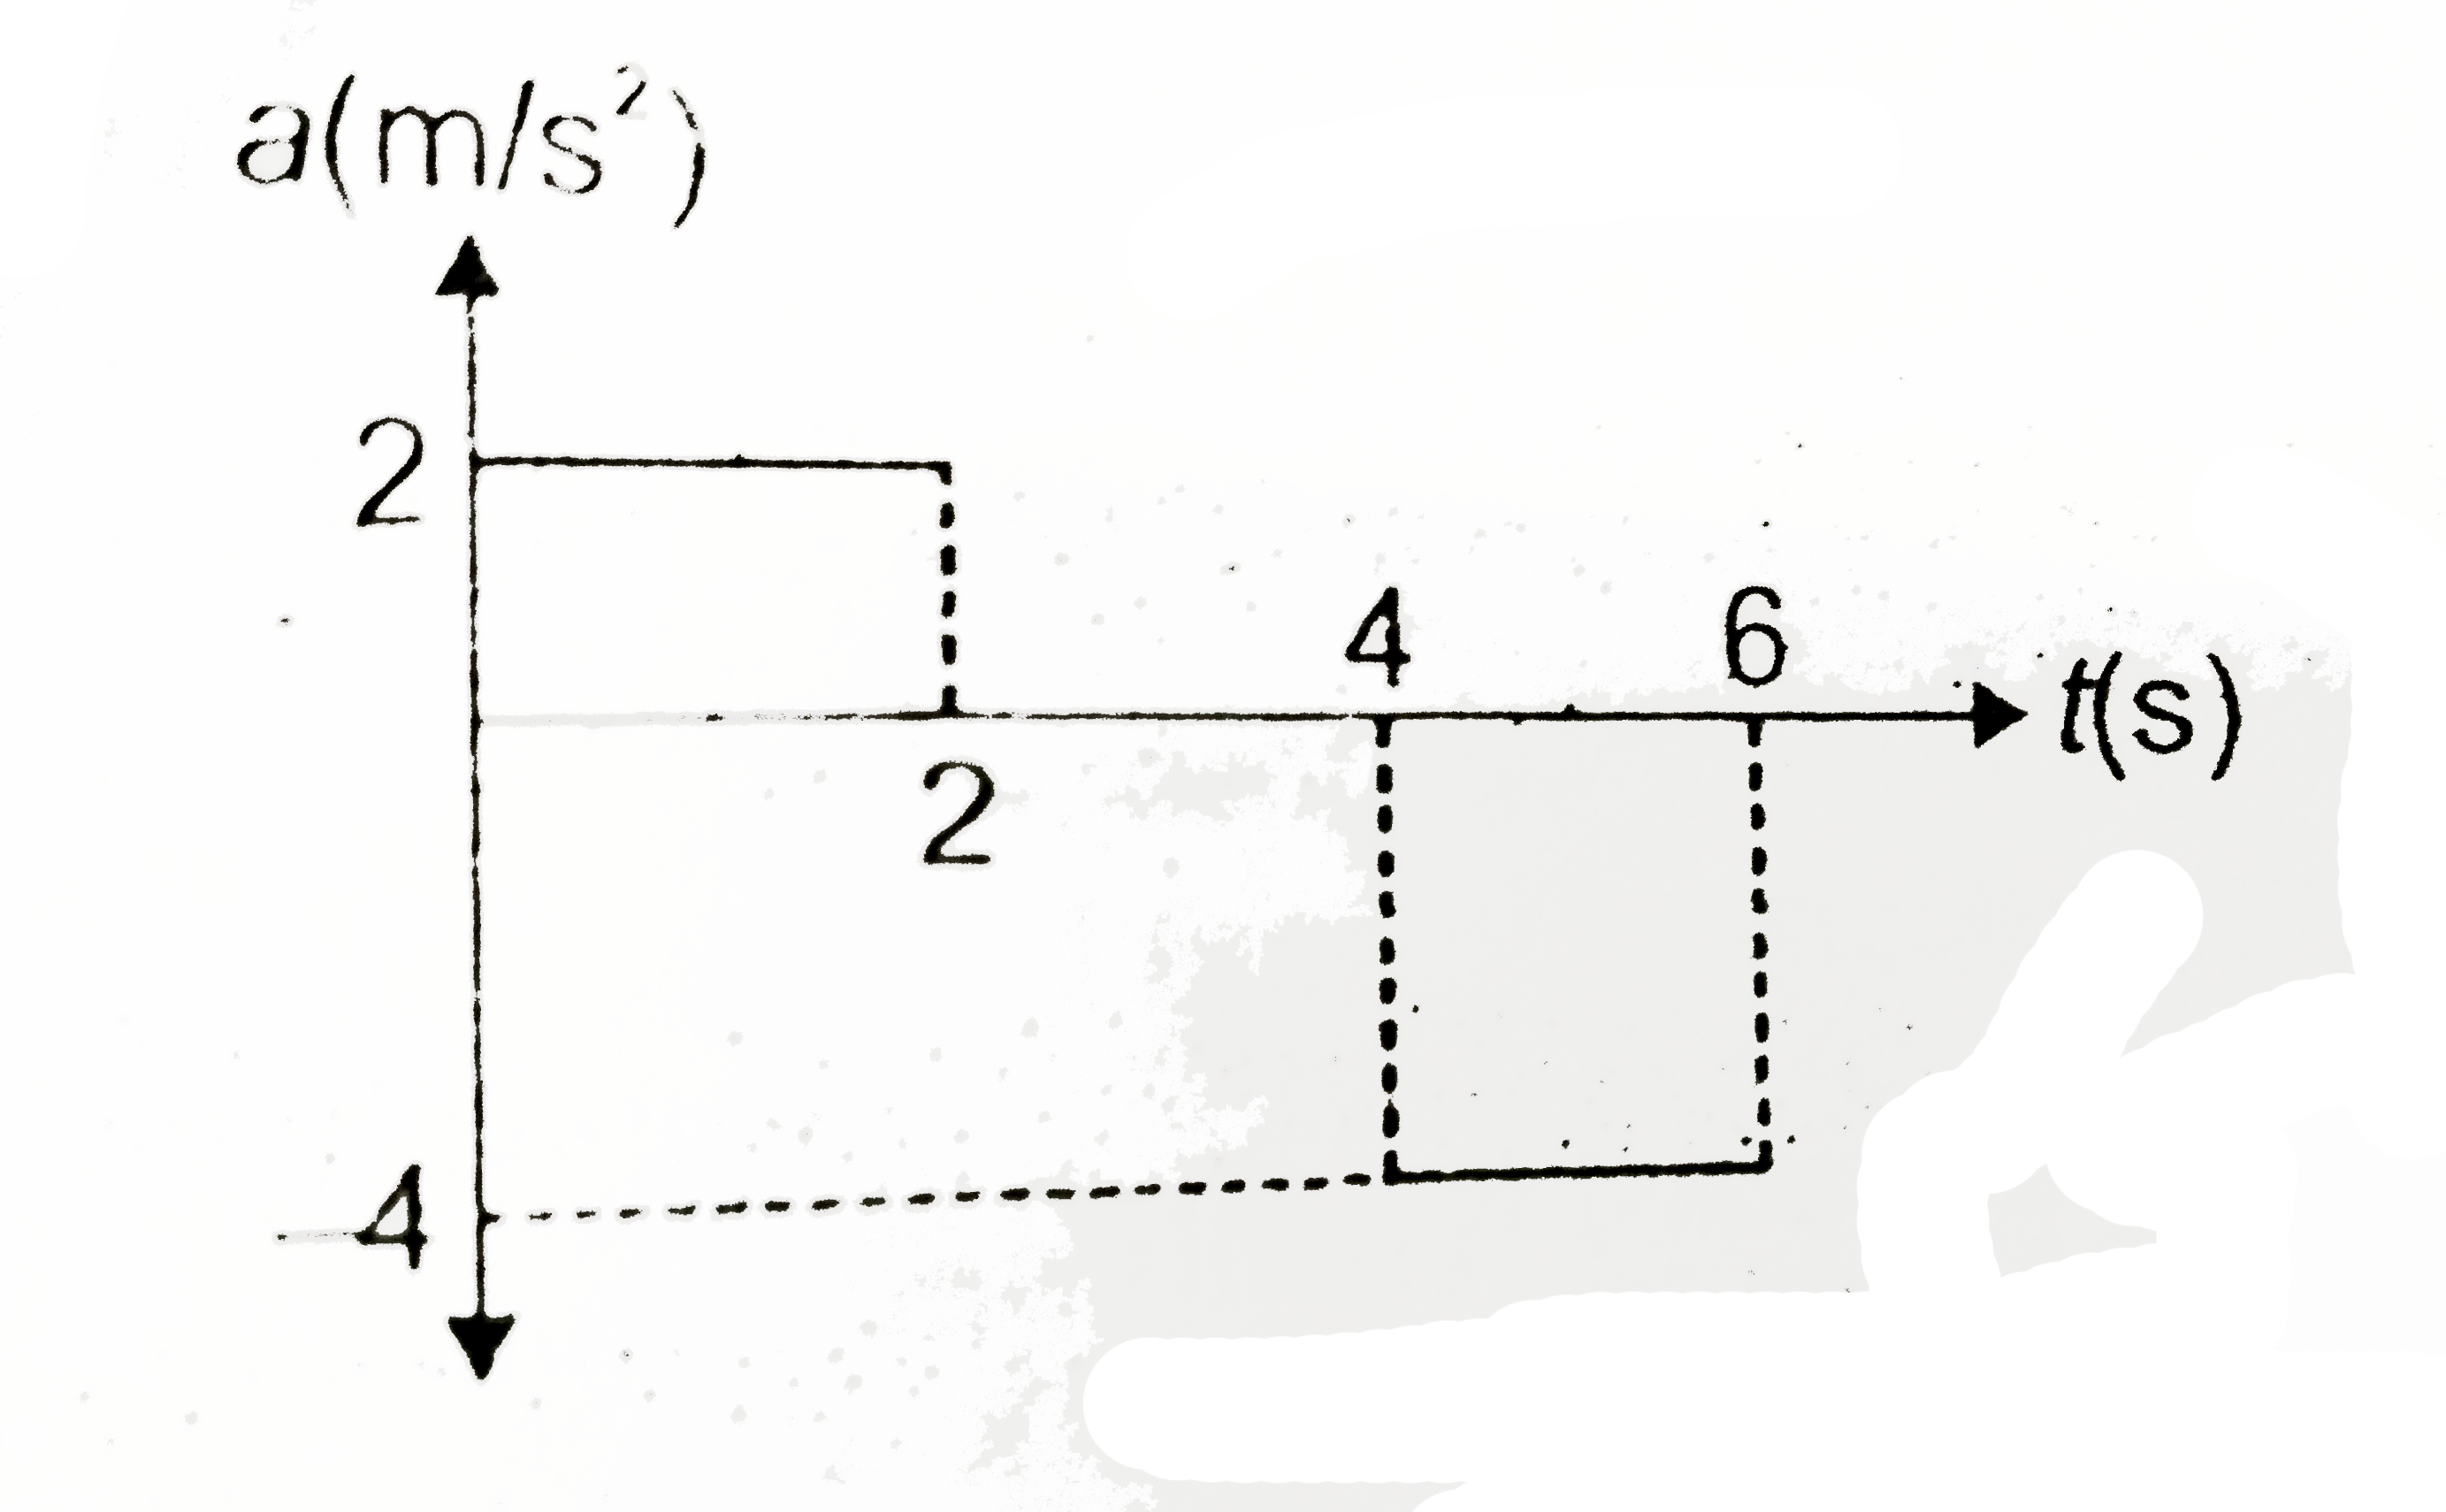
View SolutionA particle starts from rest. Its acceleration is varying with time as shown in the figure. When the particle comes to rest, its distance from its starting point is
View Solution
Knowledge Check
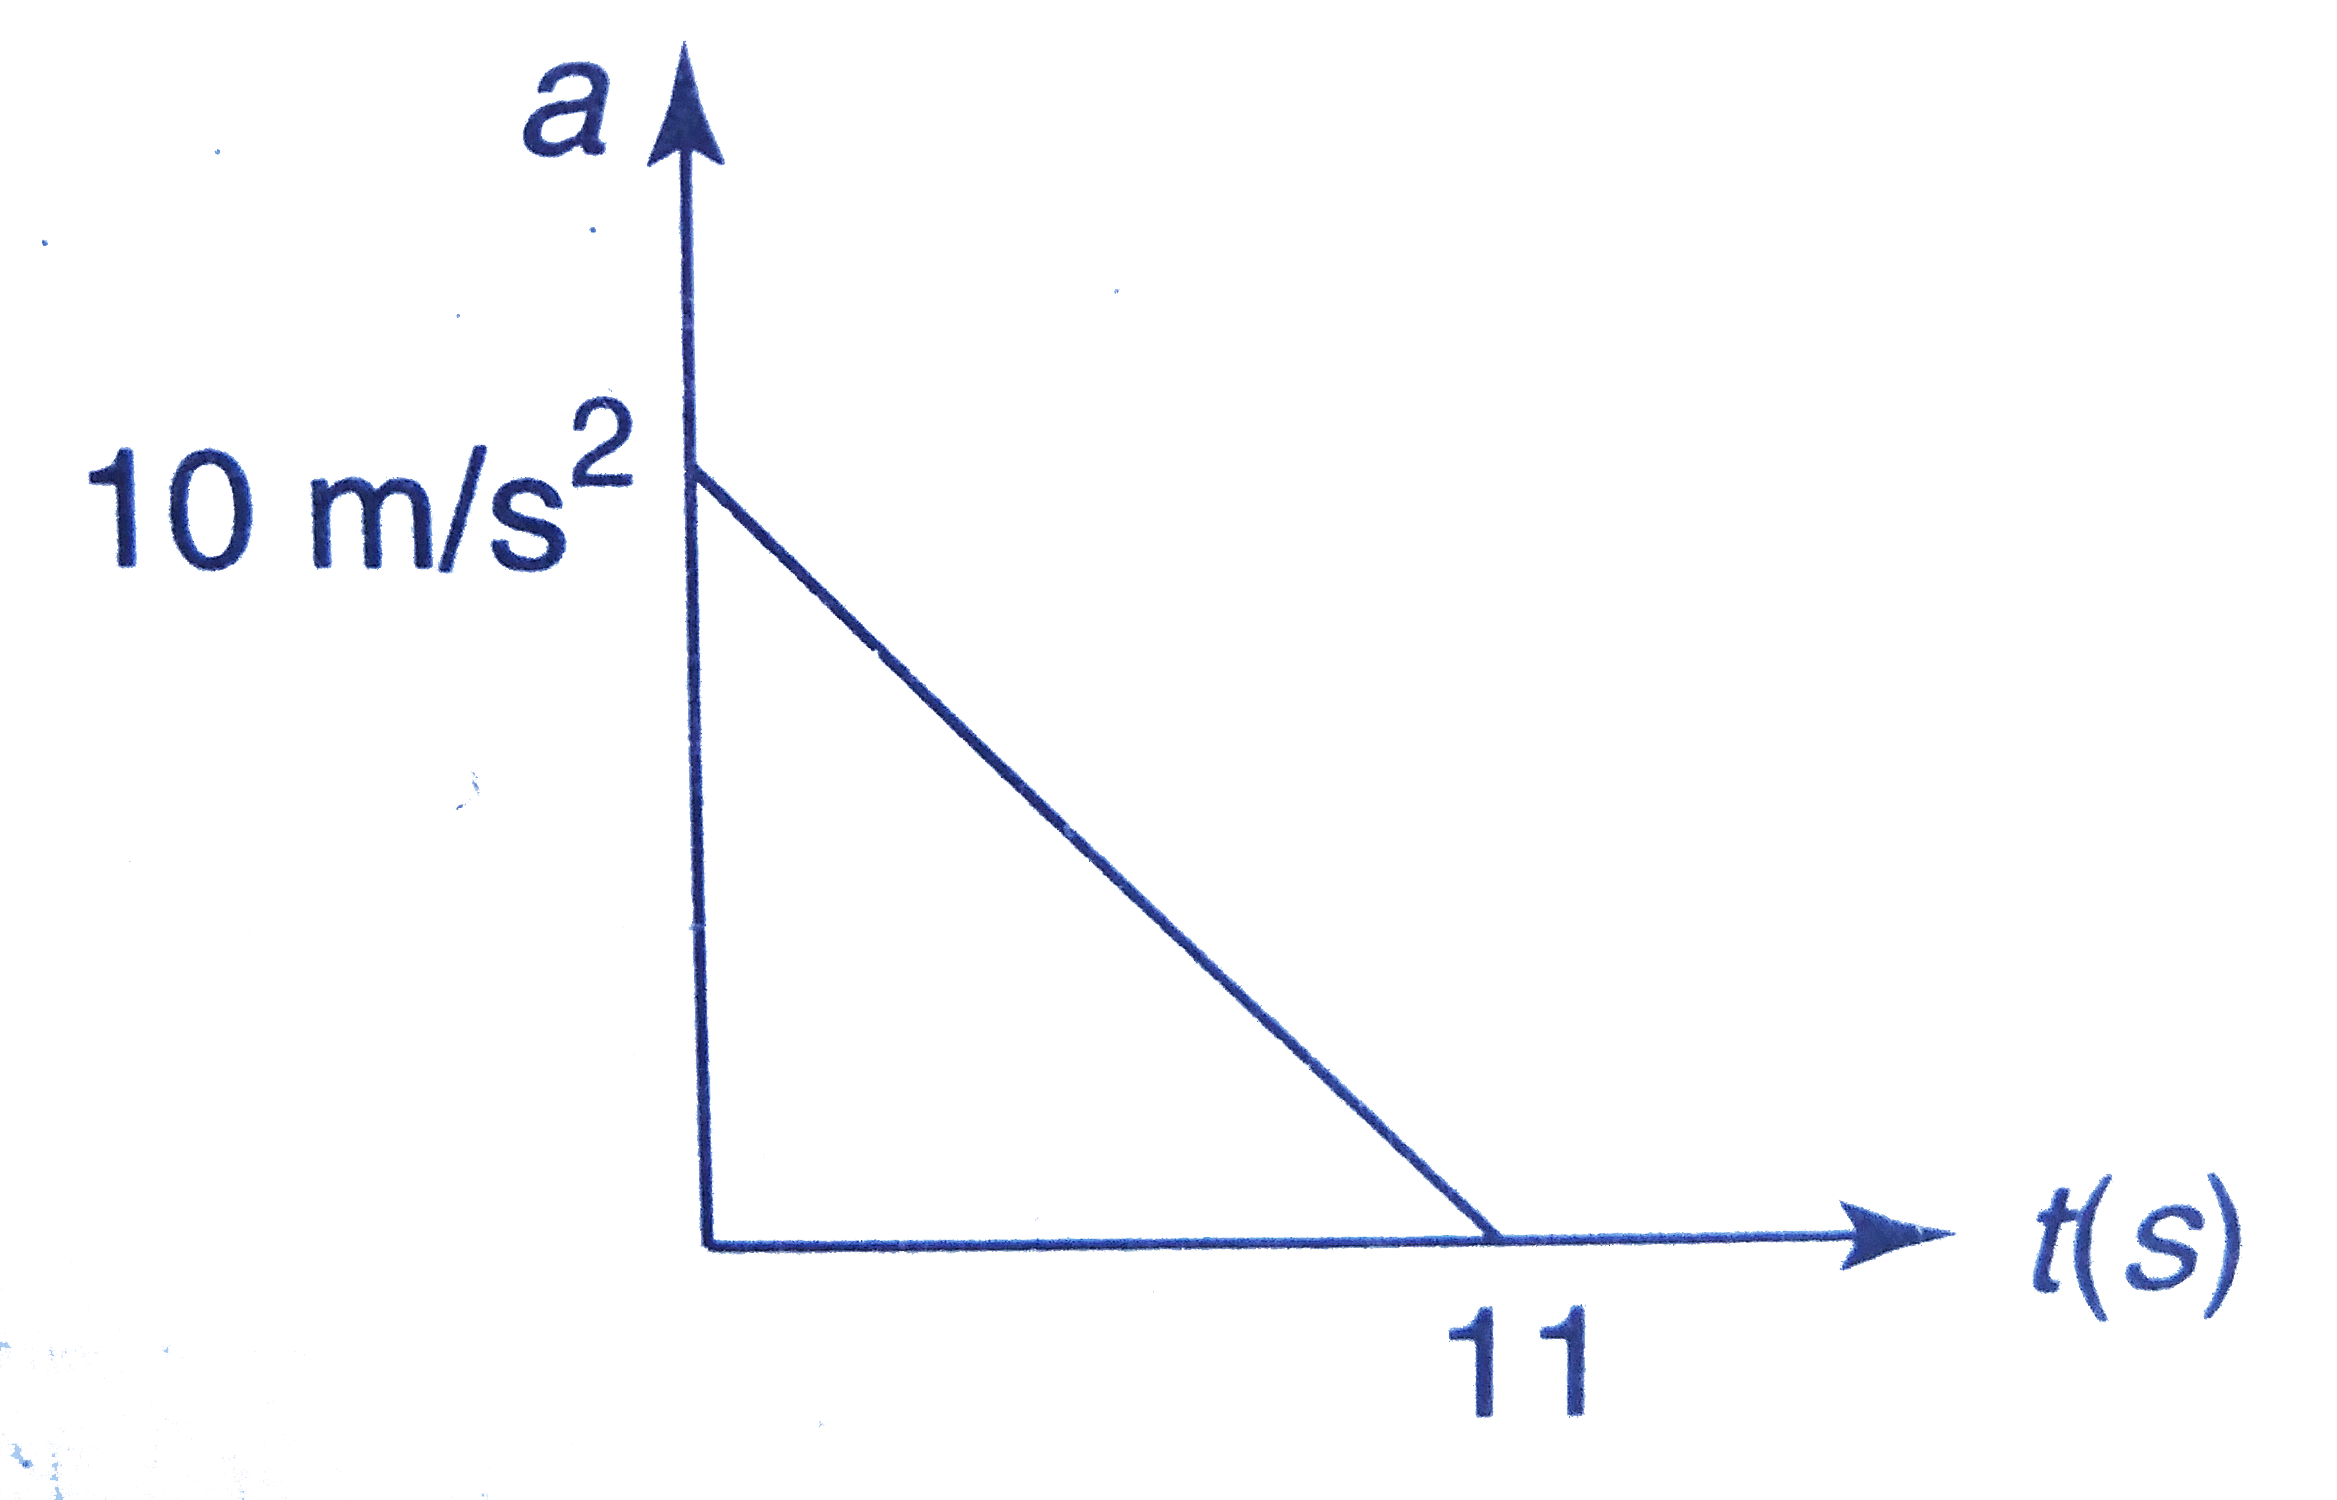
A particle starting from rest. Its acceleration (a) versus time (t) is as shown in the figure.
The maximum speed of the particle will be.
 A110m/sB55m/sC550m/sD660m/s
A particle starts from rest and moves with acceleration a which varies with time t as a=kt where k is a costant. The displacement s of the particle at time t is
A12kt2B12at2C16at2DNoneThe acceleration of a particle starting from rest and travelling along a straight line is shown in figure. The maximum speed of the particle is
 A20ms−1B30ms−1C40ms−1D60ms−1
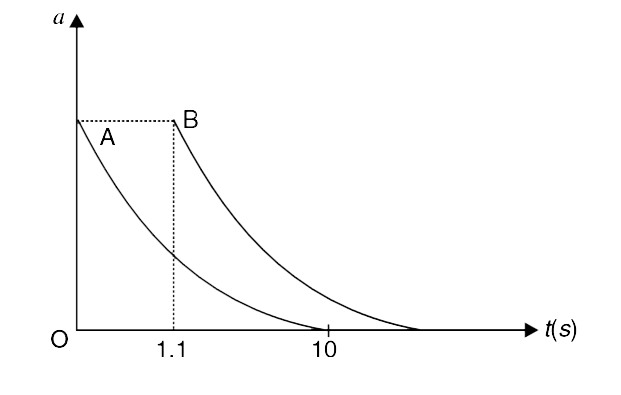
Particle A starts from rest and moves along a straight line. Acceleration of the particle varies with time as shown in the graph. In 10 s the velocity of the particle becomes 60m/s and the acceleration drops to zero. Another particle B starts from the same location at time t=1.1s and has acceleration – time relationship identical to A with a delay of 1.1s. Find distance between the particles at time t=15s.
View SolutionA particle starts moving from rest in a from rest in a straight line. Its acceleration vs time (a−t) graph is shown in figure. The speed of particle is maximum at.
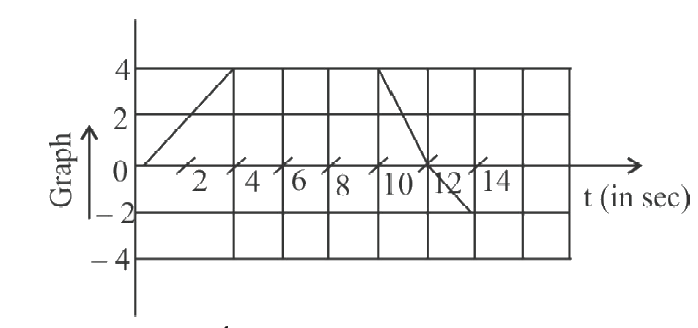
View SolutionA graph of acceleration versus time of a particle starting from rest at t=0 is as shown in figure. The speed of the particle at t=14s is
View SolutionA particle starts from rest with a time varying acceleration a=(2t−4). Here t is in second and a in m/s2
The velocity time graph of the particle is
View SolutionA body starts from rest at time t=0 , the acceleration time graph is shown in the figure . The maximum velocity attained by the body will be
View Solution
