The acceleration versus time graph of a particle moving along a straight line is shown in the figure. Draw the respective velocity-time graph Given v=0 at t=0.
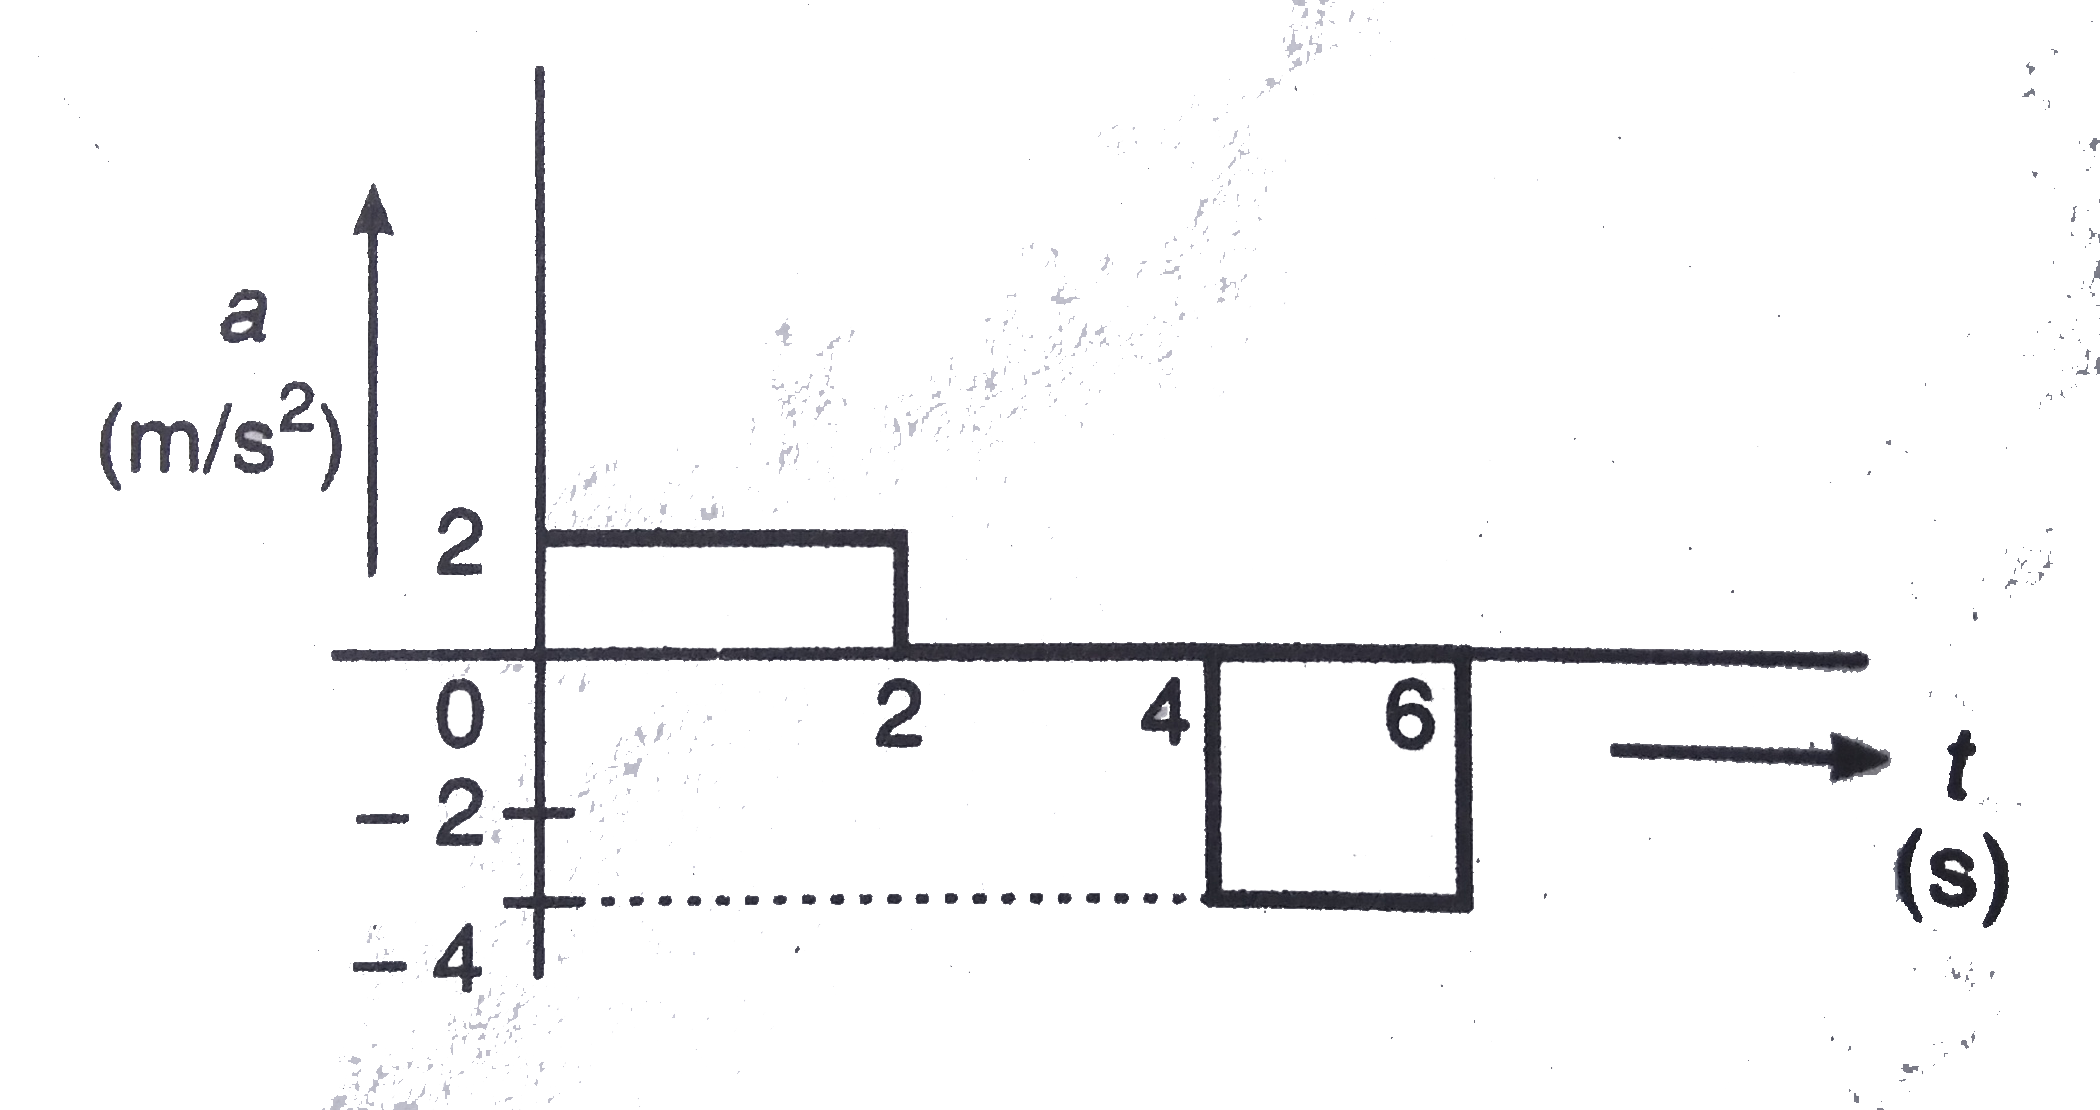
Area of acceleration -time graph = change in velocity
For 0≤t≤2, area of (a−t) graph =2×2=4m/s
For 2≤t≤4, area of (a−t) graph =0
For 4≤t≤6, area of (a−t) graph =(−4)×2=−8m/s
So, velocity -time graph will be as shown
Velocity after 2s⇒v2=v0+ change in velocity in 2 s =1+4=5m/s
Velocity after 4 s
⇒v4=v2+ change in velocity from t=2s to t=4s=5+0=5m/s
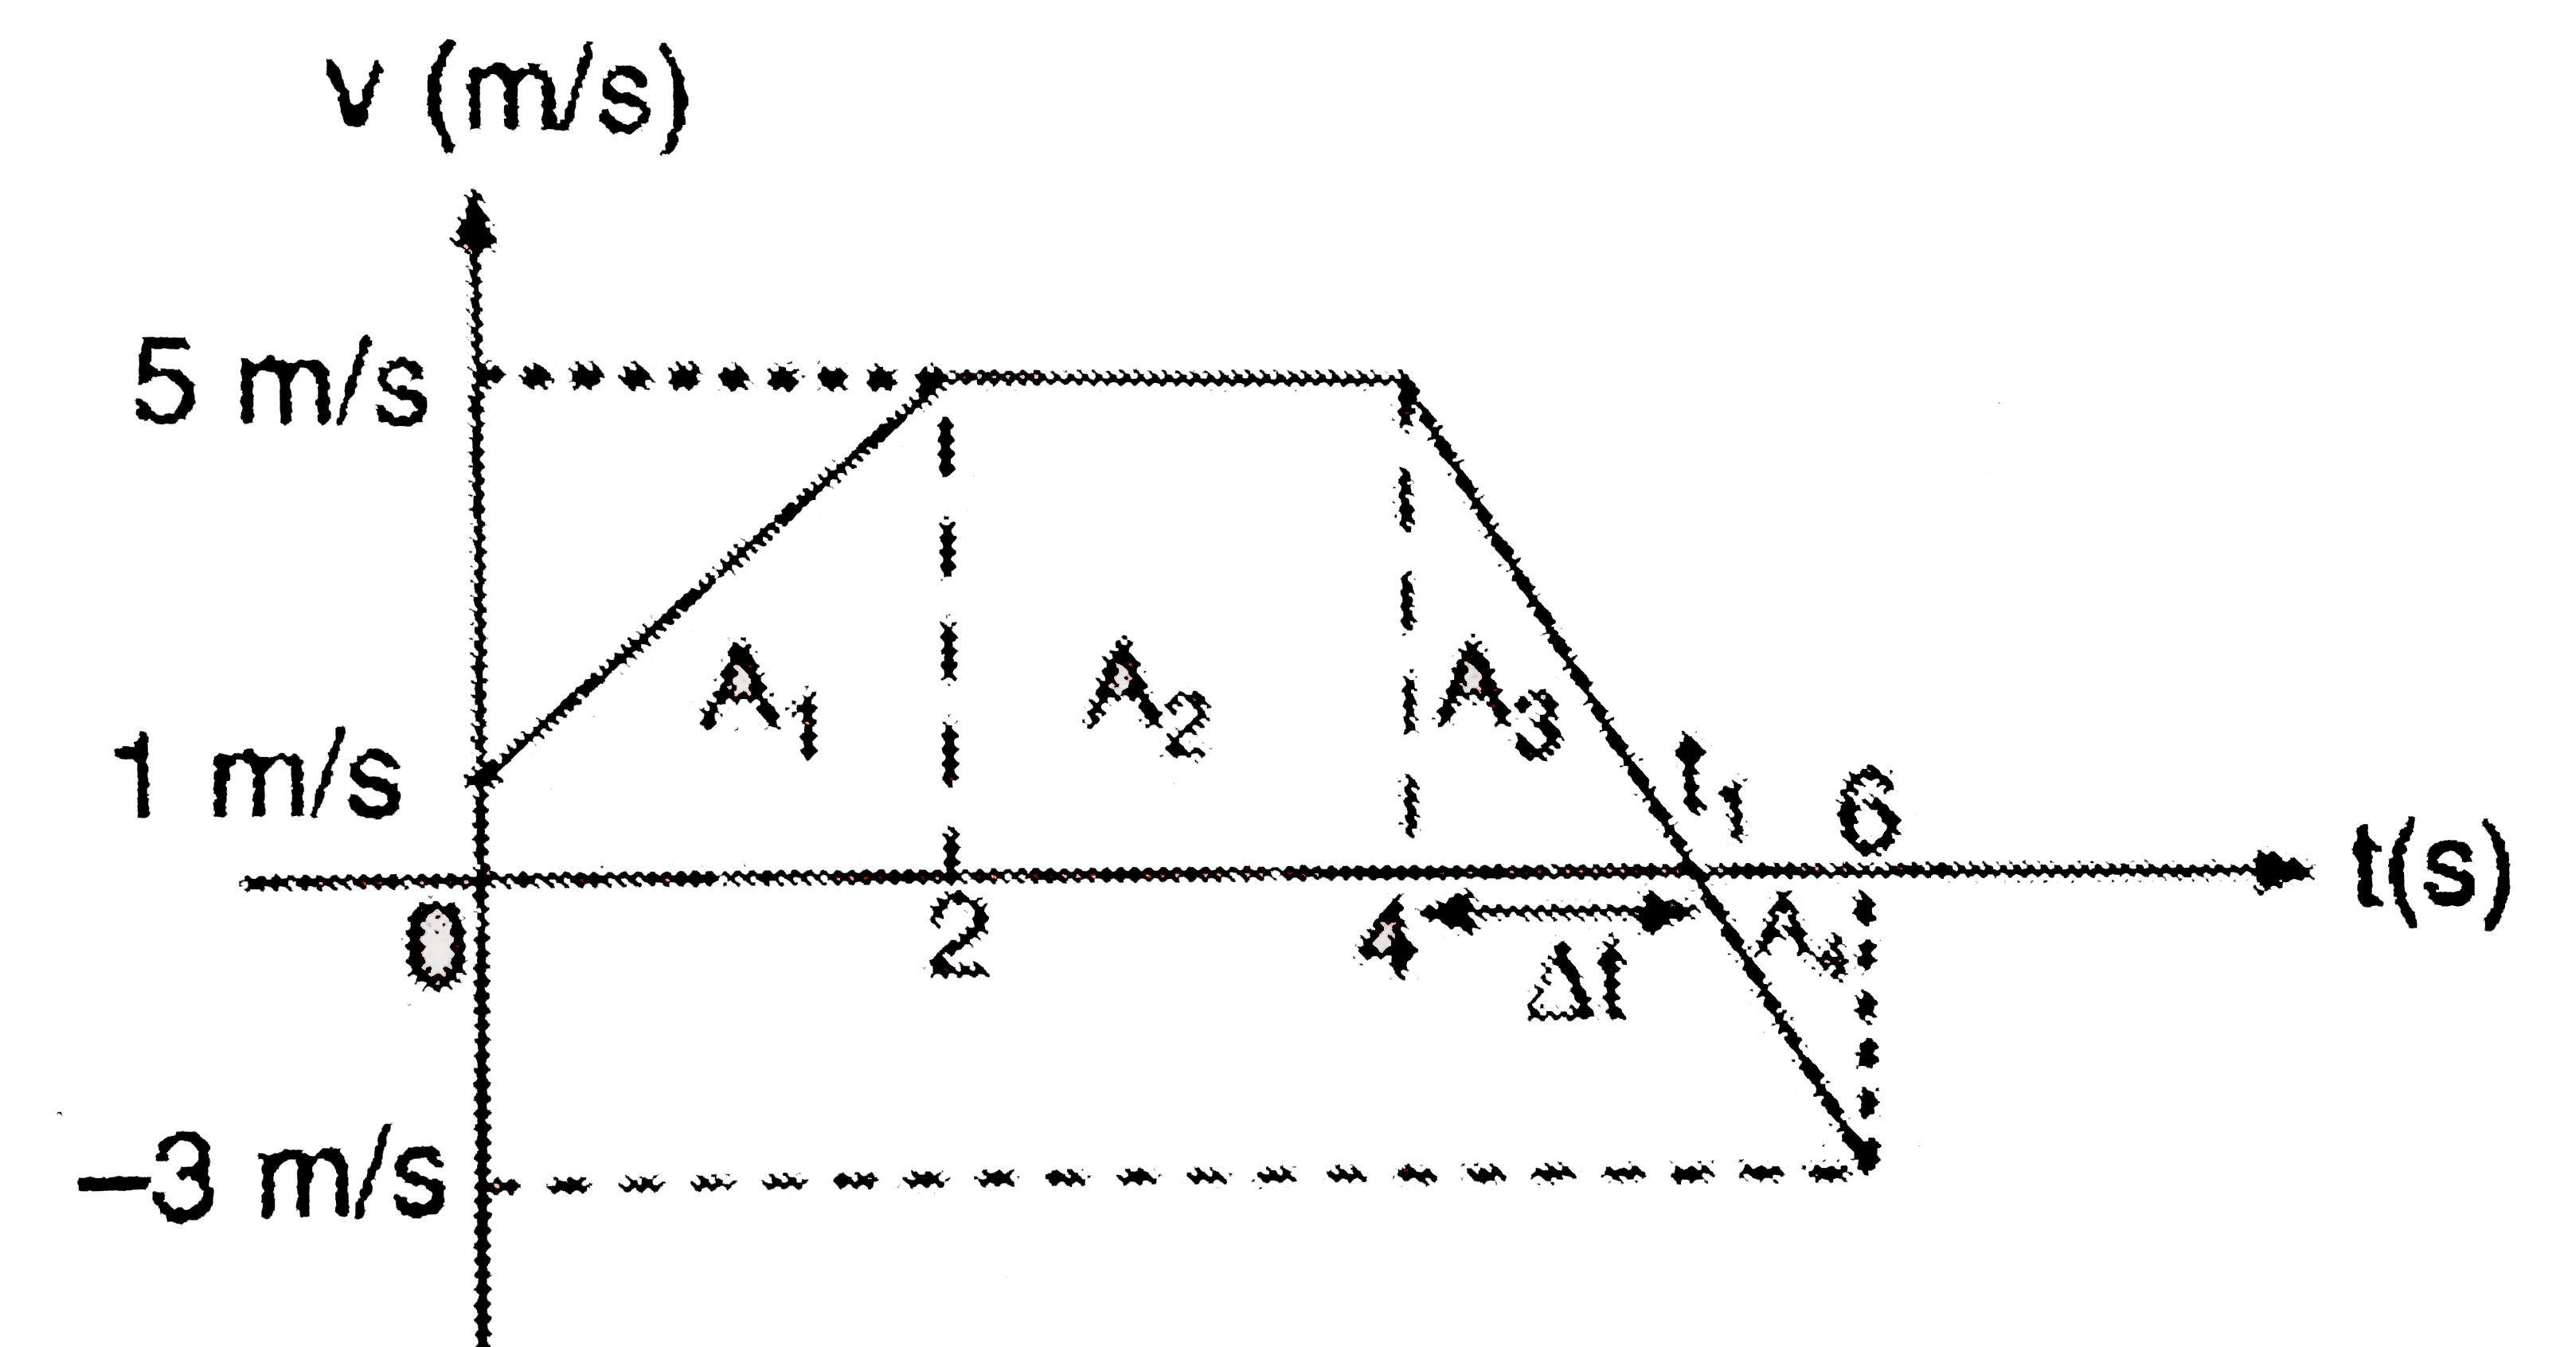
Velocity after 6s⇒v6=v4+ change in velocity from t=4s to t=6s
=5−8=−3m/s
Area of velocity -time graph = change in position
= displacement
∴ For 0<t<2s, area of (v−t) graph =12×(5+1)×2=6m
2<t<4s, area of (v−t) graph =5×2=10m
4<t<6s, area of (v−t) graph =A3+A4
To find A3 and A4 we must find t1 the time when velocity becomes zero from 5m/s with an acceleration =−4m/s2
v=v0+at
0=5−4(Δt)
∴Δt=54=1.25s
∴t1=4+1.25=5.25s
∴A3=12×1.25×5=3.125m
A4=12×0.75×(−3)=−1.125m
Therefore area of v−t graph for 4≤t≤6s=A3+A4=2m
So, position after 2s,¯r2=r0+ change in position
=¯r0+Δ¯r
=1+6=7m
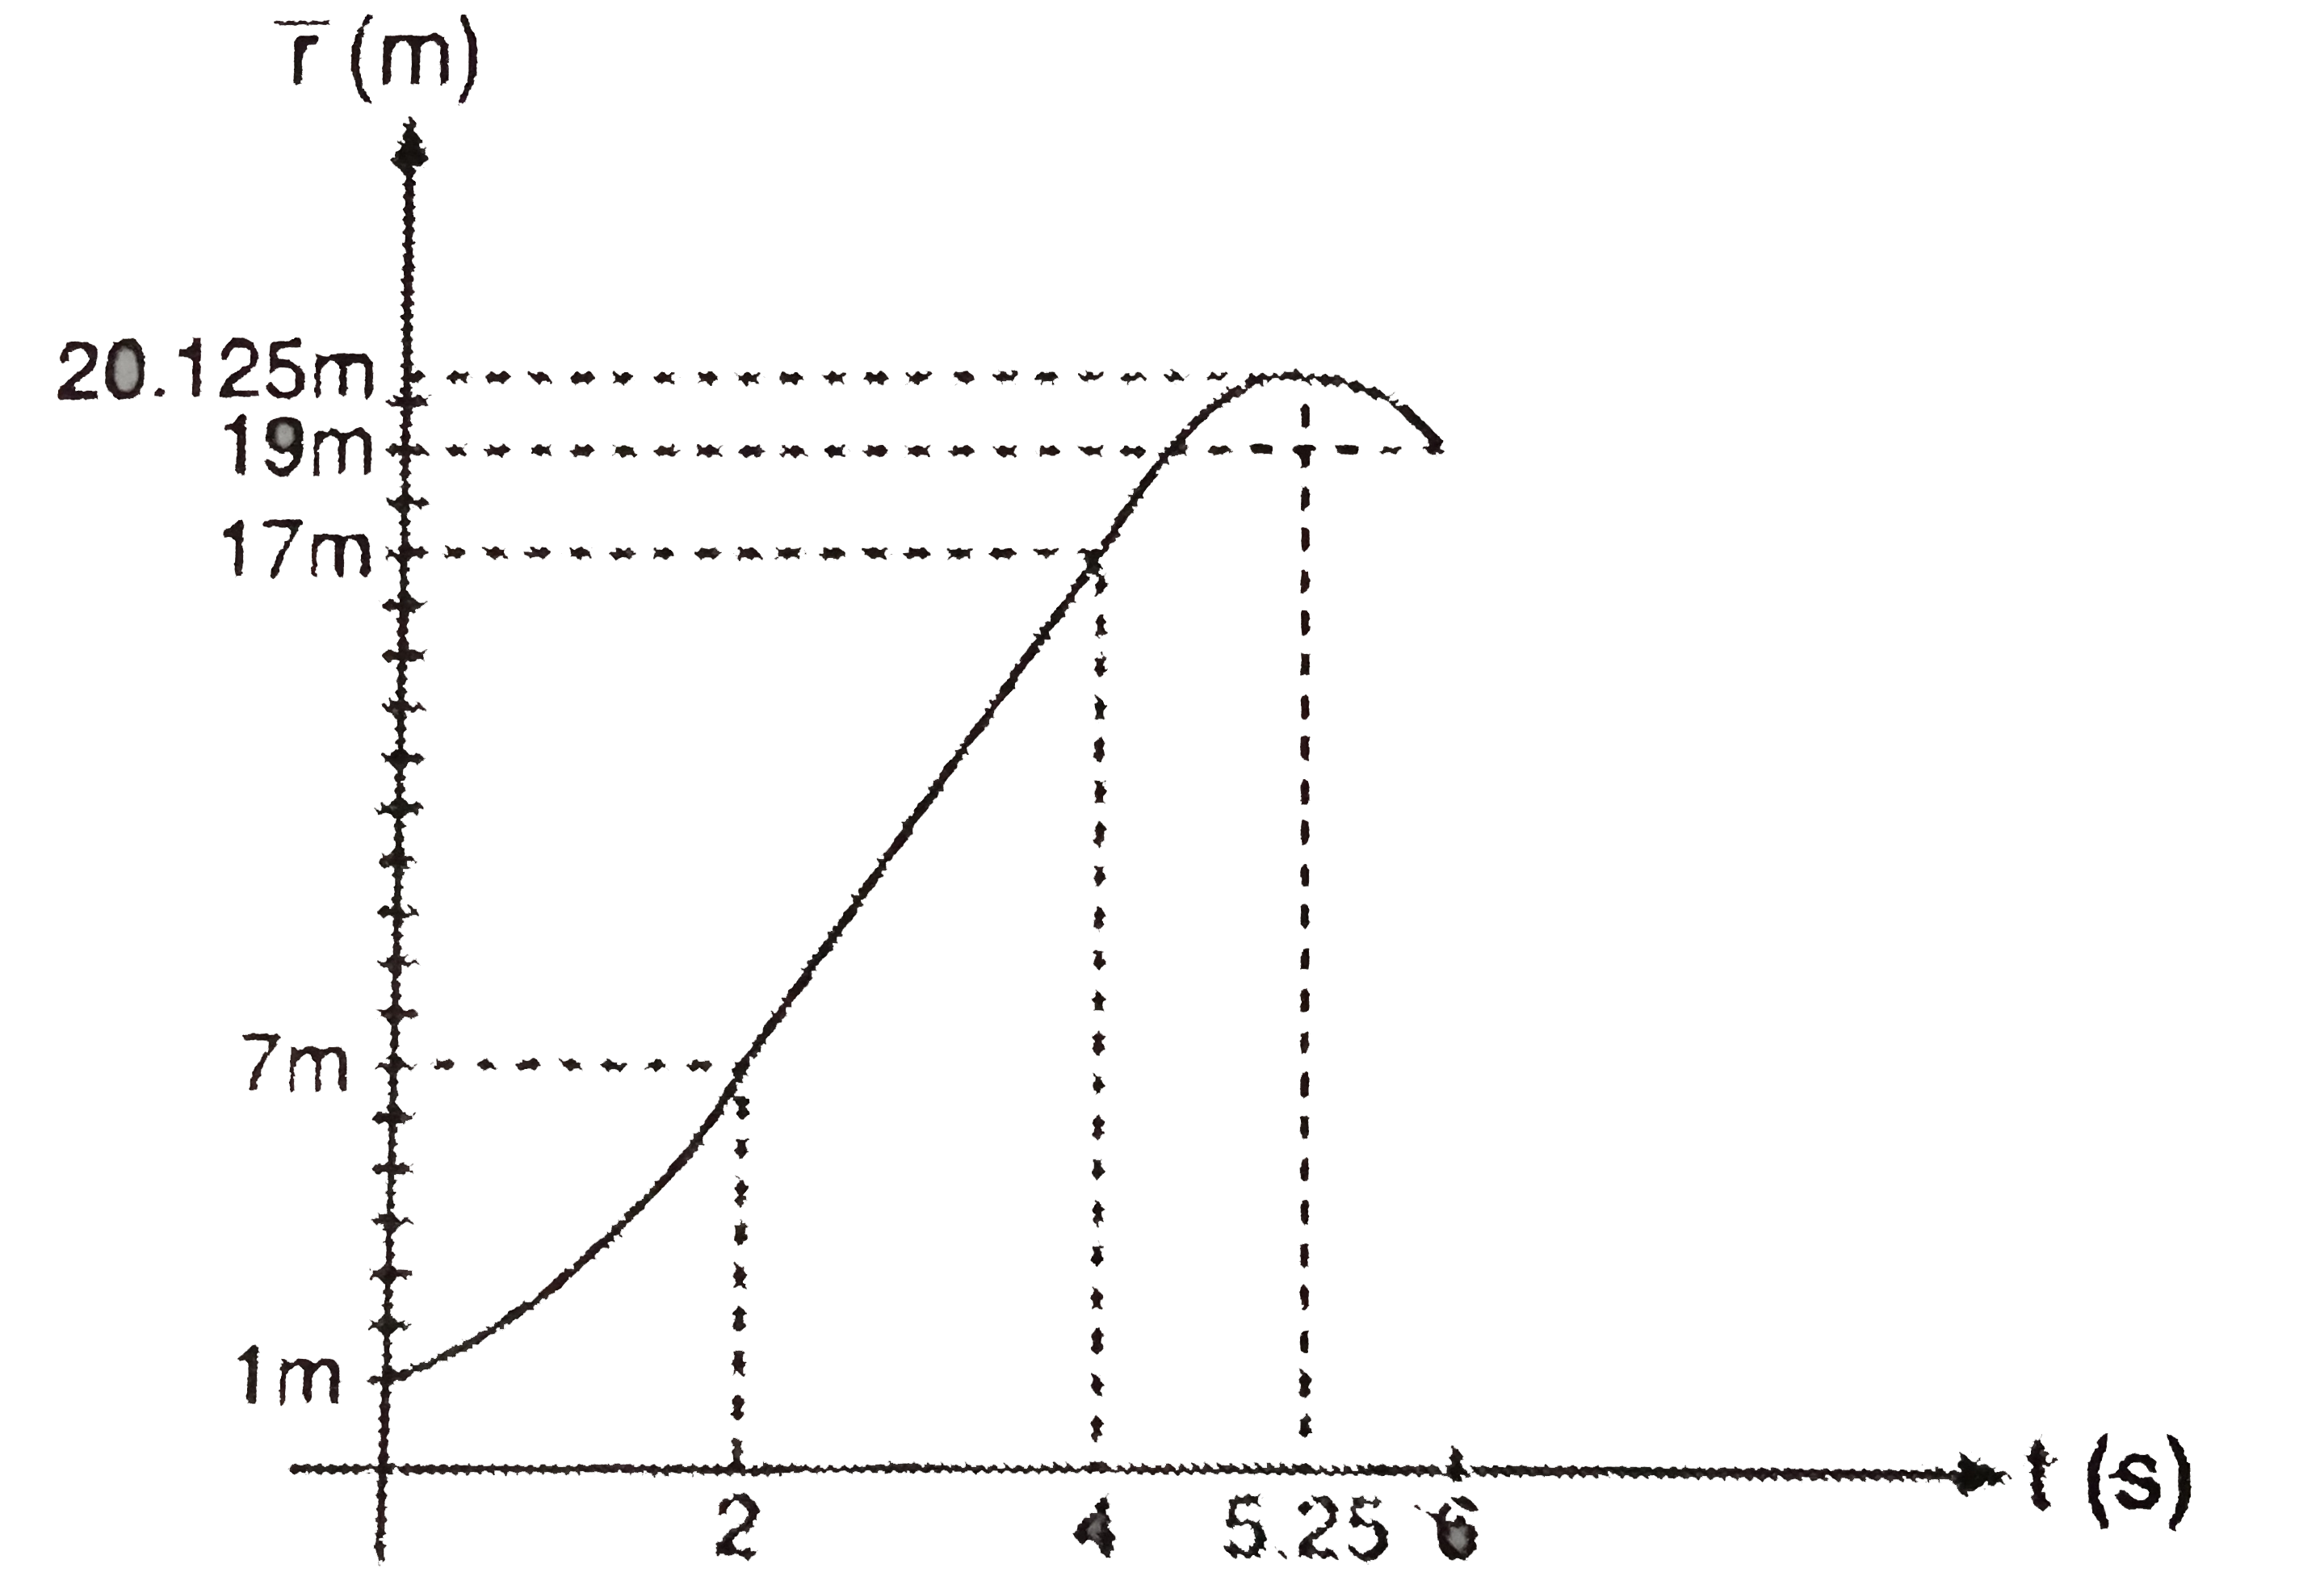
Position after 4 s, ¯r4=¯r2+Δ¯r=7+10=17m
Position after 5.25s,¯r5.25=¯r4+Δ¯r
=17+3.125=20.125m
Position after 6s,¯r6=¯r5.25+Δ¯r
=20.125−1.125=19m
Topper's Solved these Questions
- MOTION IN A STRAIGHT LINEBOOK - GRB PUBLICATIONCHAPTER - MOTION IN A STRAIGHT LINEEXERCISE - Problem
14 Videos
- MOTION IN A STRAIGHT LINEBOOK - GRB PUBLICATIONCHAPTER - MOTION IN A STRAIGHT LINEEXERCISE - Problems and Practice
16 Videos
- FRICTION AND CIRCULAR MOTION BOOK - GRB PUBLICATIONCHAPTER - FRICTION AND CIRCULAR MOTION EXERCISE - Comprehension type
11 Videos
- MOTION IN TWO AND THREE DIMENSIONSBOOK - GRB PUBLICATIONCHAPTER - MOTION IN TWO AND THREE DIMENSIONSEXERCISE - All Questions
210 Videos
Similar Questions
Knowledge Check
Displacement time graph of a particle moving in a straight line is a shown in figure.
 Ain region A acceleration is positiveBin region B acceleration is negativeCin region C acceleration is positiveDin region D acceleration is negative
The velocity-time graph of a body moving in a straight line is shown in the figure.
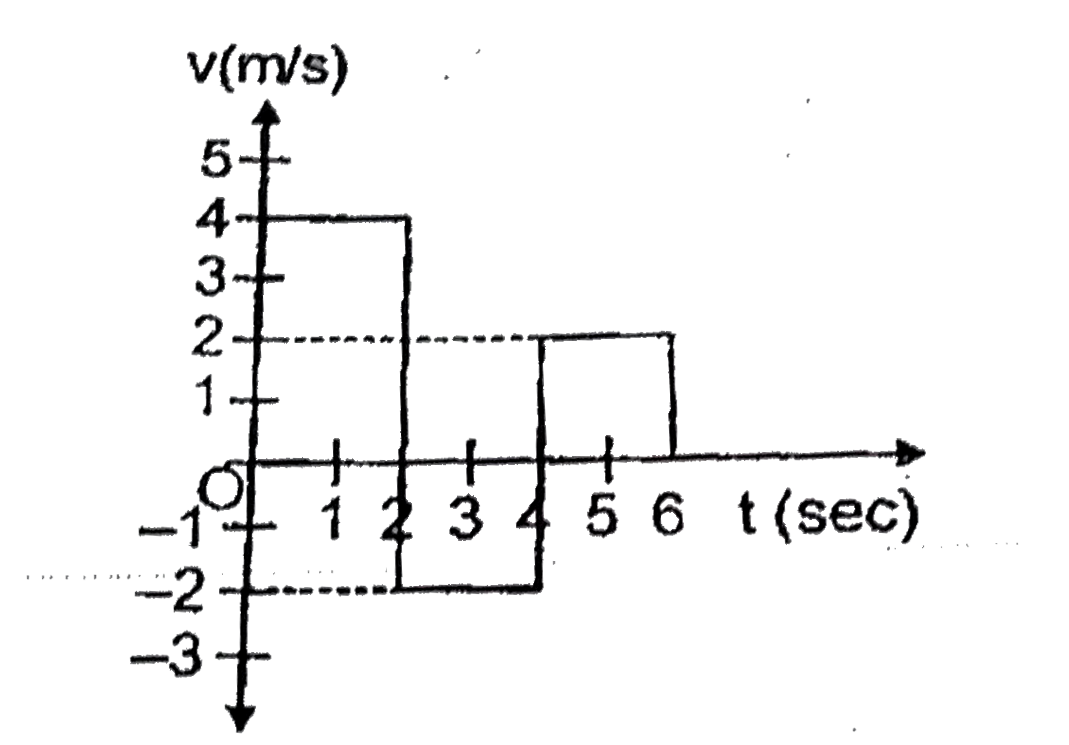 AThe magnitude of displacement of the body in 1st 2 sec is 8 mBThe magnitude of displacement of the body in 1st 4 sec is 4 mCThe distance travelled in 1st 2 sec is 8 mDThe distance travelled in 1st 4 sec is 12 m
The acceleration - velocity graph of a particle moving in a straight line is shown in figure. Then the slope of the velocity- displacement graph
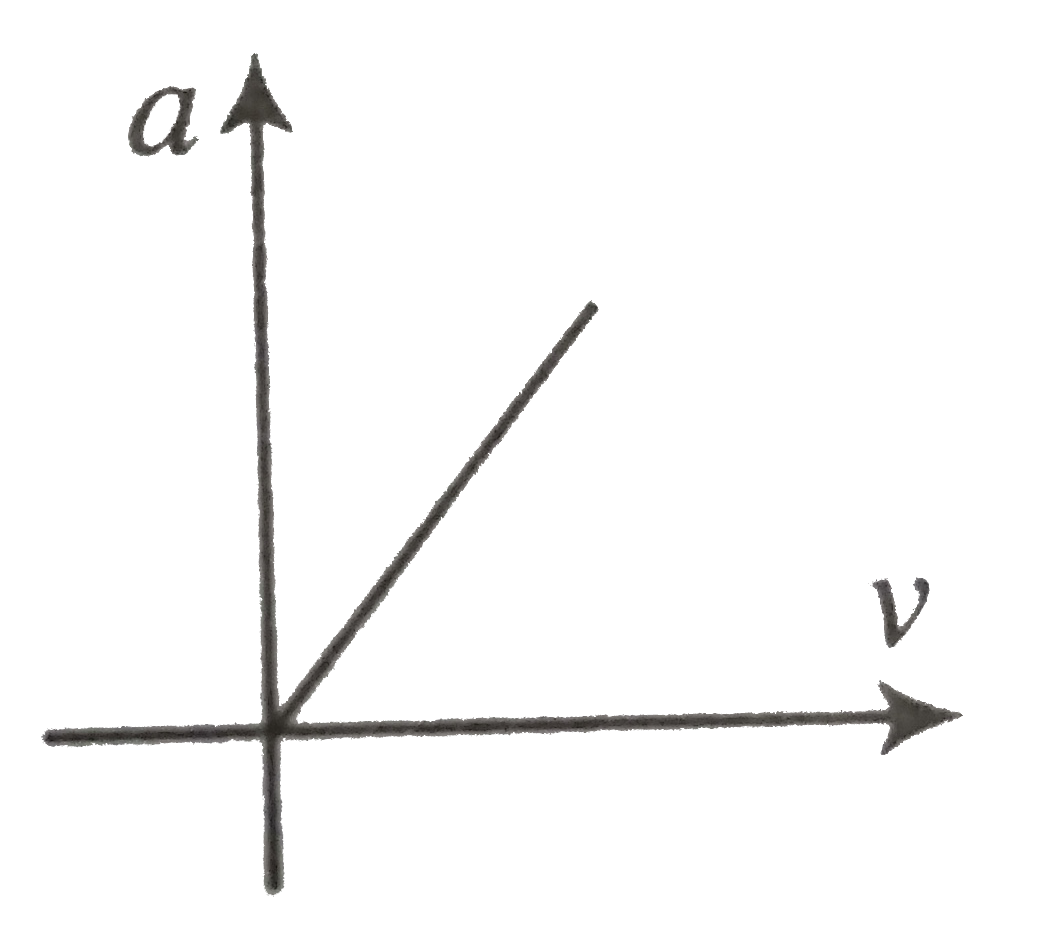 Aincreases linearlyBdecreases linearlyCis constantDincreases parabolically
Acceleration-velocity graph of a particle moving in a straight line is as shown in the figure. Then slope of velocity-displacement graph

View SolutionThe acceleration versus time graph of a particle moving in a straight line is show in figure. The velocity-time graph of the particle would be
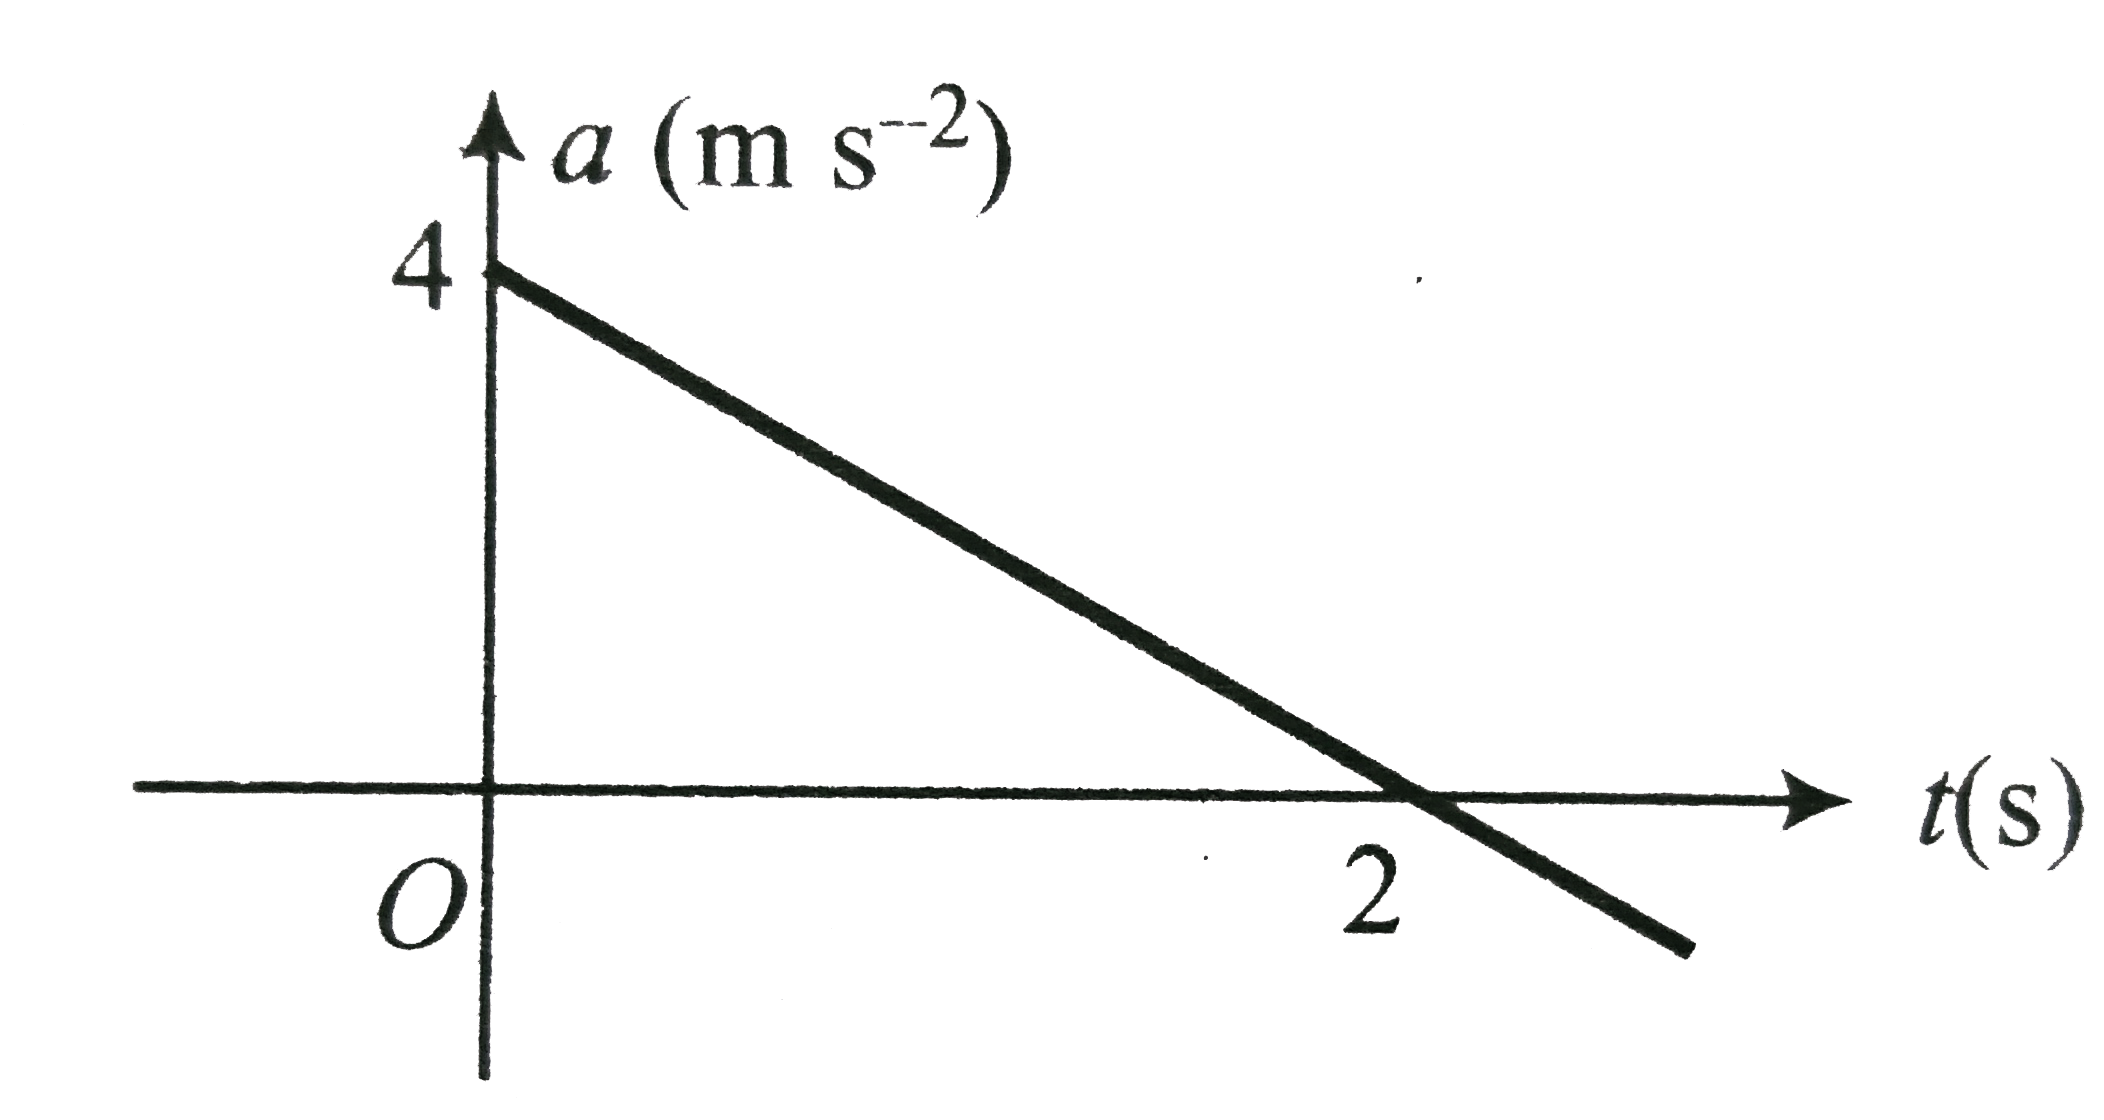 .
.
View SolutionThe acceleration versus time graph for a particle moving along a straight line is shown in the figure. If the particle starts from rest at t = 0, then its speed at t = 30 sec will be :
View SolutionThe acceleration-time graph of a particle moving along a straight line is as shown in. At what time the particle acquires its initial velocity?
 .
.
View SolutionThe acceleration-time graph of a particle moving along a straight line is as shown in figure. At what time the particle acquires its initial velocity ?

View Solution

