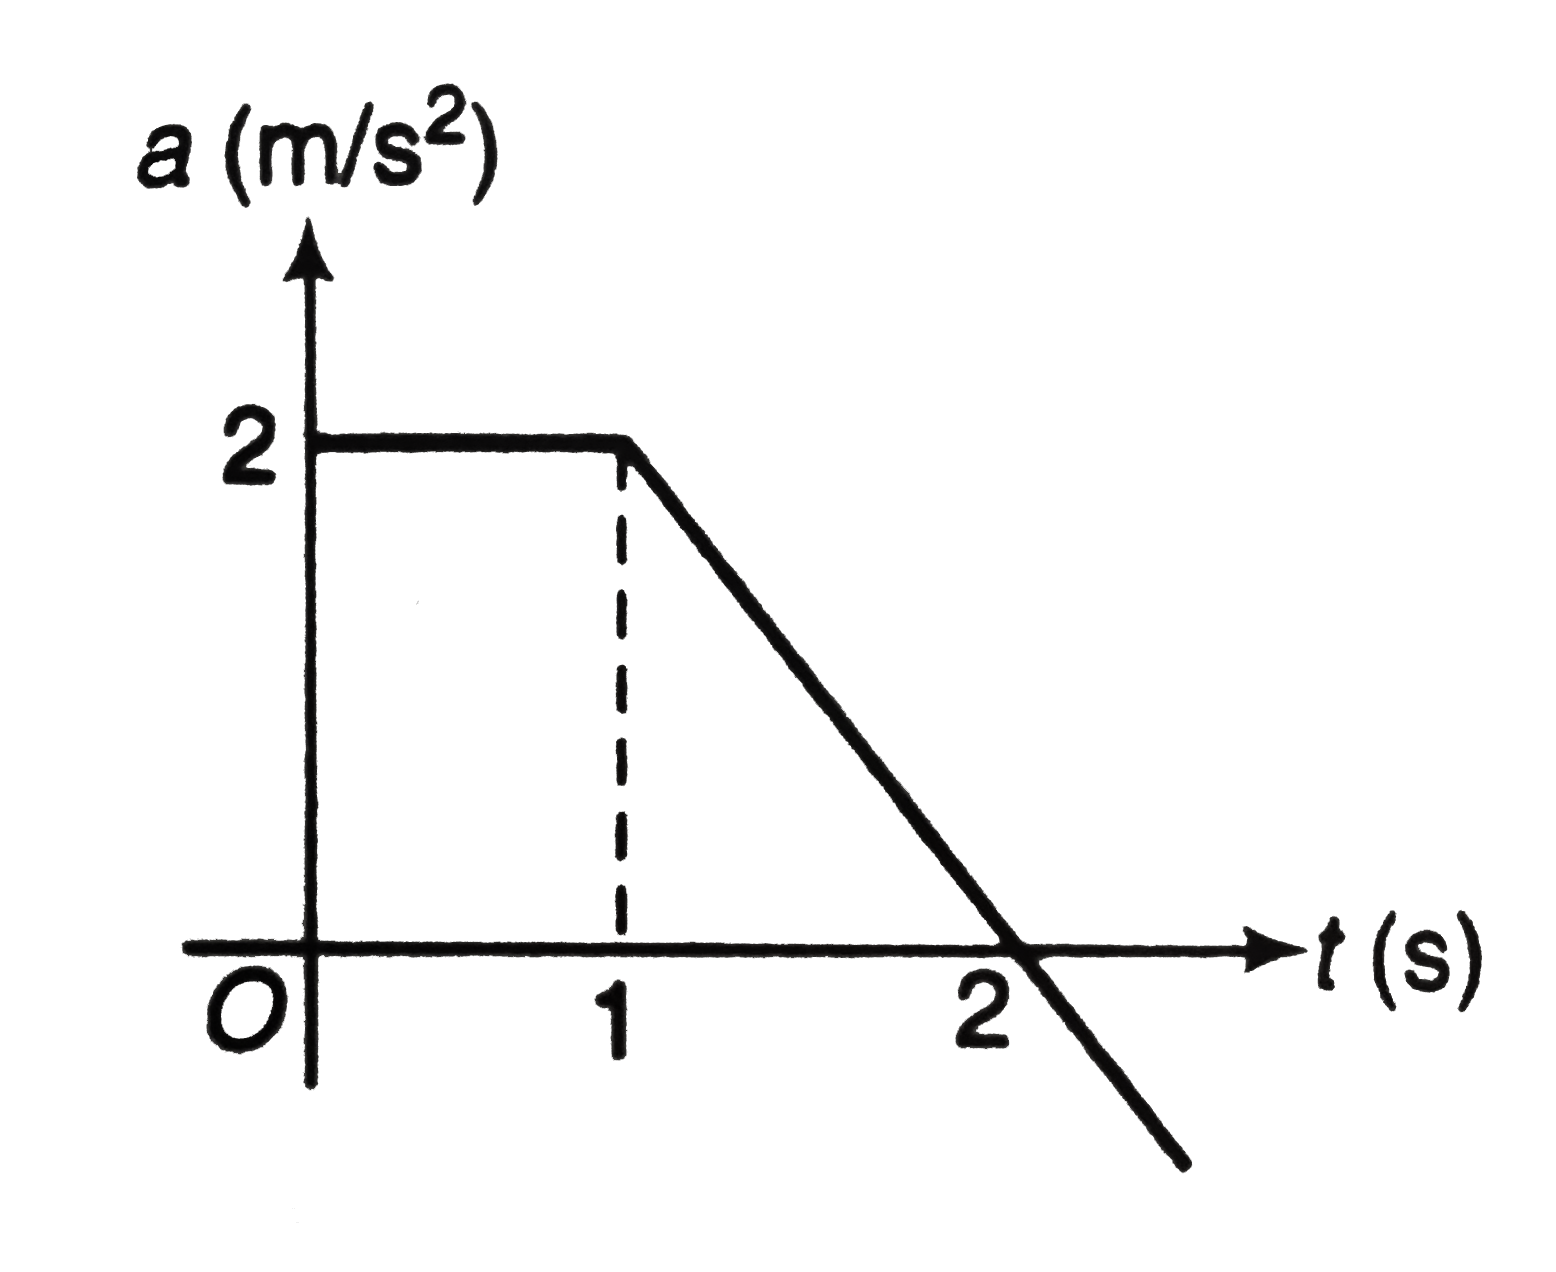
The acceleration-time graph of a particle moving along a straight line is as shown in figure. At what time the particle acquires its initial velocity ?

12 sec.
6 sec.
8 sec.
16 sec.
The correct Answer is:B
Step by step video, text & image solution for The acceleration-time graph of a particle moving along a straight line is as shown in figure. At what time the particle acquires its initial velocity ? by Physics experts to help you in doubts & scoring excellent marks in Class 11 exams.
Updated on:21/07/2023Similar Questions
The acceleration time graph of a particle moving along a straight line is as shown in Fig.At what time the particle acquires its initial velocity?
View SolutionFigure shows the acceleration-time graph of a particle moving along a straight line. After what time the particle acquires its initial velocity?
View Solution
Knowledge Check
The acceleration-time graph of a particle moving along a straight line is as shown in figure. At what time the particle acquires its initial velcoity ?
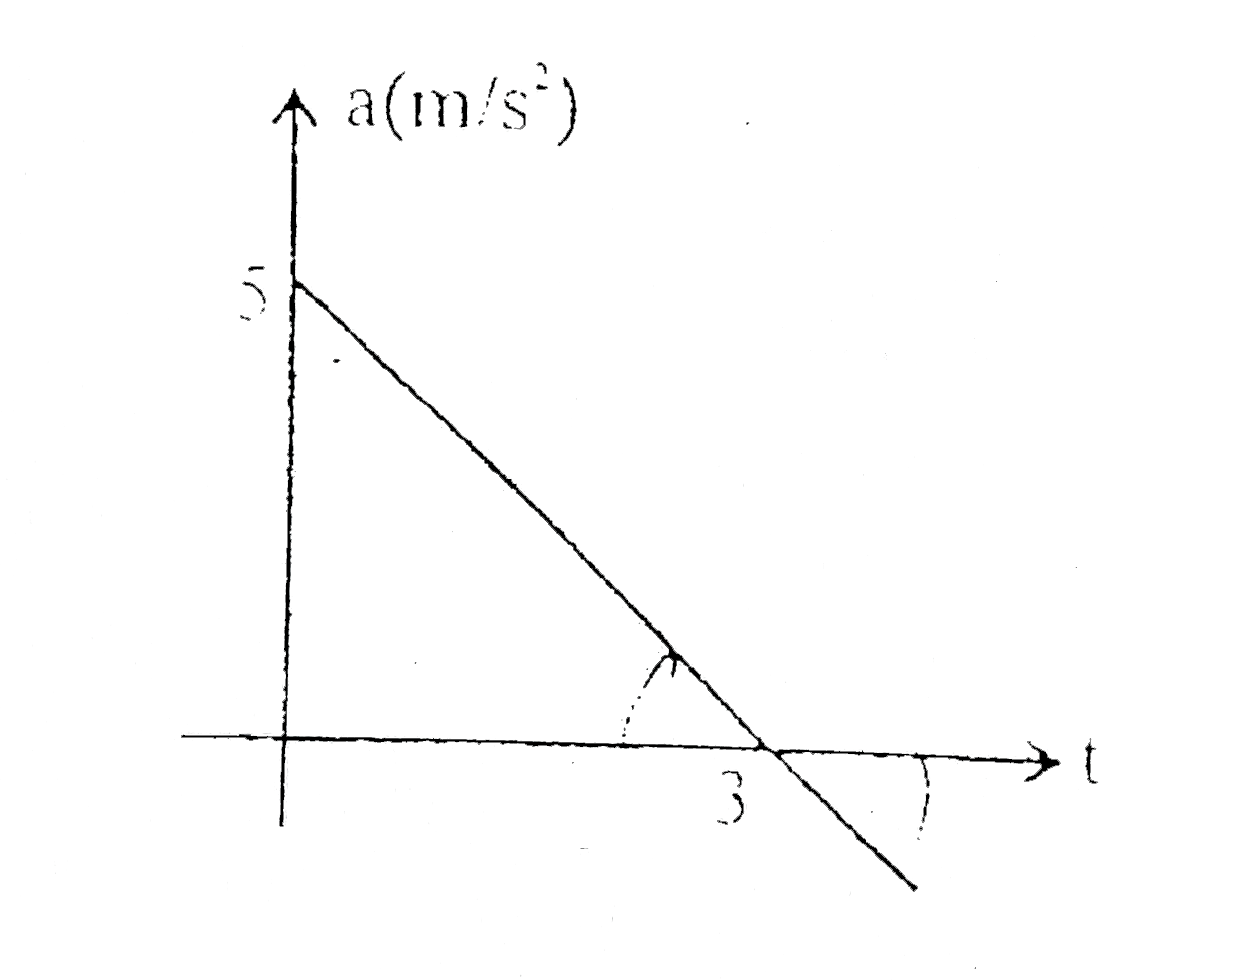 A3 secB5 secC6 secD16 sec
The acceleration-time graph of a particle moving along a straight line is as shown in. At what time the particle acquires its initial velocity?
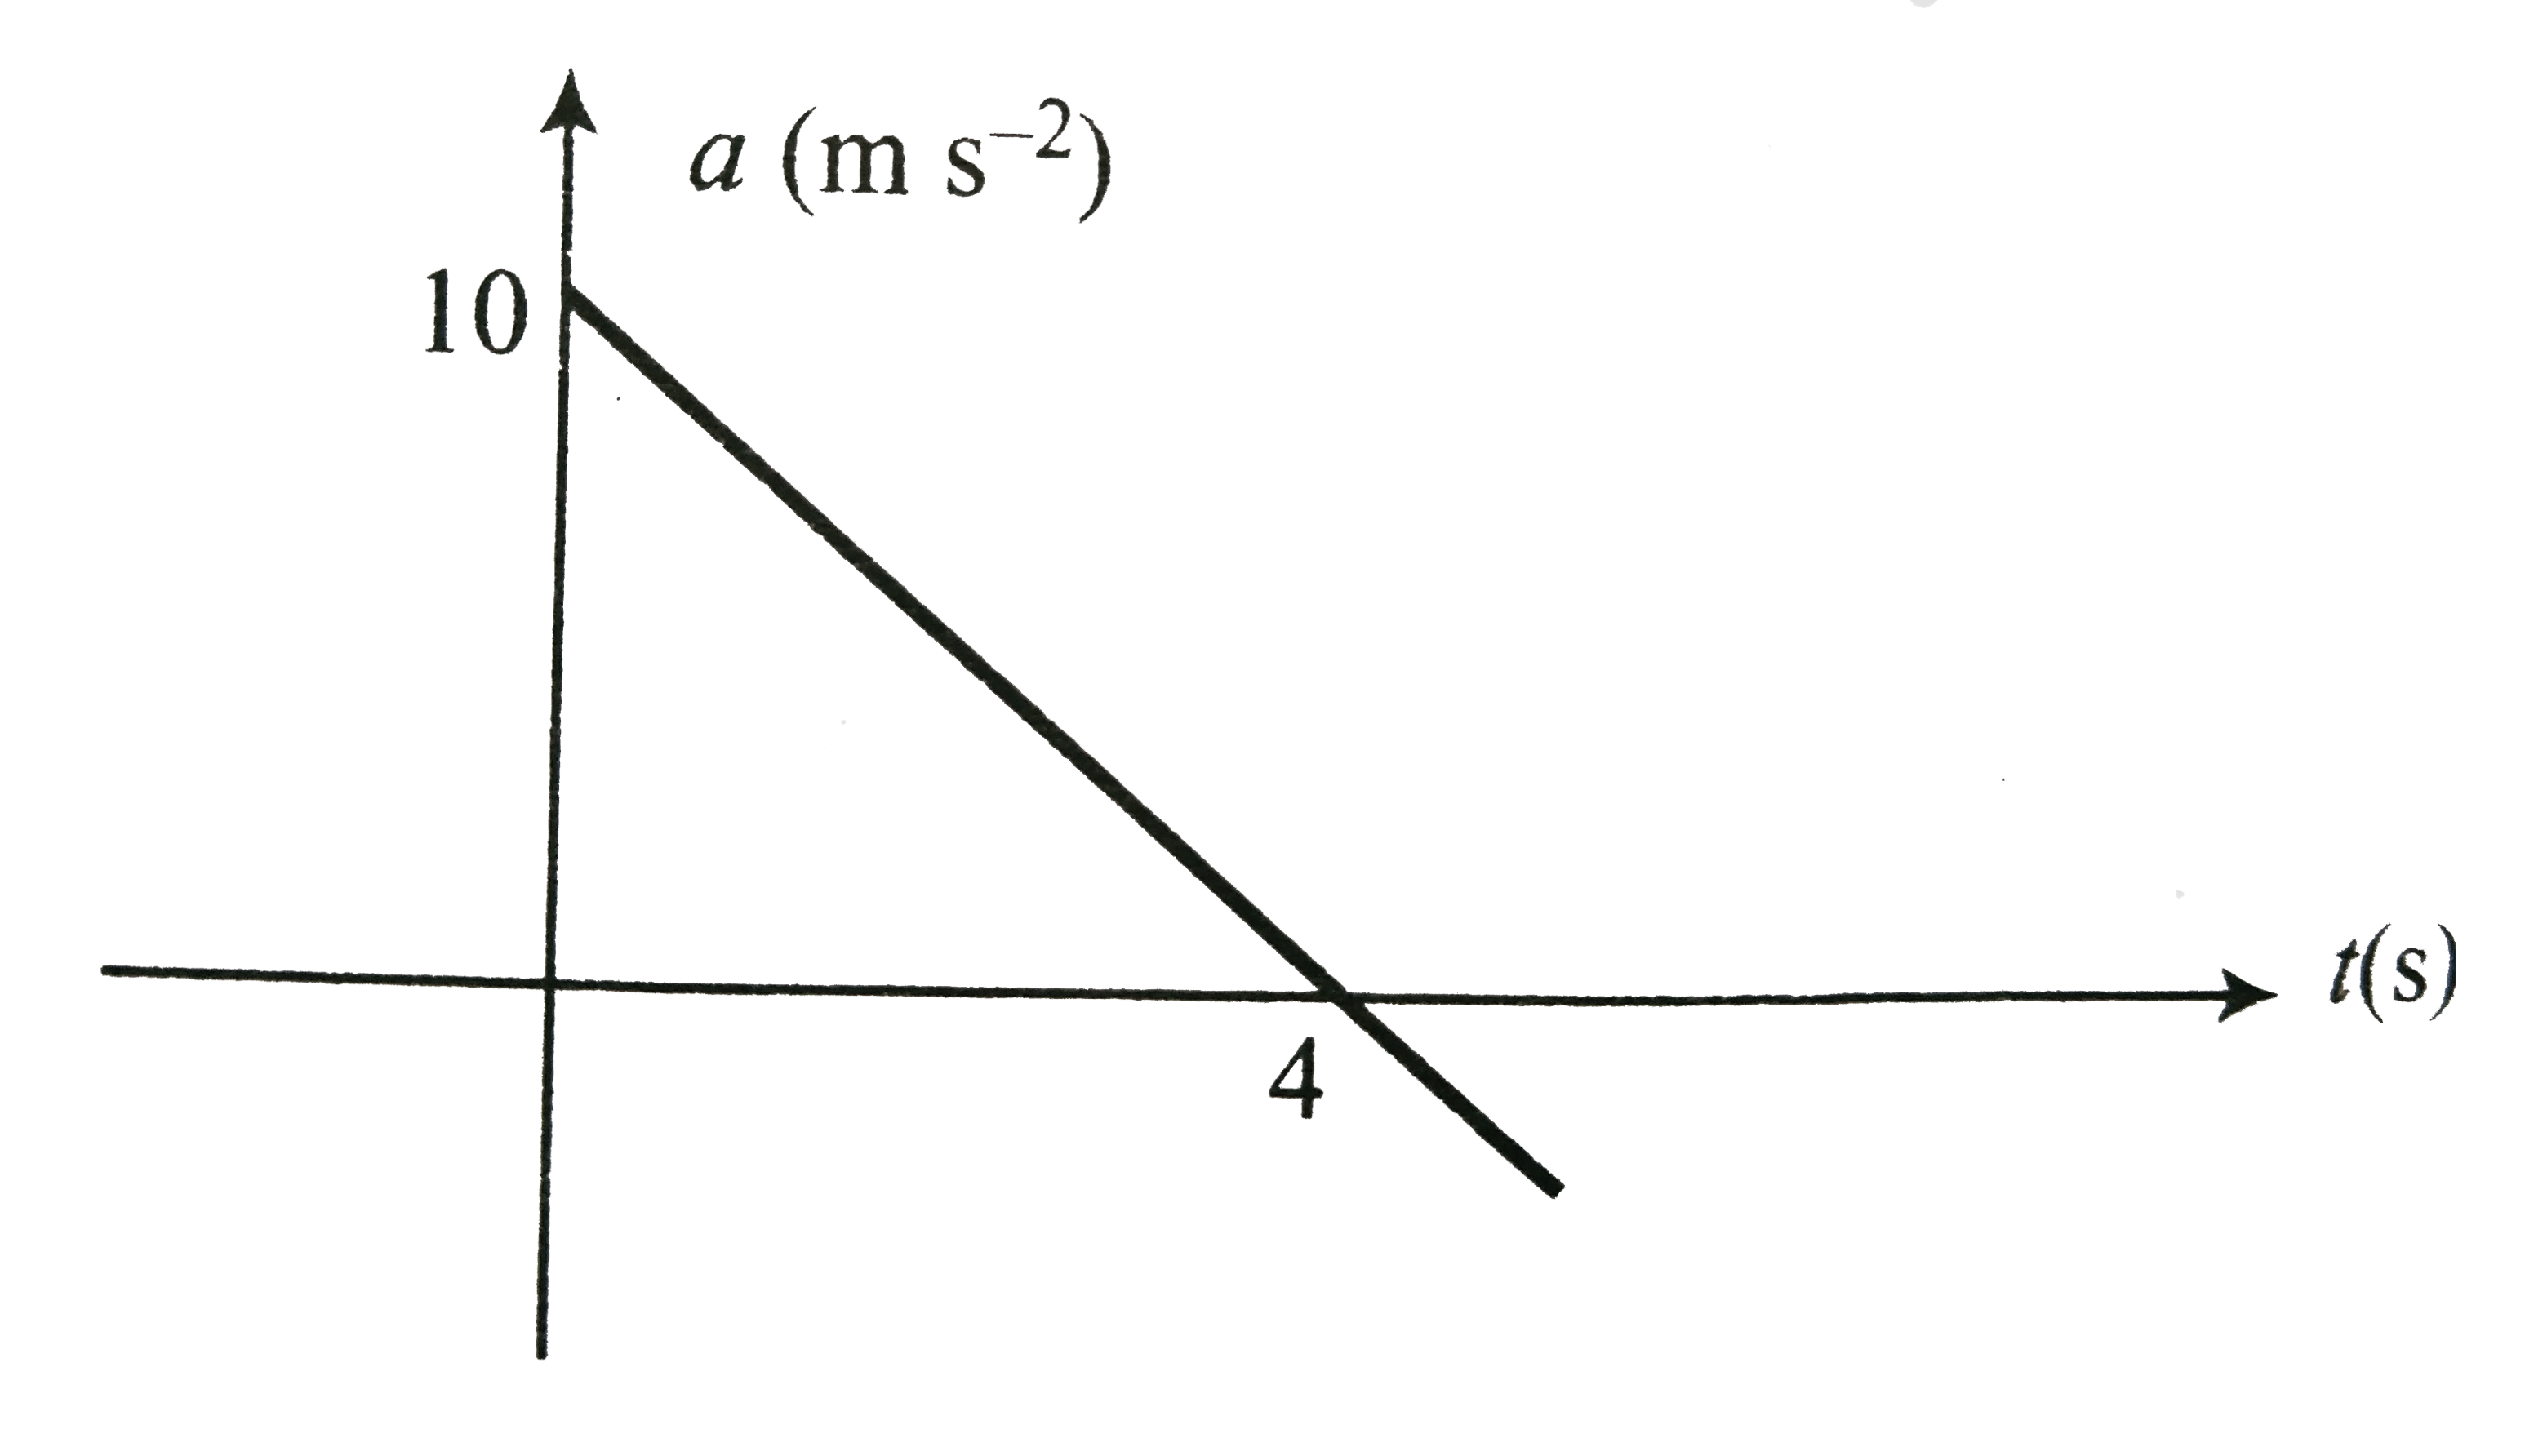 .A12sB5sC8sD16s
Displacement time graph of a particle moving in a straight line is a shown in figure.
 Ain region A acceleration is positiveBin region B acceleration is negativeCin region C acceleration is positiveDin region D acceleration is negative
The acceleration time graph of a particle moving along a straight line is as shown. The time at which the particle will have the velocity same as initial velocity (in s) is?
View SolutionThe velocity-time plot for a particle moving on a straight line is shown in the figure, then
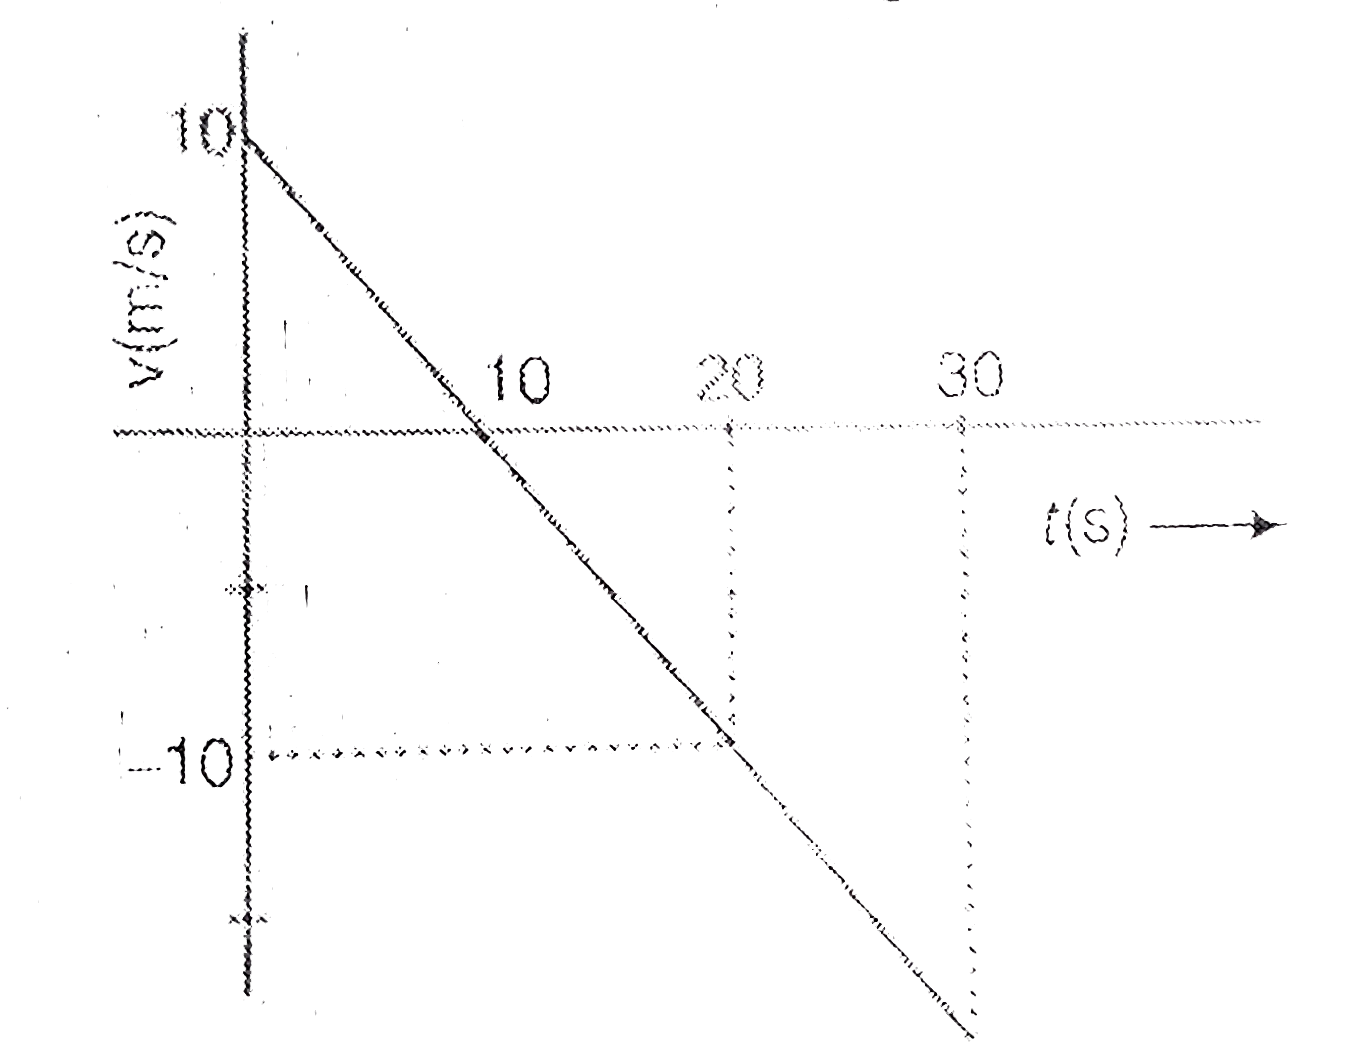
View SolutionVelocity displacement graph of a particle moving in a straight line is as shown in figure.

View SolutionThe velocity-time plot for a particle moving on a straight line is shown in figure.
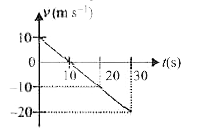
View SolutionThe velocity- time plot for a particle moving on a straight line is shown in the figure
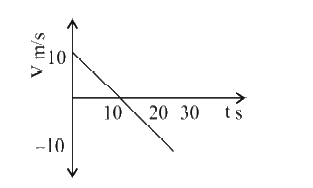
View Solution
