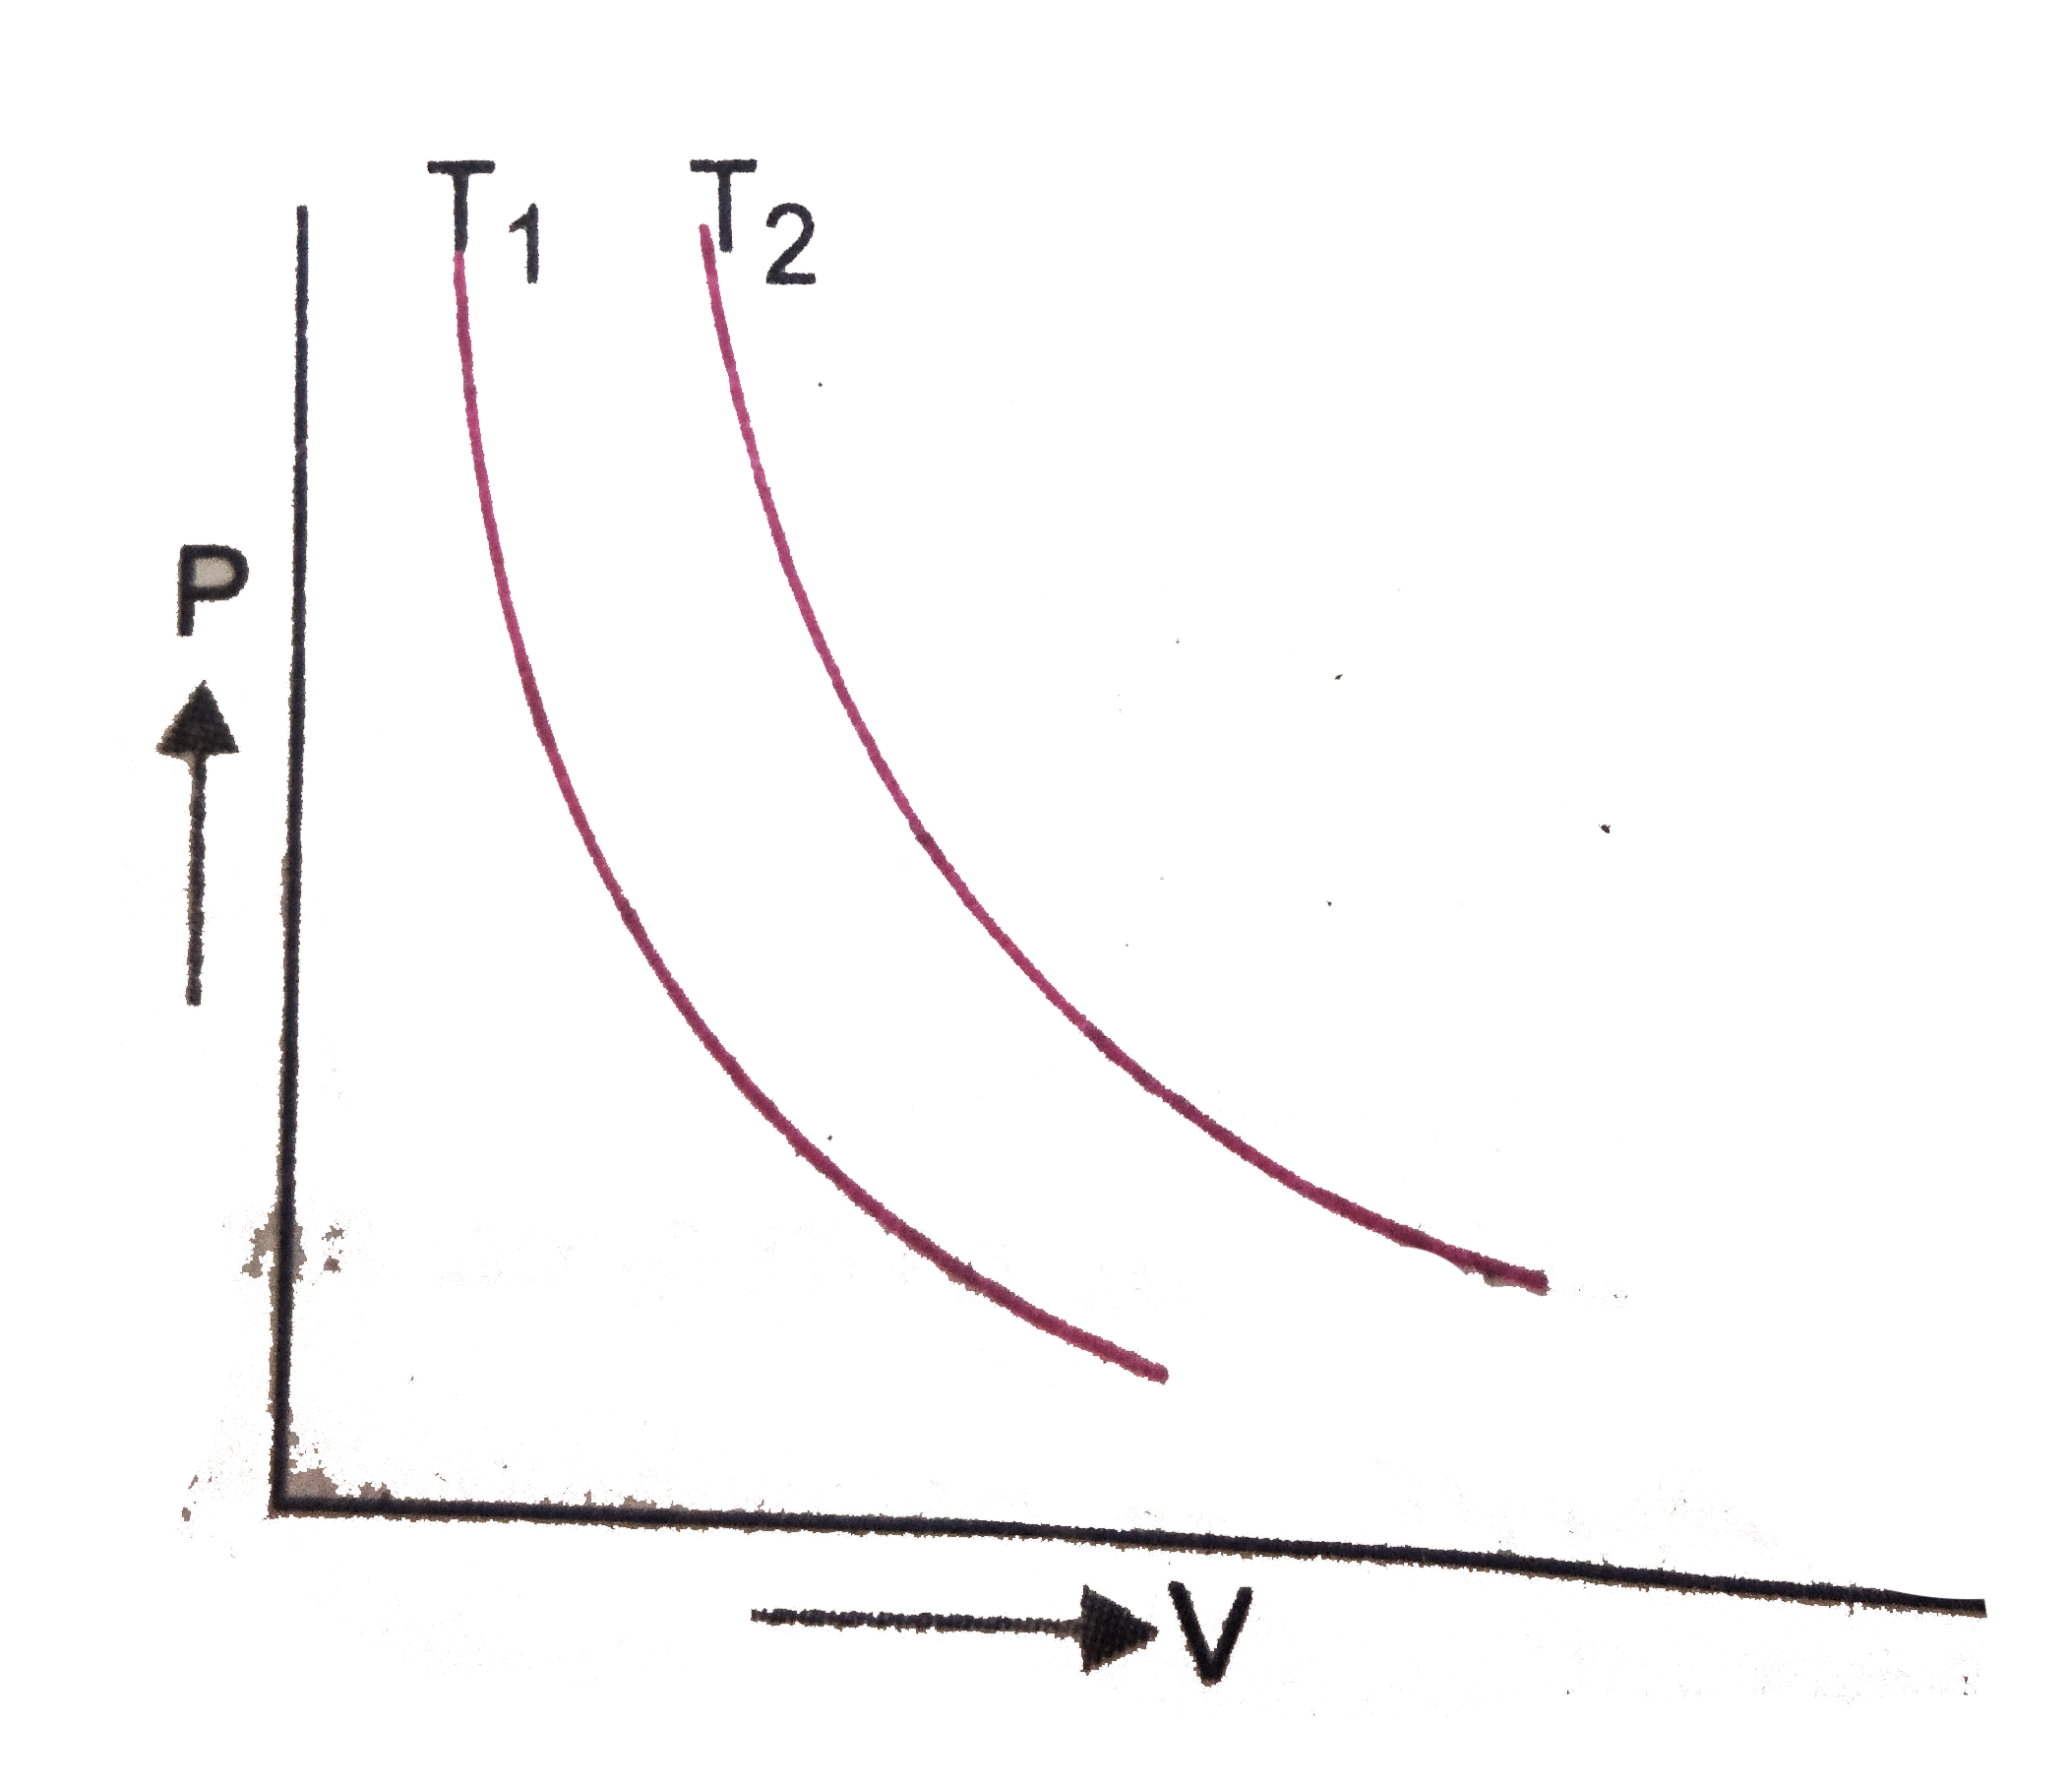
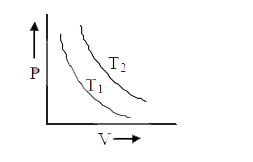
Consider the reversible isothermal expansion of an ideal gas in a closed system at two different temperatures T1 and T2(T1<T2). The correct graphical depiction of the dependence of work done (w) on the final volume (V) is:
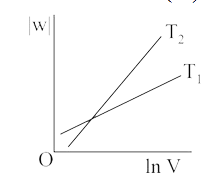
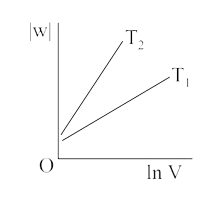
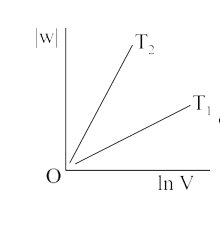
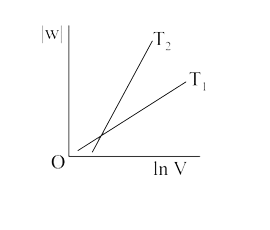
The correct Answer is:D
To solve the problem of the reversible isothermal expansion of an ideal gas at two different temperatures T1 and T2 (where T1<T2), we need to analyze the relationship between the work done (w) and the final volume (V) of the gas.
1. Understand the Work Done in Isothermal Expansion:
The work done W during the isothermal expansion of an ideal gas can be expressed using the formula:
W=−nRTln(VfVi)
where:
- n = number of moles of gas
- R = universal gas constant
- T = absolute temperature (in Kelvin)
- Vf = final volume
- Vi = initial volume
2. Magnitude of Work Done:
Since we are interested in the magnitude of work done, we can ignore the negative sign:
|W|=nRTln(VfVi)
3. Graphical Representation:
- The work done |W| is dependent on the natural logarithm of the ratio of final volume to initial volume.
- As Vf increases, |W| also increases, indicating a positive correlation between work done and final volume.
4. Comparing Two Temperatures:
- For two different temperatures T1 and T2:
- At a higher temperature T2, the work done will be greater for the same change in volume compared to T1 because |W| is directly proportional to T.
- Therefore, the graph of work done versus final volume will show that at T2, the curve will be above that of T1.
5. Identifying the Correct Graph:
- The graph will show two curves, one for T1 and one for T2. Both curves will be increasing, with the curve for T2 lying above the curve for T1.
- The intercepts on the work axis will be negative because as Vf approaches Vi, the work done approaches zero, but remains negative due to the nature of expansion.
Conclusion:
The correct graphical depiction of the dependence of work done (w) on the final volume (V) will show two curves: one for T1 and one for T2, with the curve for T2 lying above that of T1 and both having negative intercepts.
The work done W during the isothermal expansion of an ideal gas can be expressed using the formula:
W=−nRTln(VfVi)
where:
- n = number of moles of gas
- R = universal gas constant
- T = absolute temperature (in Kelvin)
- Vf = final volume
- Vi = initial volume
Since we are interested in the magnitude of work done, we can ignore the negative sign:
|W|=nRTln(VfVi)
- The work done |W| is dependent on the natural logarithm of the ratio of final volume to initial volume.
- As Vf increases, |W| also increases, indicating a positive correlation between work done and final volume.
- For two different temperatures T1 and T2:
- At a higher temperature T2, the work done will be greater for the same change in volume compared to T1 because |W| is directly proportional to T.
- Therefore, the graph of work done versus final volume will show that at T2, the curve will be above that of T1.
- The graph will show two curves, one for T1 and one for T2. Both curves will be increasing, with the curve for T2 lying above the curve for T1.
- The intercepts on the work axis will be negative because as Vf approaches Vi, the work done approaches zero, but remains negative due to the nature of expansion.
The correct graphical depiction of the dependence of work done (w) on the final volume (V) will show two curves: one for T1 and one for T2, with the curve for T2 lying above that of T1 and both having negative intercepts.
Similar Questions
Knowledge Check
The correct representation of wavelength intensity relationship of an ideal blackbody radiation at two different temperatures T1 and T2 is
A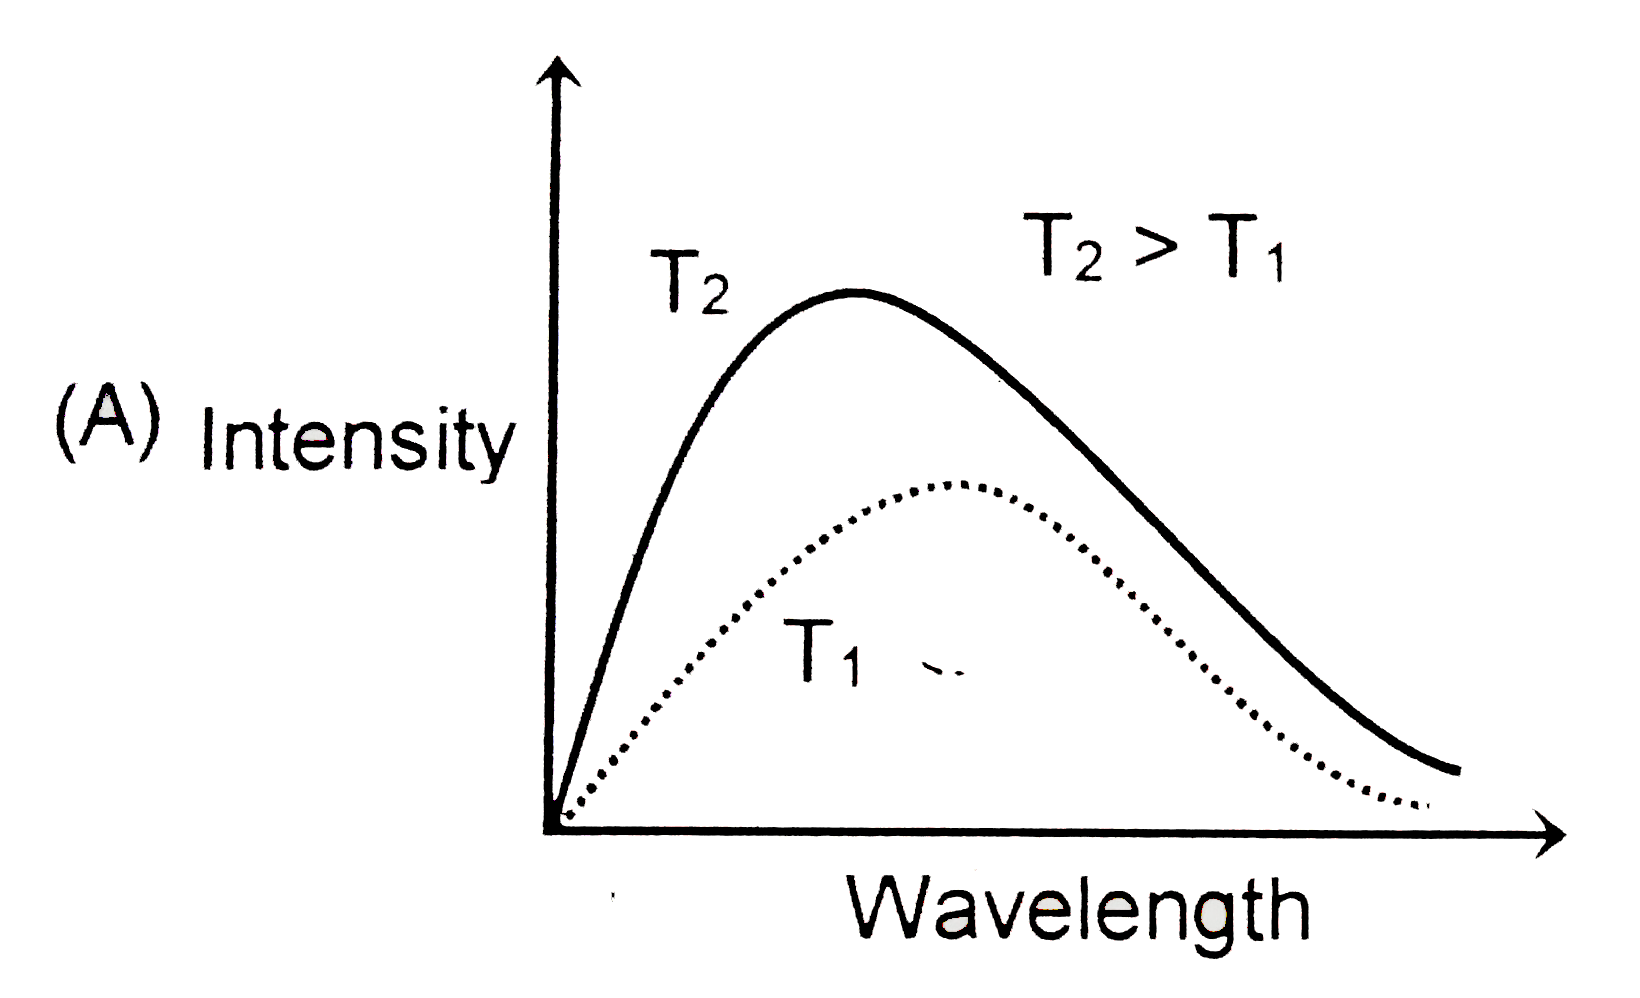 B
B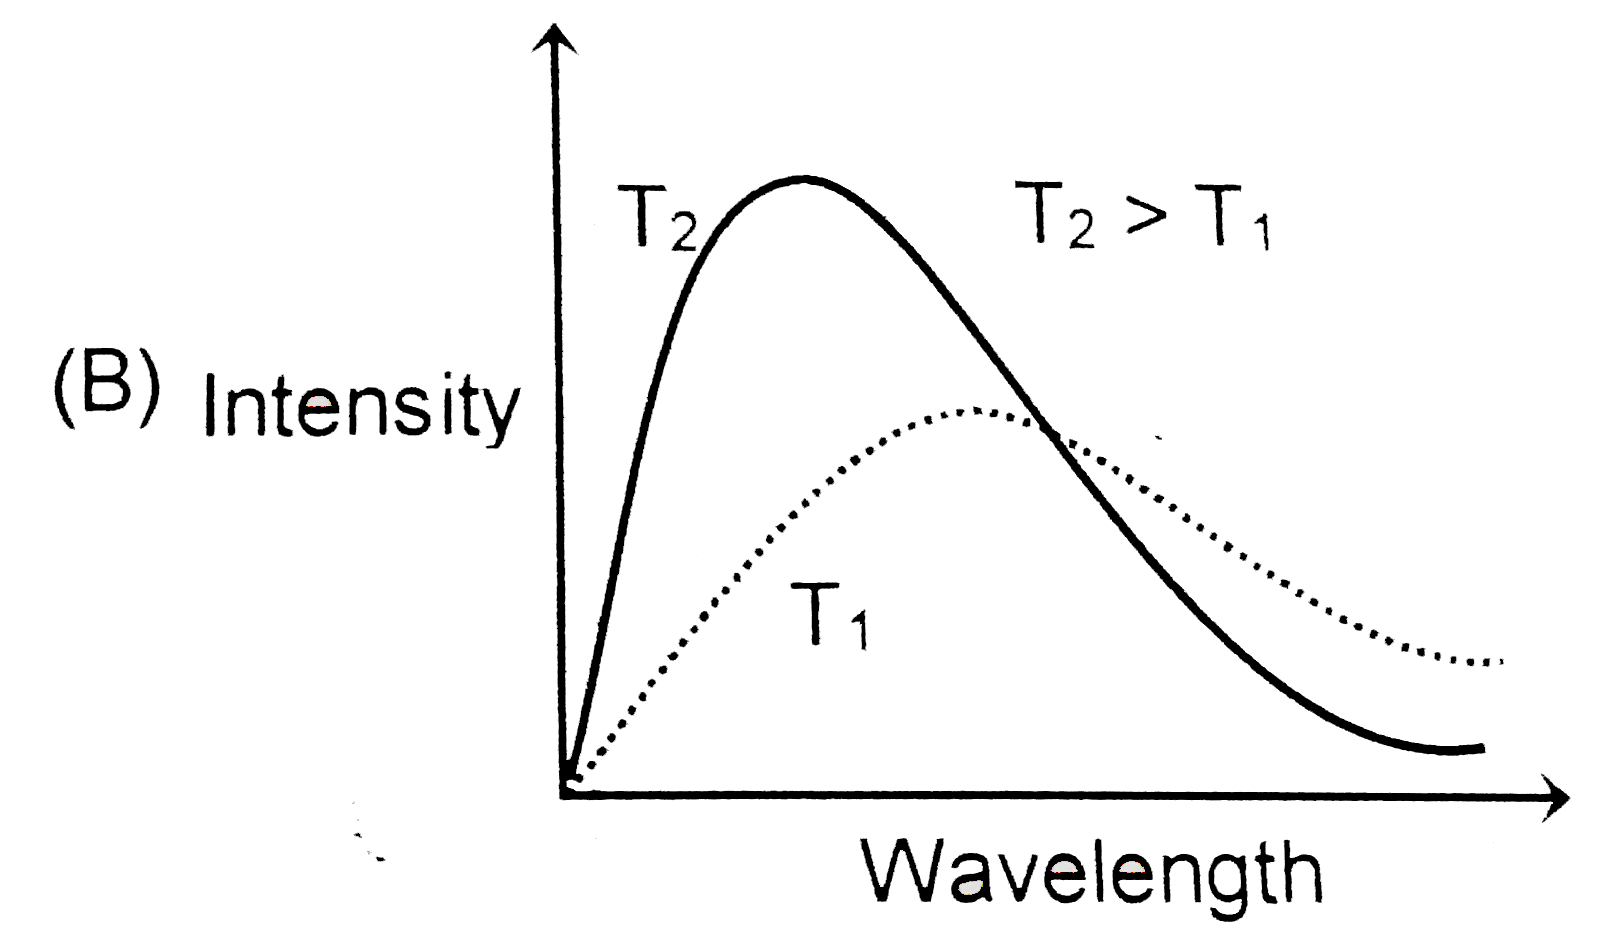 C
C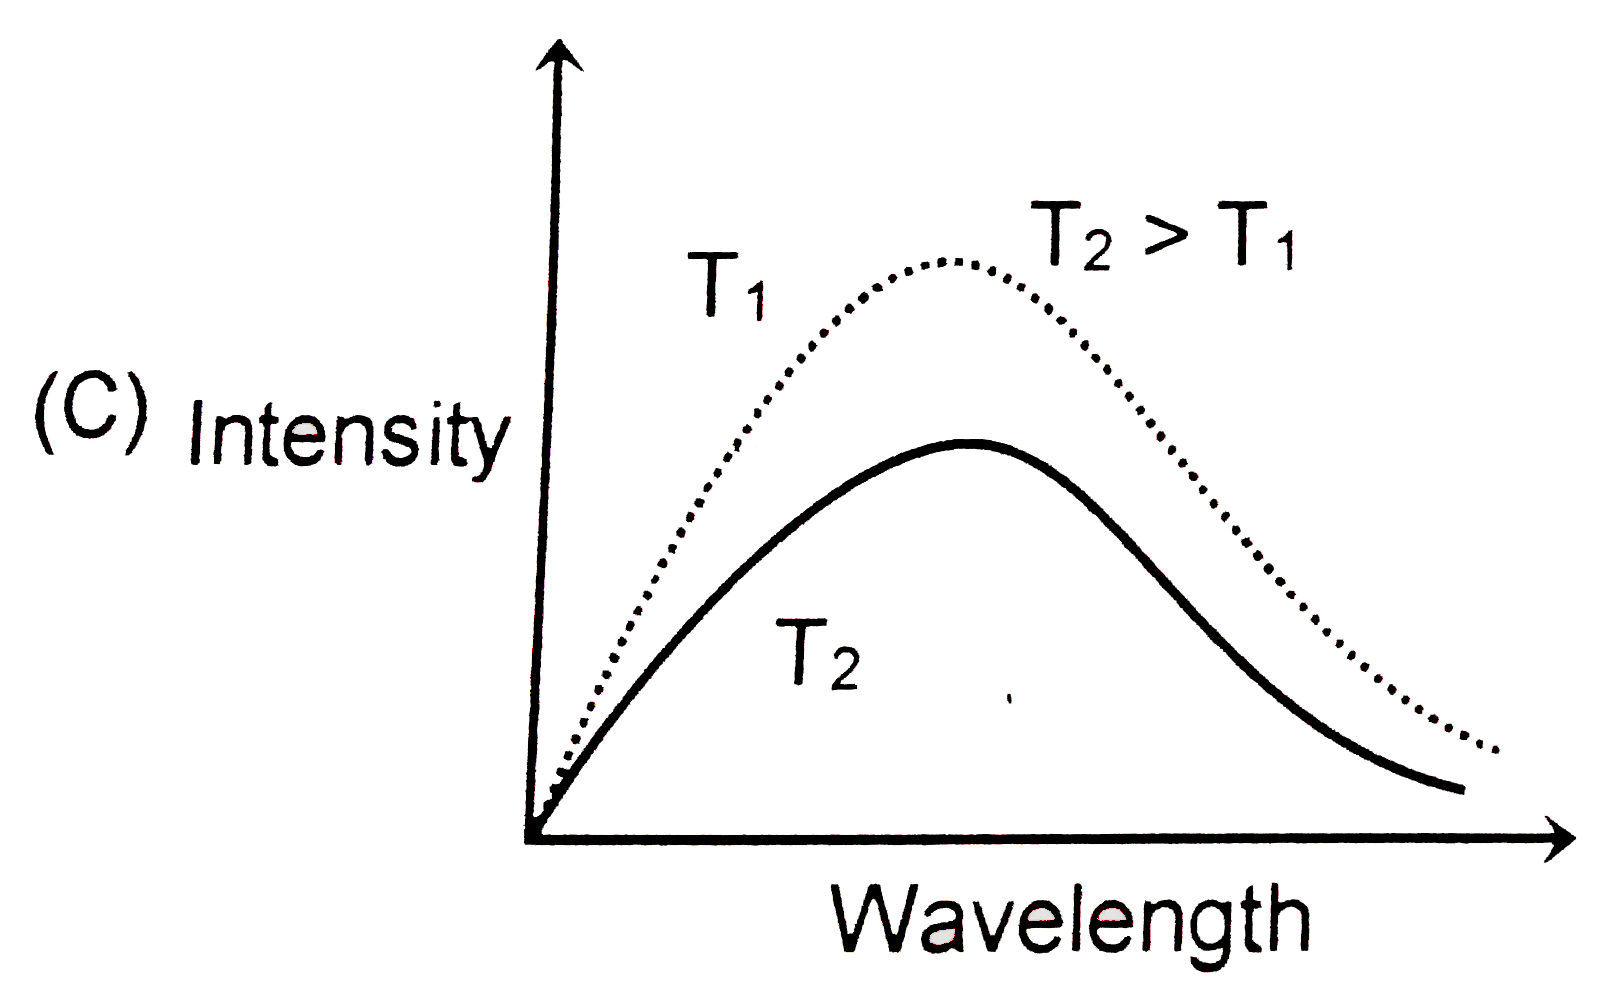 D
D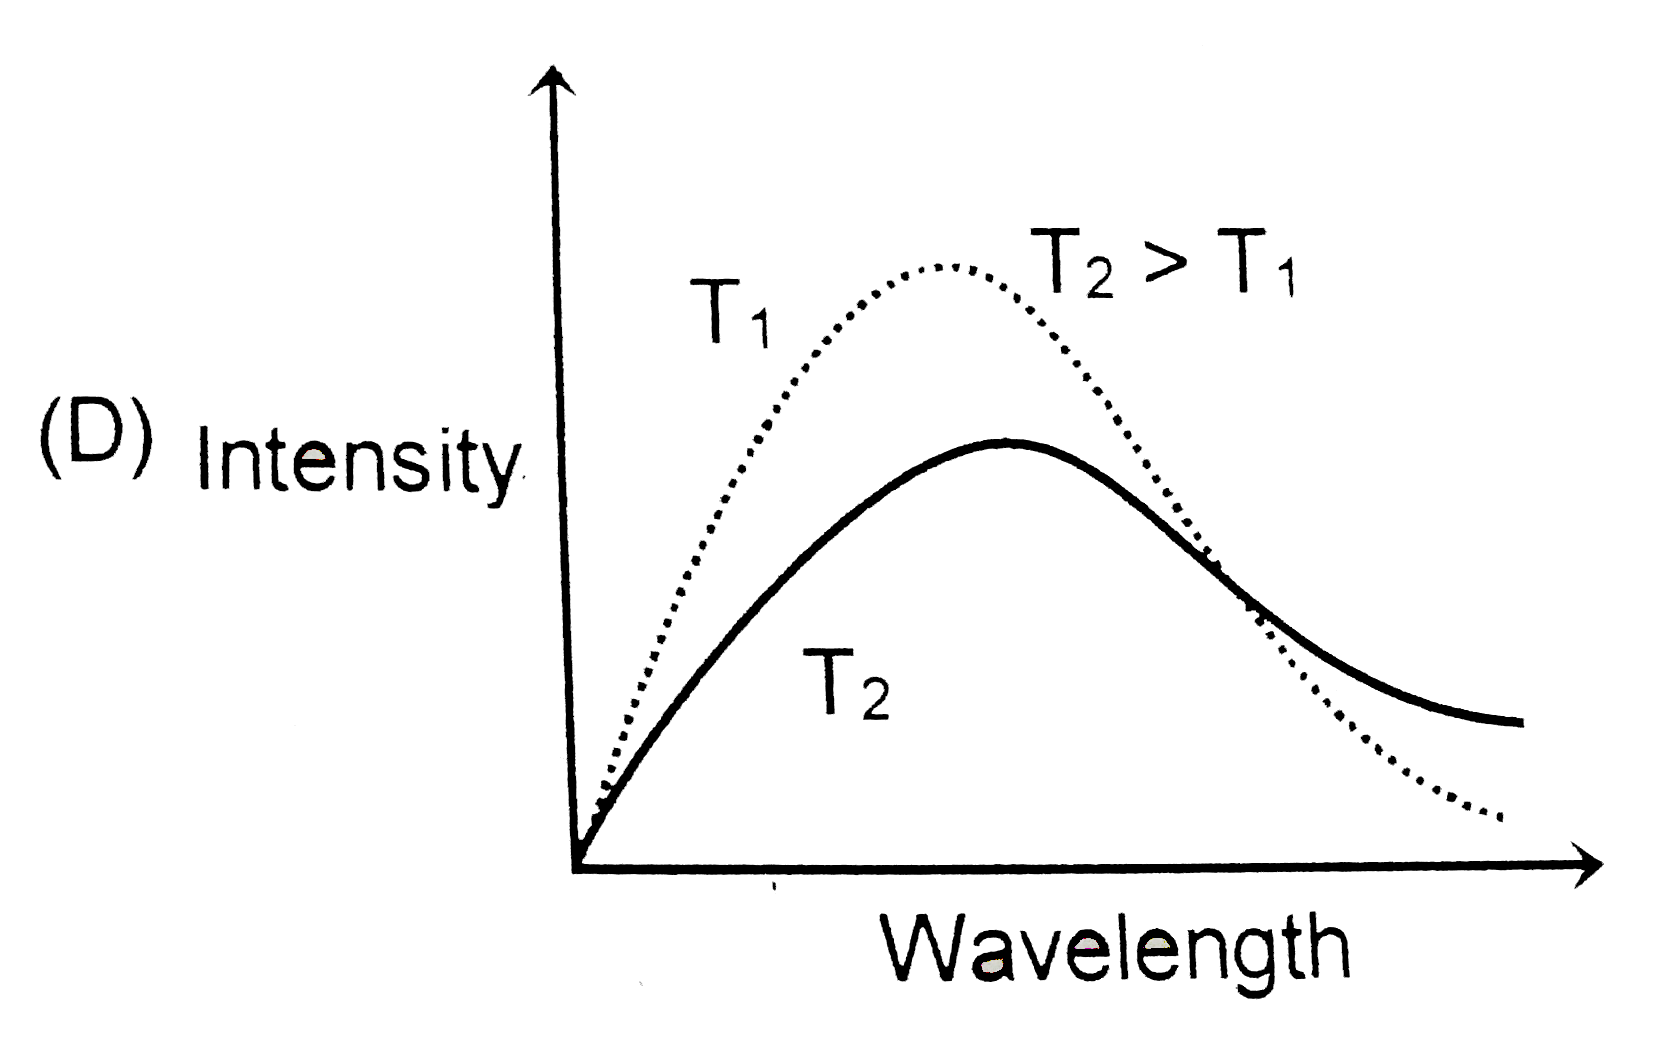
The amount of work done in an adiabatic expansion from temperature T to T1 is
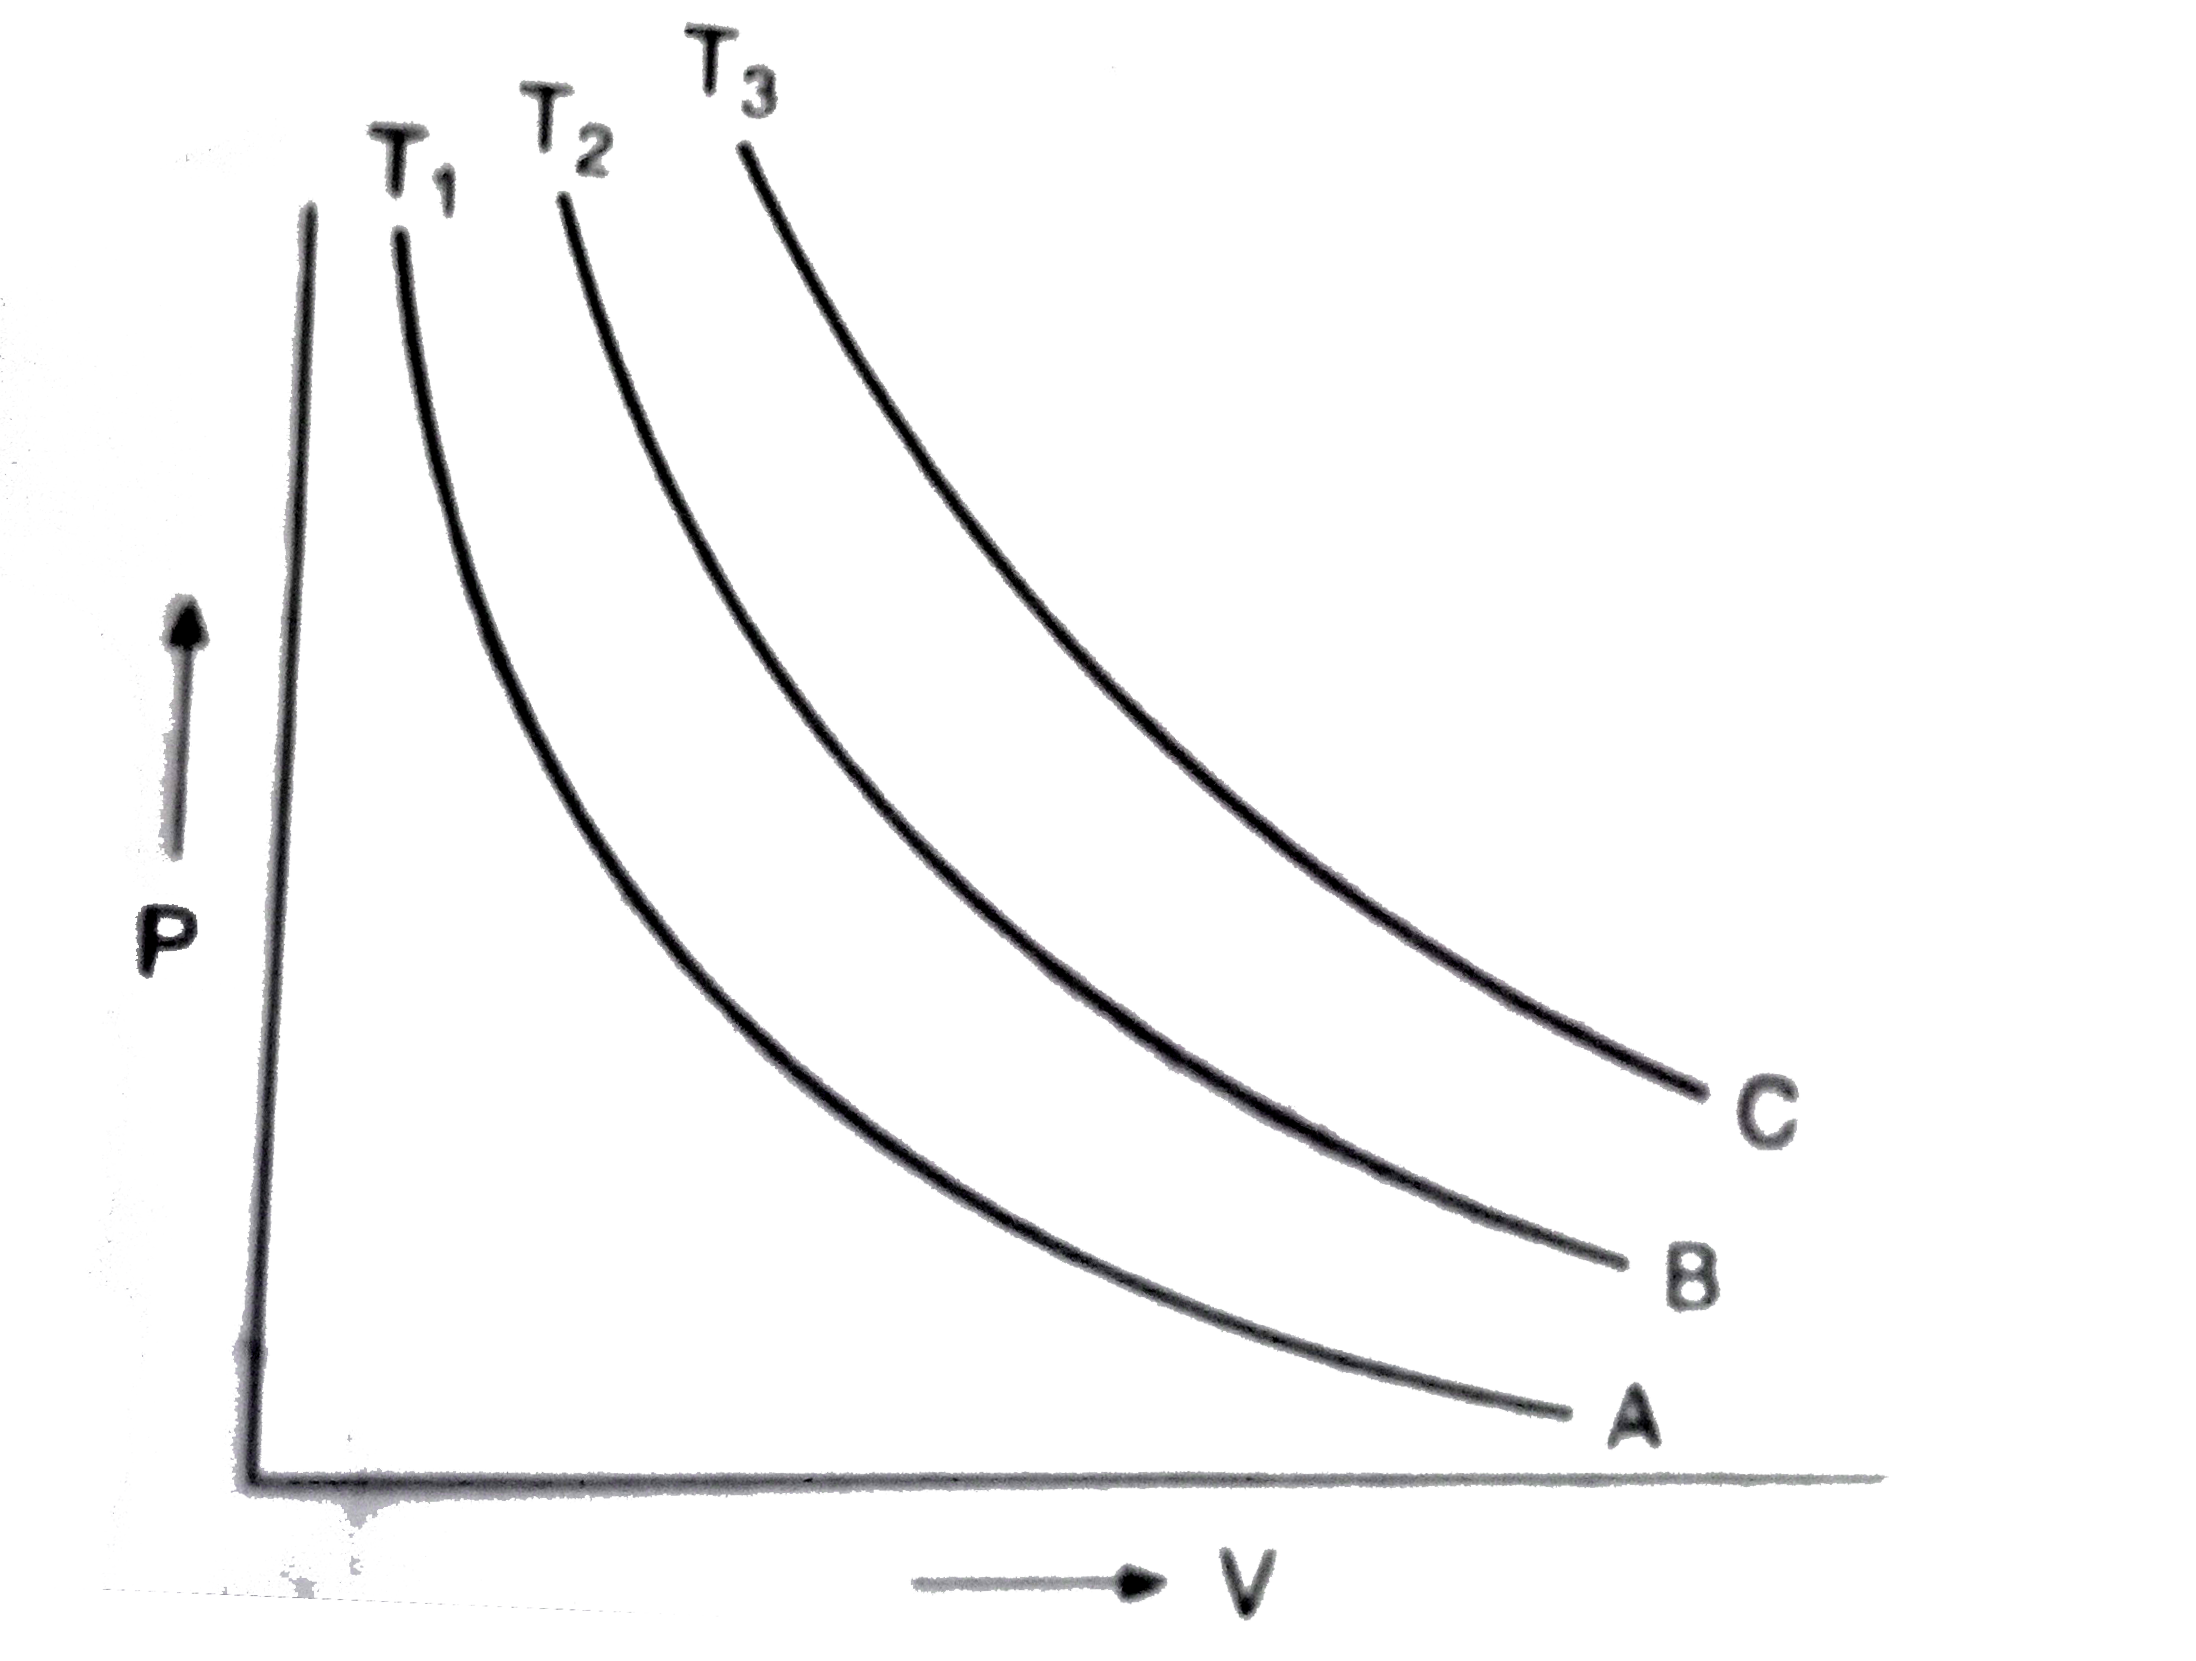
AR(T−T1)BRλ−1(T−T1)CRTDR(T−T1)(λ−1)The isothermal diagram of a gas at three different temperatures T1,T2and_(3), is show in the given figure .Then
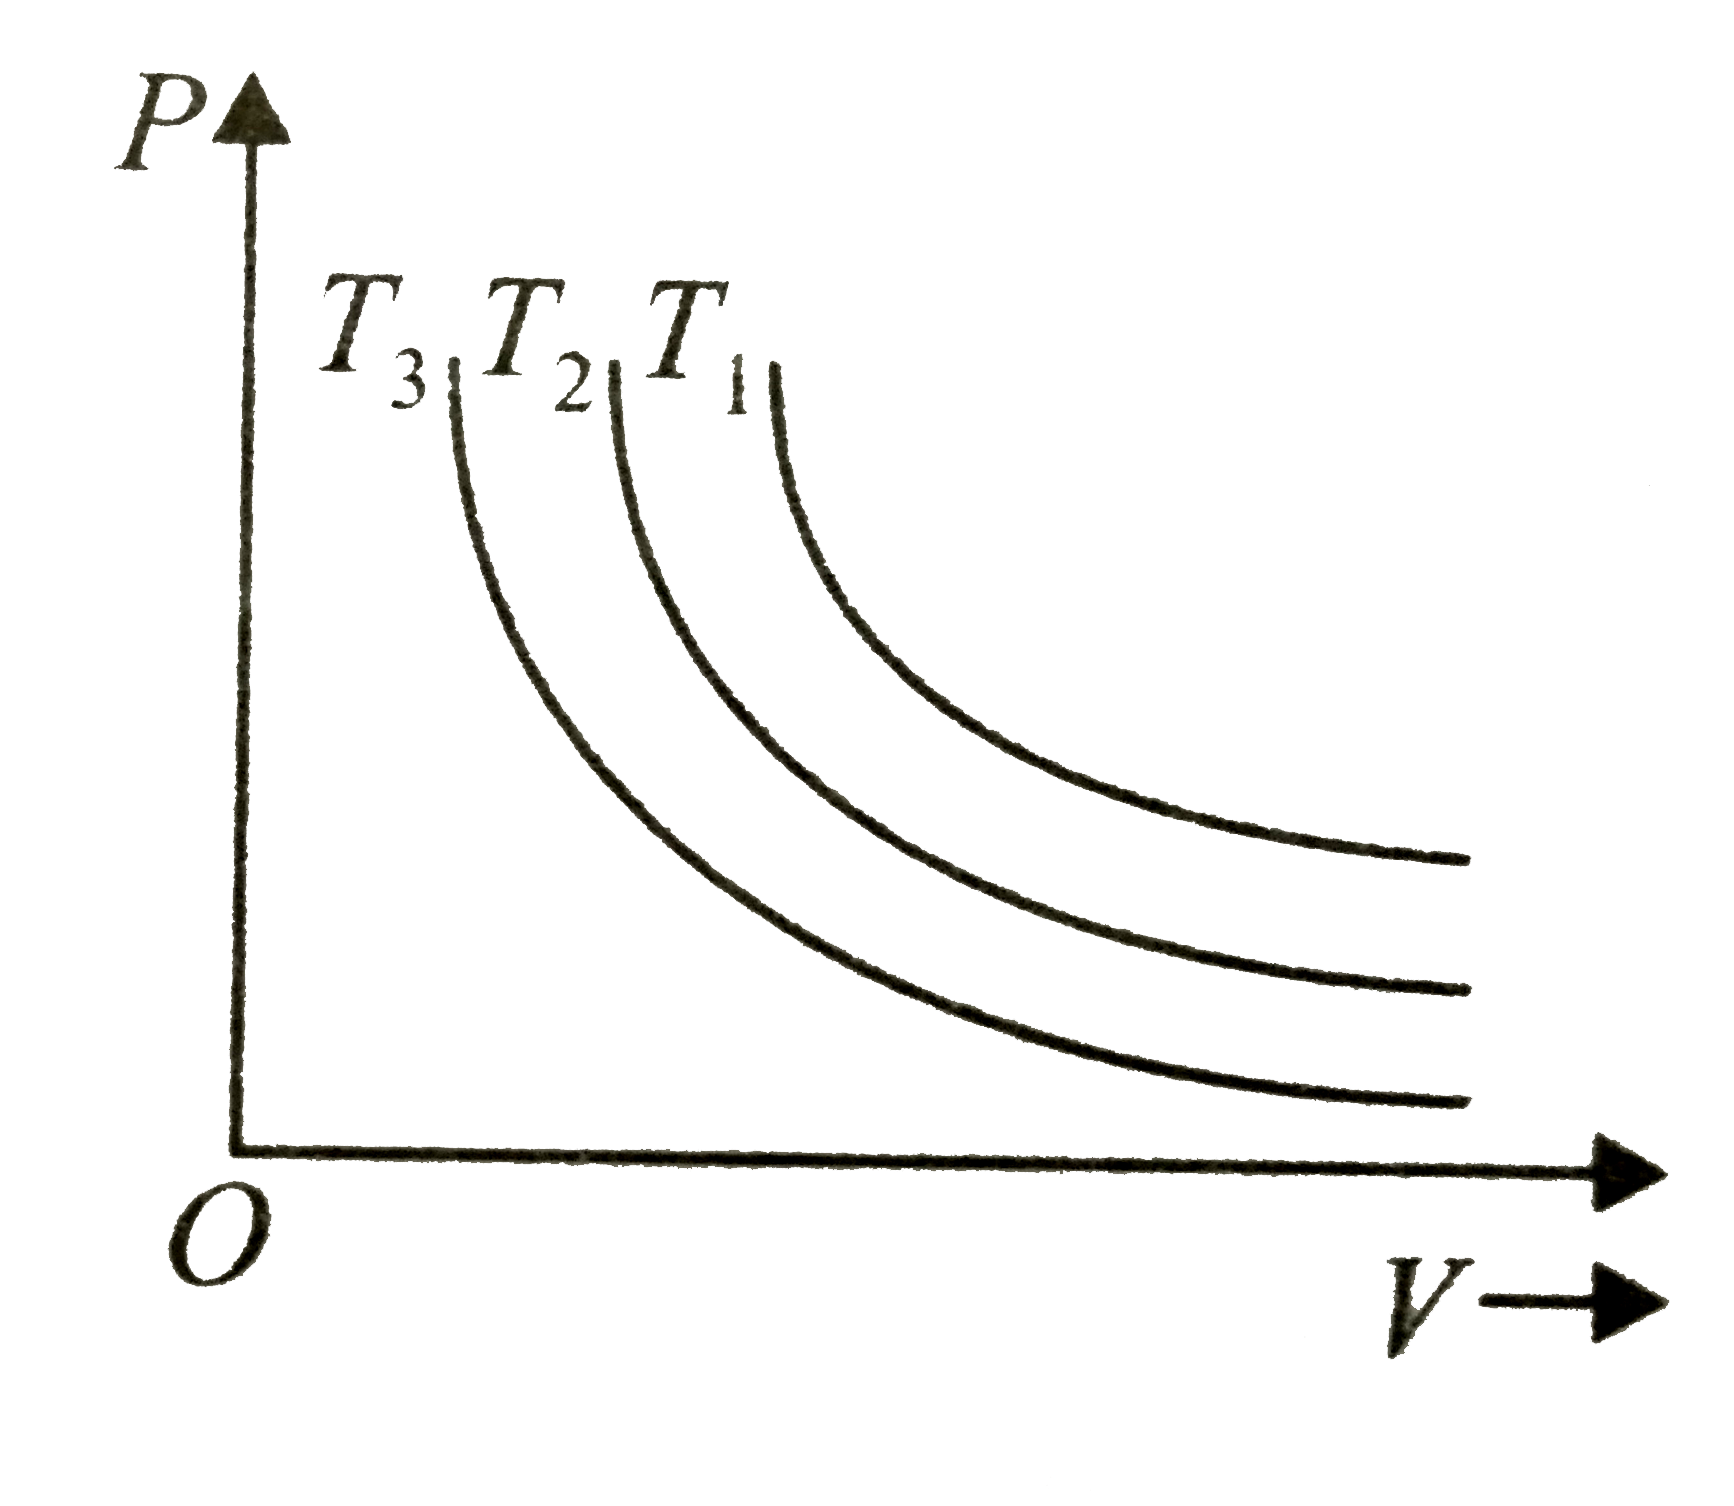 AT1<T2<T3BT1<T2>T3CT1>T2>T3DT1>T2<T3
Correct relation for isothermal reversible expansion of an ideal gas is
ΔS=0
ΔG=−TΔS
ΔH≠0
ΔU≠0
View SolutionEntrolpy change in isothermal expansion work of one mole of an ideal gas from volume V1 and V2 is given by
View SolutionFigure shows graphs of pressure versus density for an ideal gas at two temperatures T1 and T2 Which is correct ?
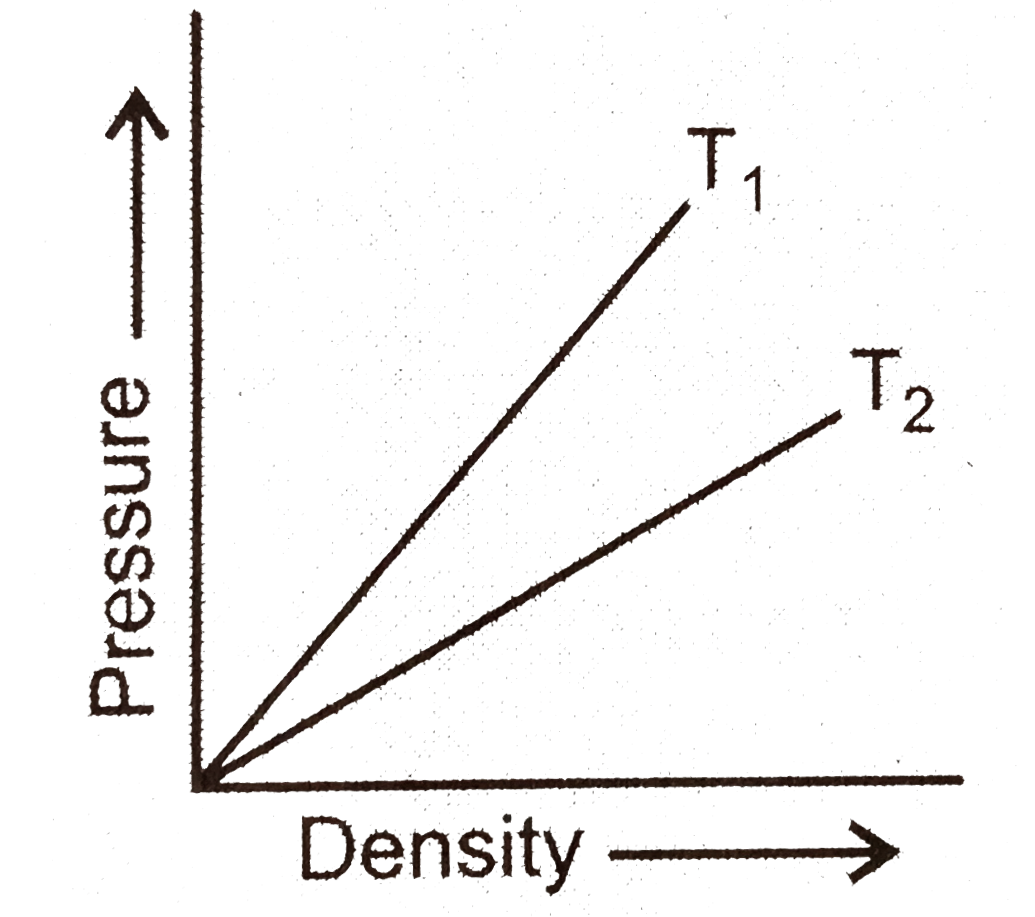 .
.
View SolutionTo calculate the amount of work done in joules during reversible isothermal expansion of an ideal gas, the volume must be expressed in
View SolutionIn following isothermal graphs A, B and C at temperatures T1,T2 and T3, the correct order of temperatures will be :
View Solution

