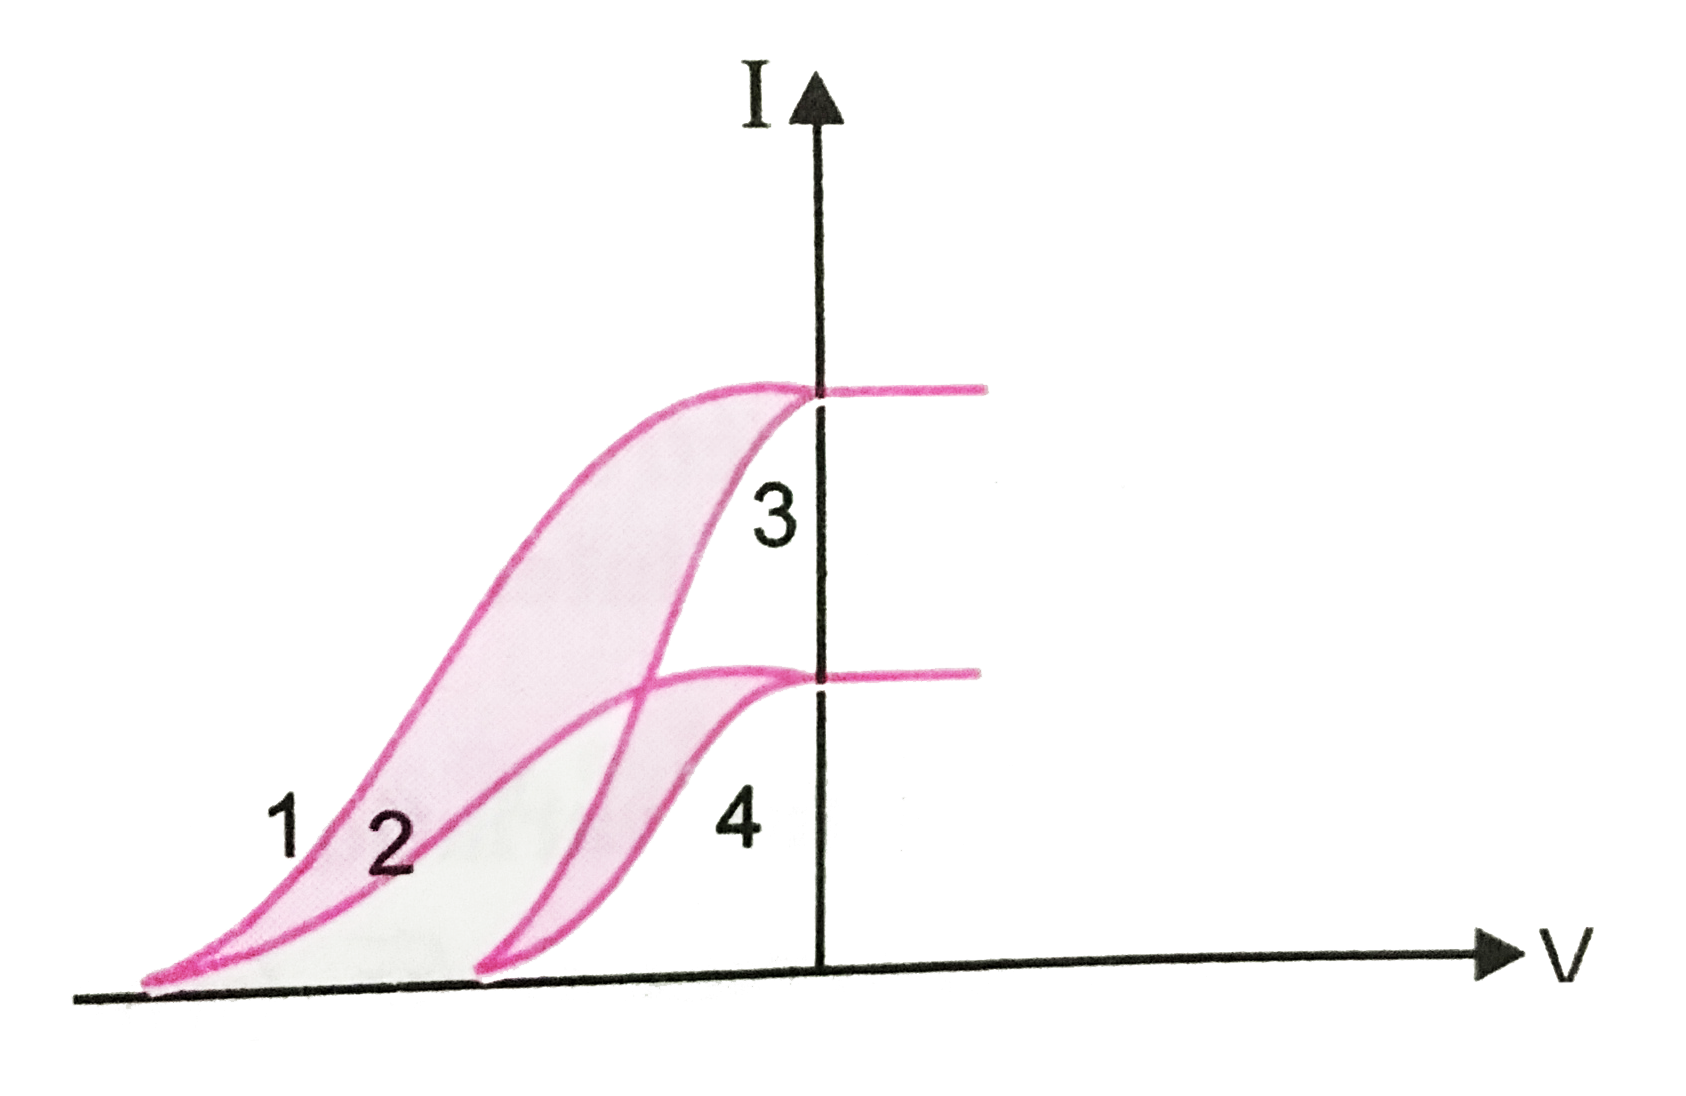
Draw a graph showing variation of photoelectric current (I) with anode potential ( V ) for different intensities of incident radiation. Name the characteristic of incident radiation that is kept constant in this experiment. Solution in Tamil
The frequency of incident radiation was kept constant.
Similar Questions
Draw and explain the graph showing the variation of stopping potential with frequency of incident radiation in relation to photoelectric effect.
View SolutionDefine photoelectric effect. Draw a graph to show the variation of stopping potential with frequency of incident radiation on a metal plate.
View SolutionDoes the 'stopping potential' in photoelectric emission depend upon
(i) the intensity of the incident radiation in a photocell. ?
(ii) The frequency of the incident radiation ?
View SolutionDraw graphs showing variation of photoelectric current with applied voltage for three incident radiations of equal frequency and different intensities. Mark the graph for the radiation of higher intensity.
View SolutionDraw a plot showing the variation of photoelectric current versus the intensity of incident radiation on a given photosensitive surface.
View SolutionExplain effect of variation of intensity of incident radiation on photoelectric current.
View SolutionThe graph of Fig. shows the variation of photoelectric current (I) versus applied voltage (V) for the two different photosensitive materials for two different intensities of the incident radiation. Identify the pairs of curves that correspond to different materials but same intensity of incident radiation.

View SolutionExplain the effect of increase of intensity of incident radiation on photoelectric current with suitable graphs.
View Solution

