The scatterplot in the standard (x,y) coordinate plane below contains data points showning a strong linear correlation between the variables x and y. Mia drew the line shown to model the data. One of the following equations represents Mia's line. Which one?
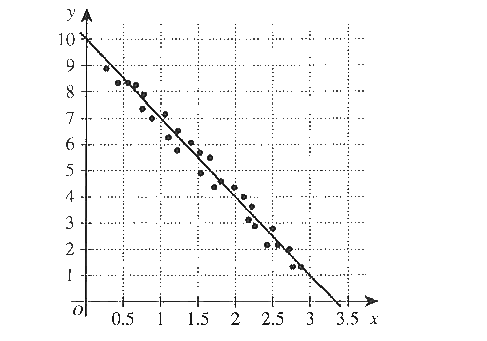
The correct Answer is:B
Step by step video, text & image solution for The scatterplot in the standard (x,y) coordinate plane below contains data points showning a strong linear correlation between the variables x and y. Mia drew the line shown to model the data. One of the following equations represents Mia's line. Which one? by Maths experts to help you in doubts & scoring excellent marks in Class 12 exams.
Updated on:21/07/2023Topper's Solved these Questions
Similar Questions
Knowledge Check
The graph in the standard (x,y) coordinate plane below is the graph of one of the following functions, which one?
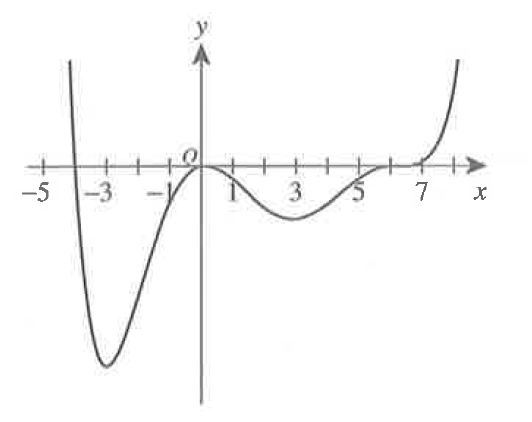 Ag(x)=x(x−6)(x+4)Bh(x)=x2(x+6)(x−4)Cn(x)=x2(x+6)3(x−4)Dp(x)=x2(x−6)3(x+4)
In the standard (x,y) coordinate plane, what is the slope of the line 3x+8y=5?
A−3B−38C35D3When graphed in the standard (x, y) coordinate plane, which of the following equations does NOT represent a line?
Ax=4B3y=6Cx−y=1Dx2+y=5
For the rectangle shown in the standard ( x, y) Coordinate plane below , what are the coordinate of the unlabeled vertex ?
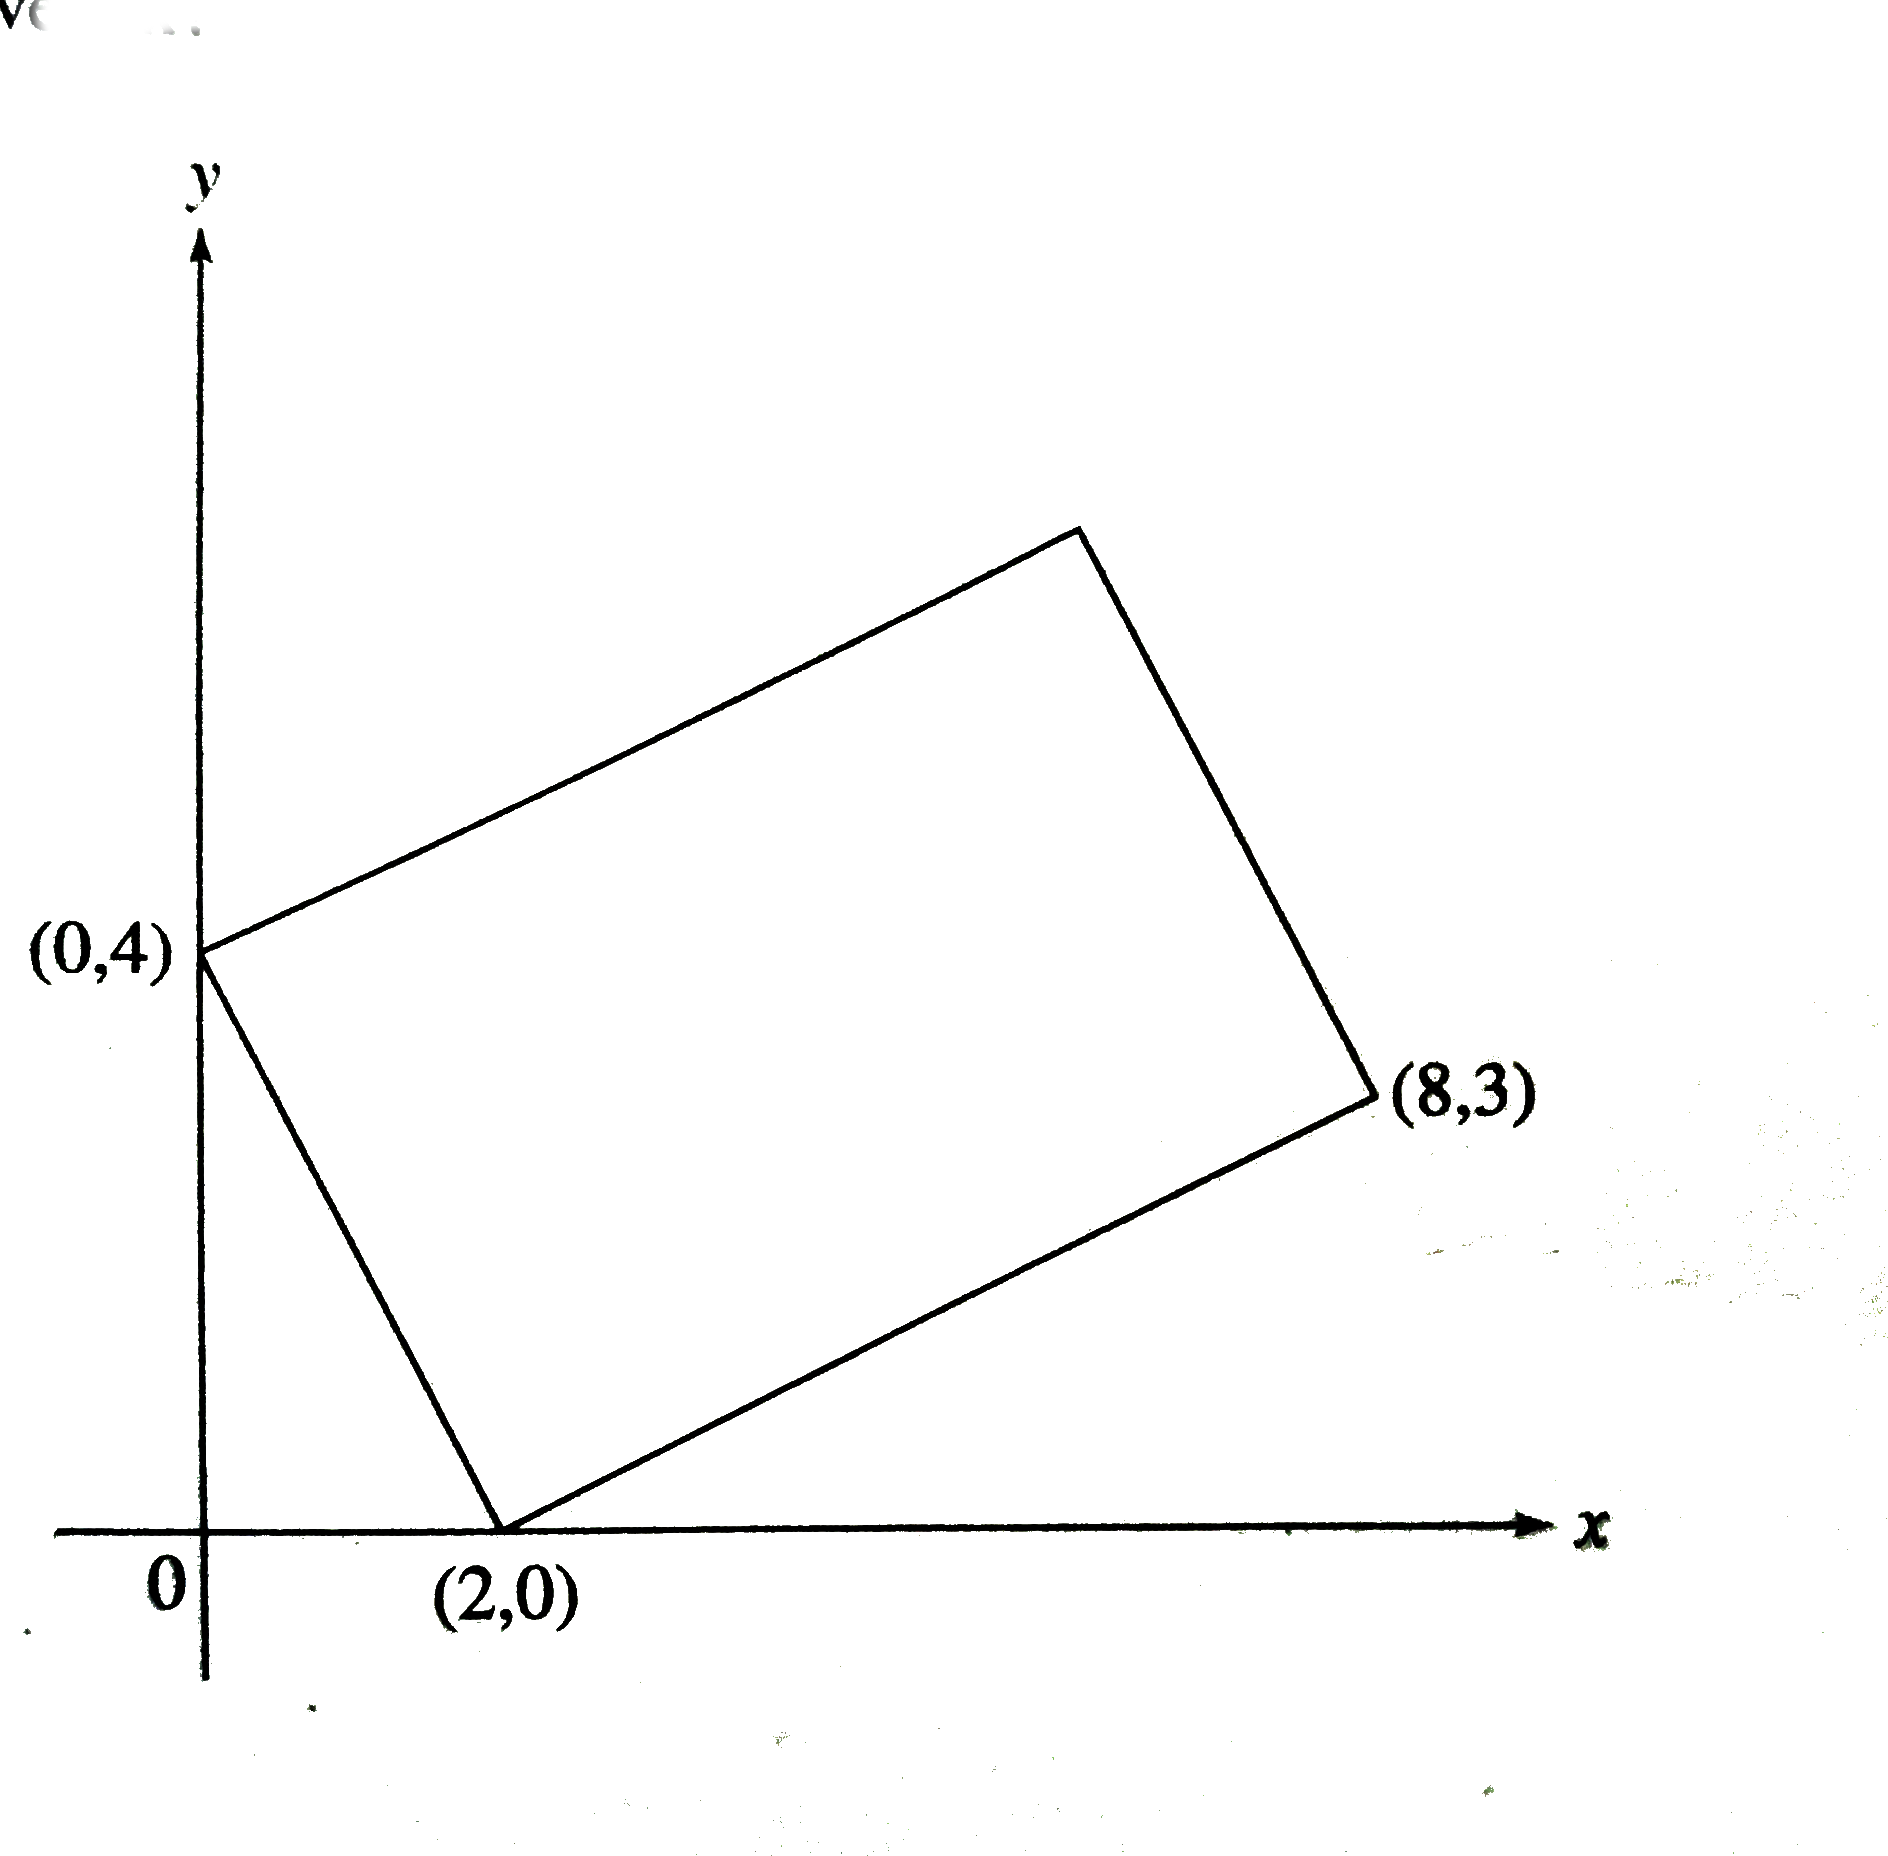
View SolutionThe graph of y=3−5sin(x−π) is shown in the standard (x,y) coordinate plane below. What is the range of y?
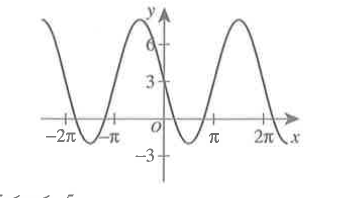
View Solution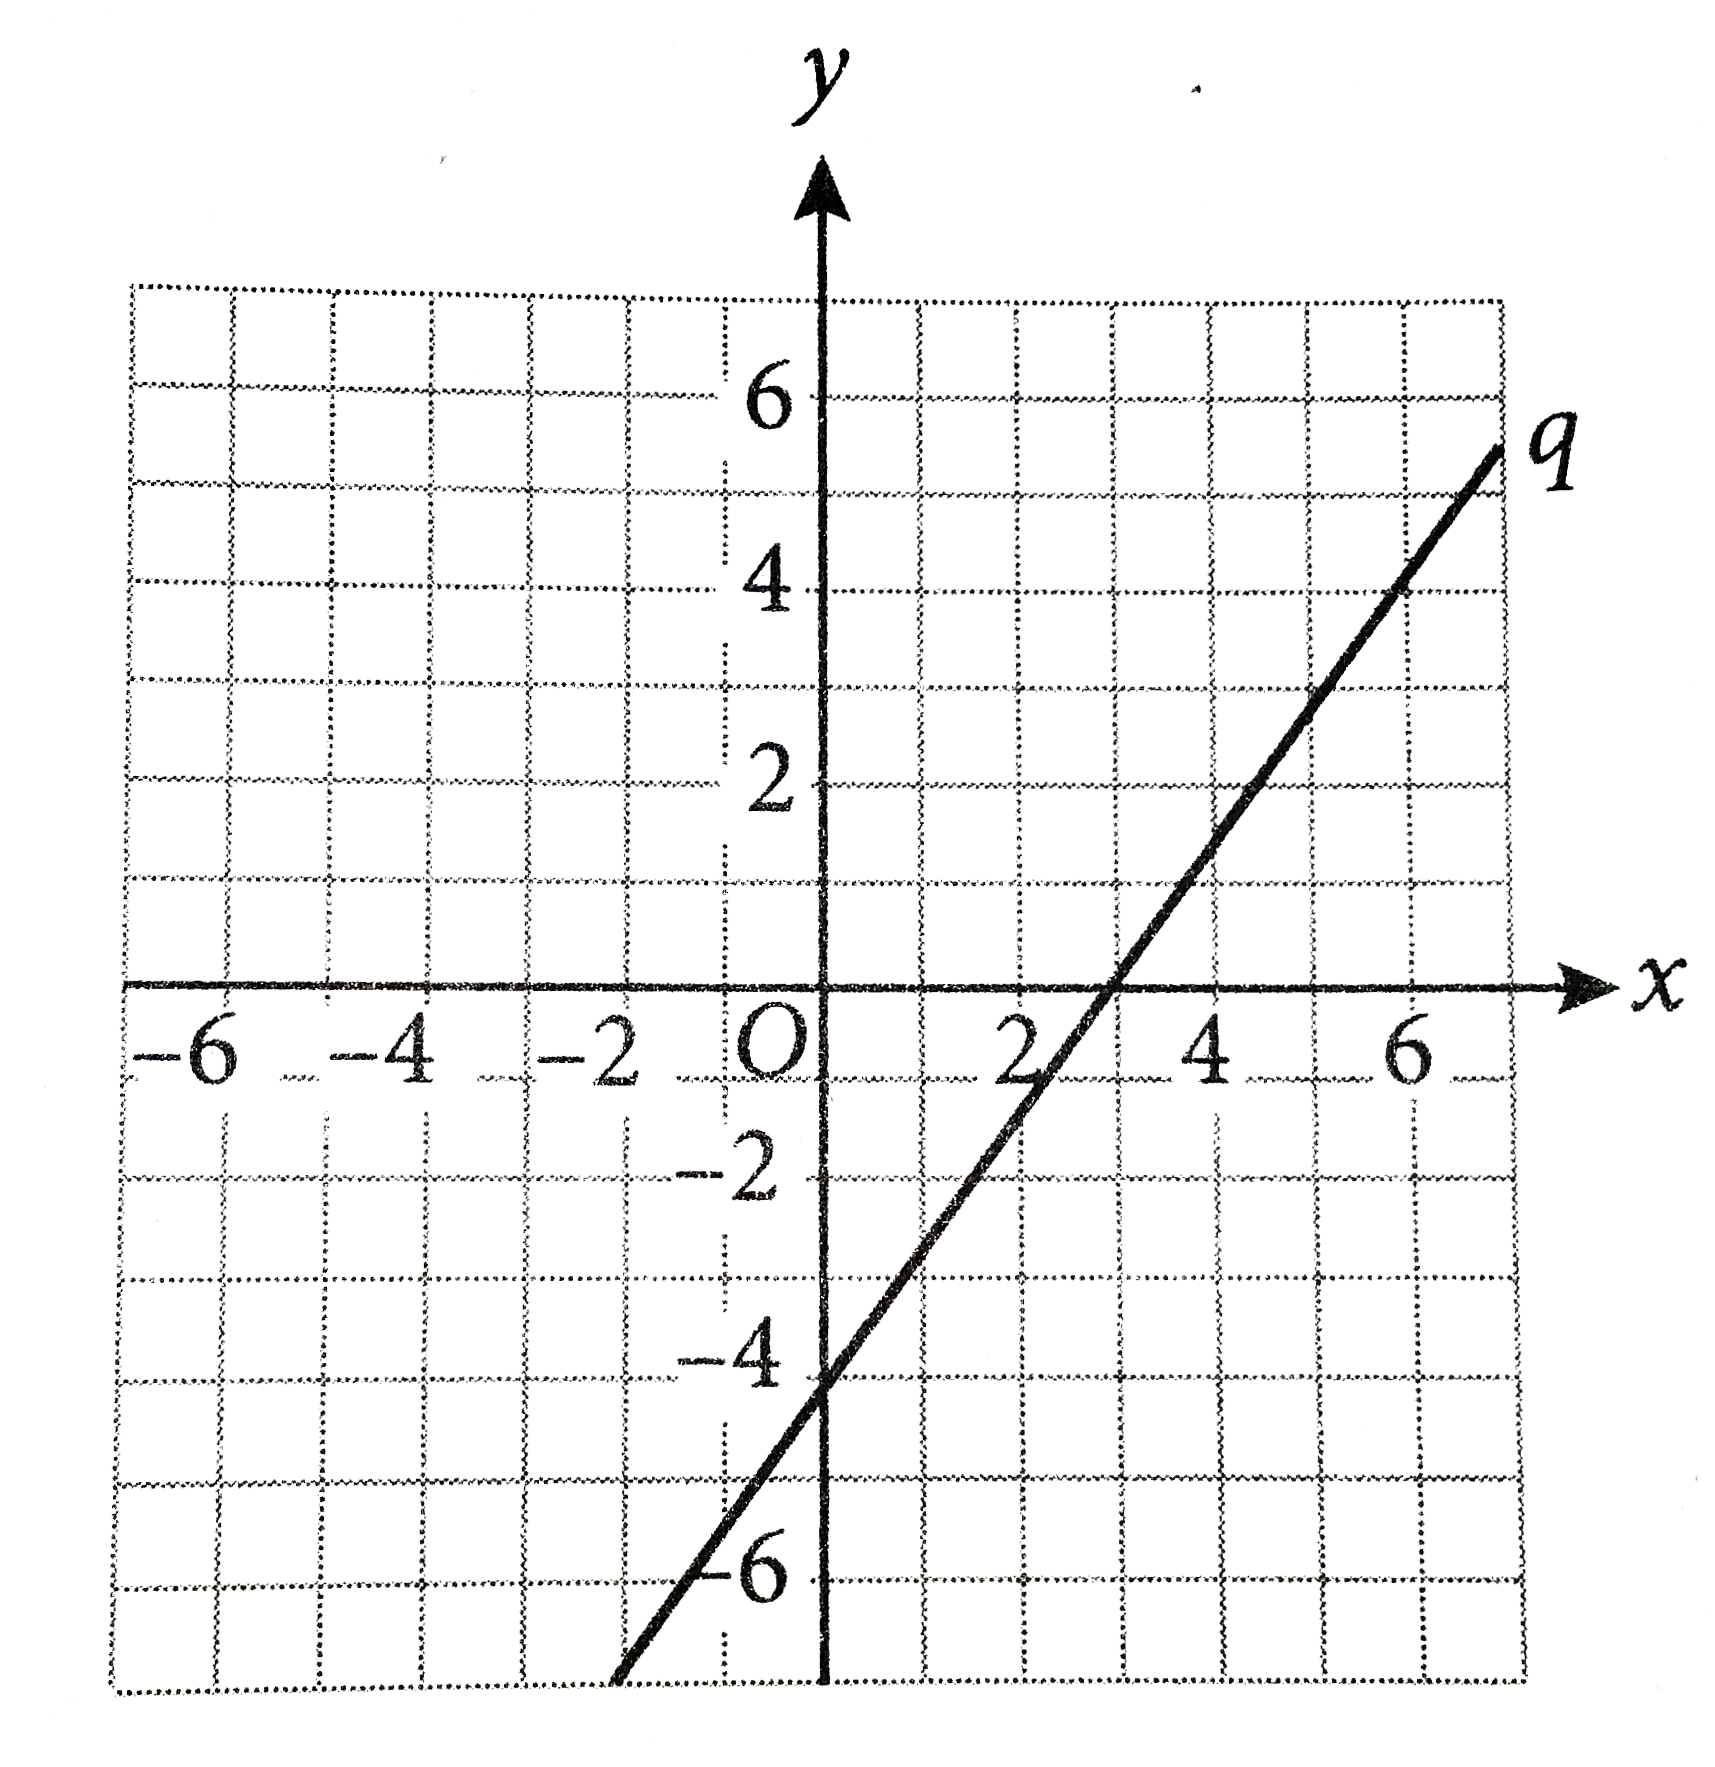
Line p (not shown) is perpendicular to line q shown above and passes through the point (0,4). Which of the following equations could represent line p?
View SolutionWhat is the y-intercept of the line in the standard (x,y) coordinate plane that goes through the points (-3,6) and (3,2) ?
View SolutionIn the standard (x, y) coordinate plane, what is the slope of the line segement joining the points (3, -5) and (7, 2) ?
View Solution
