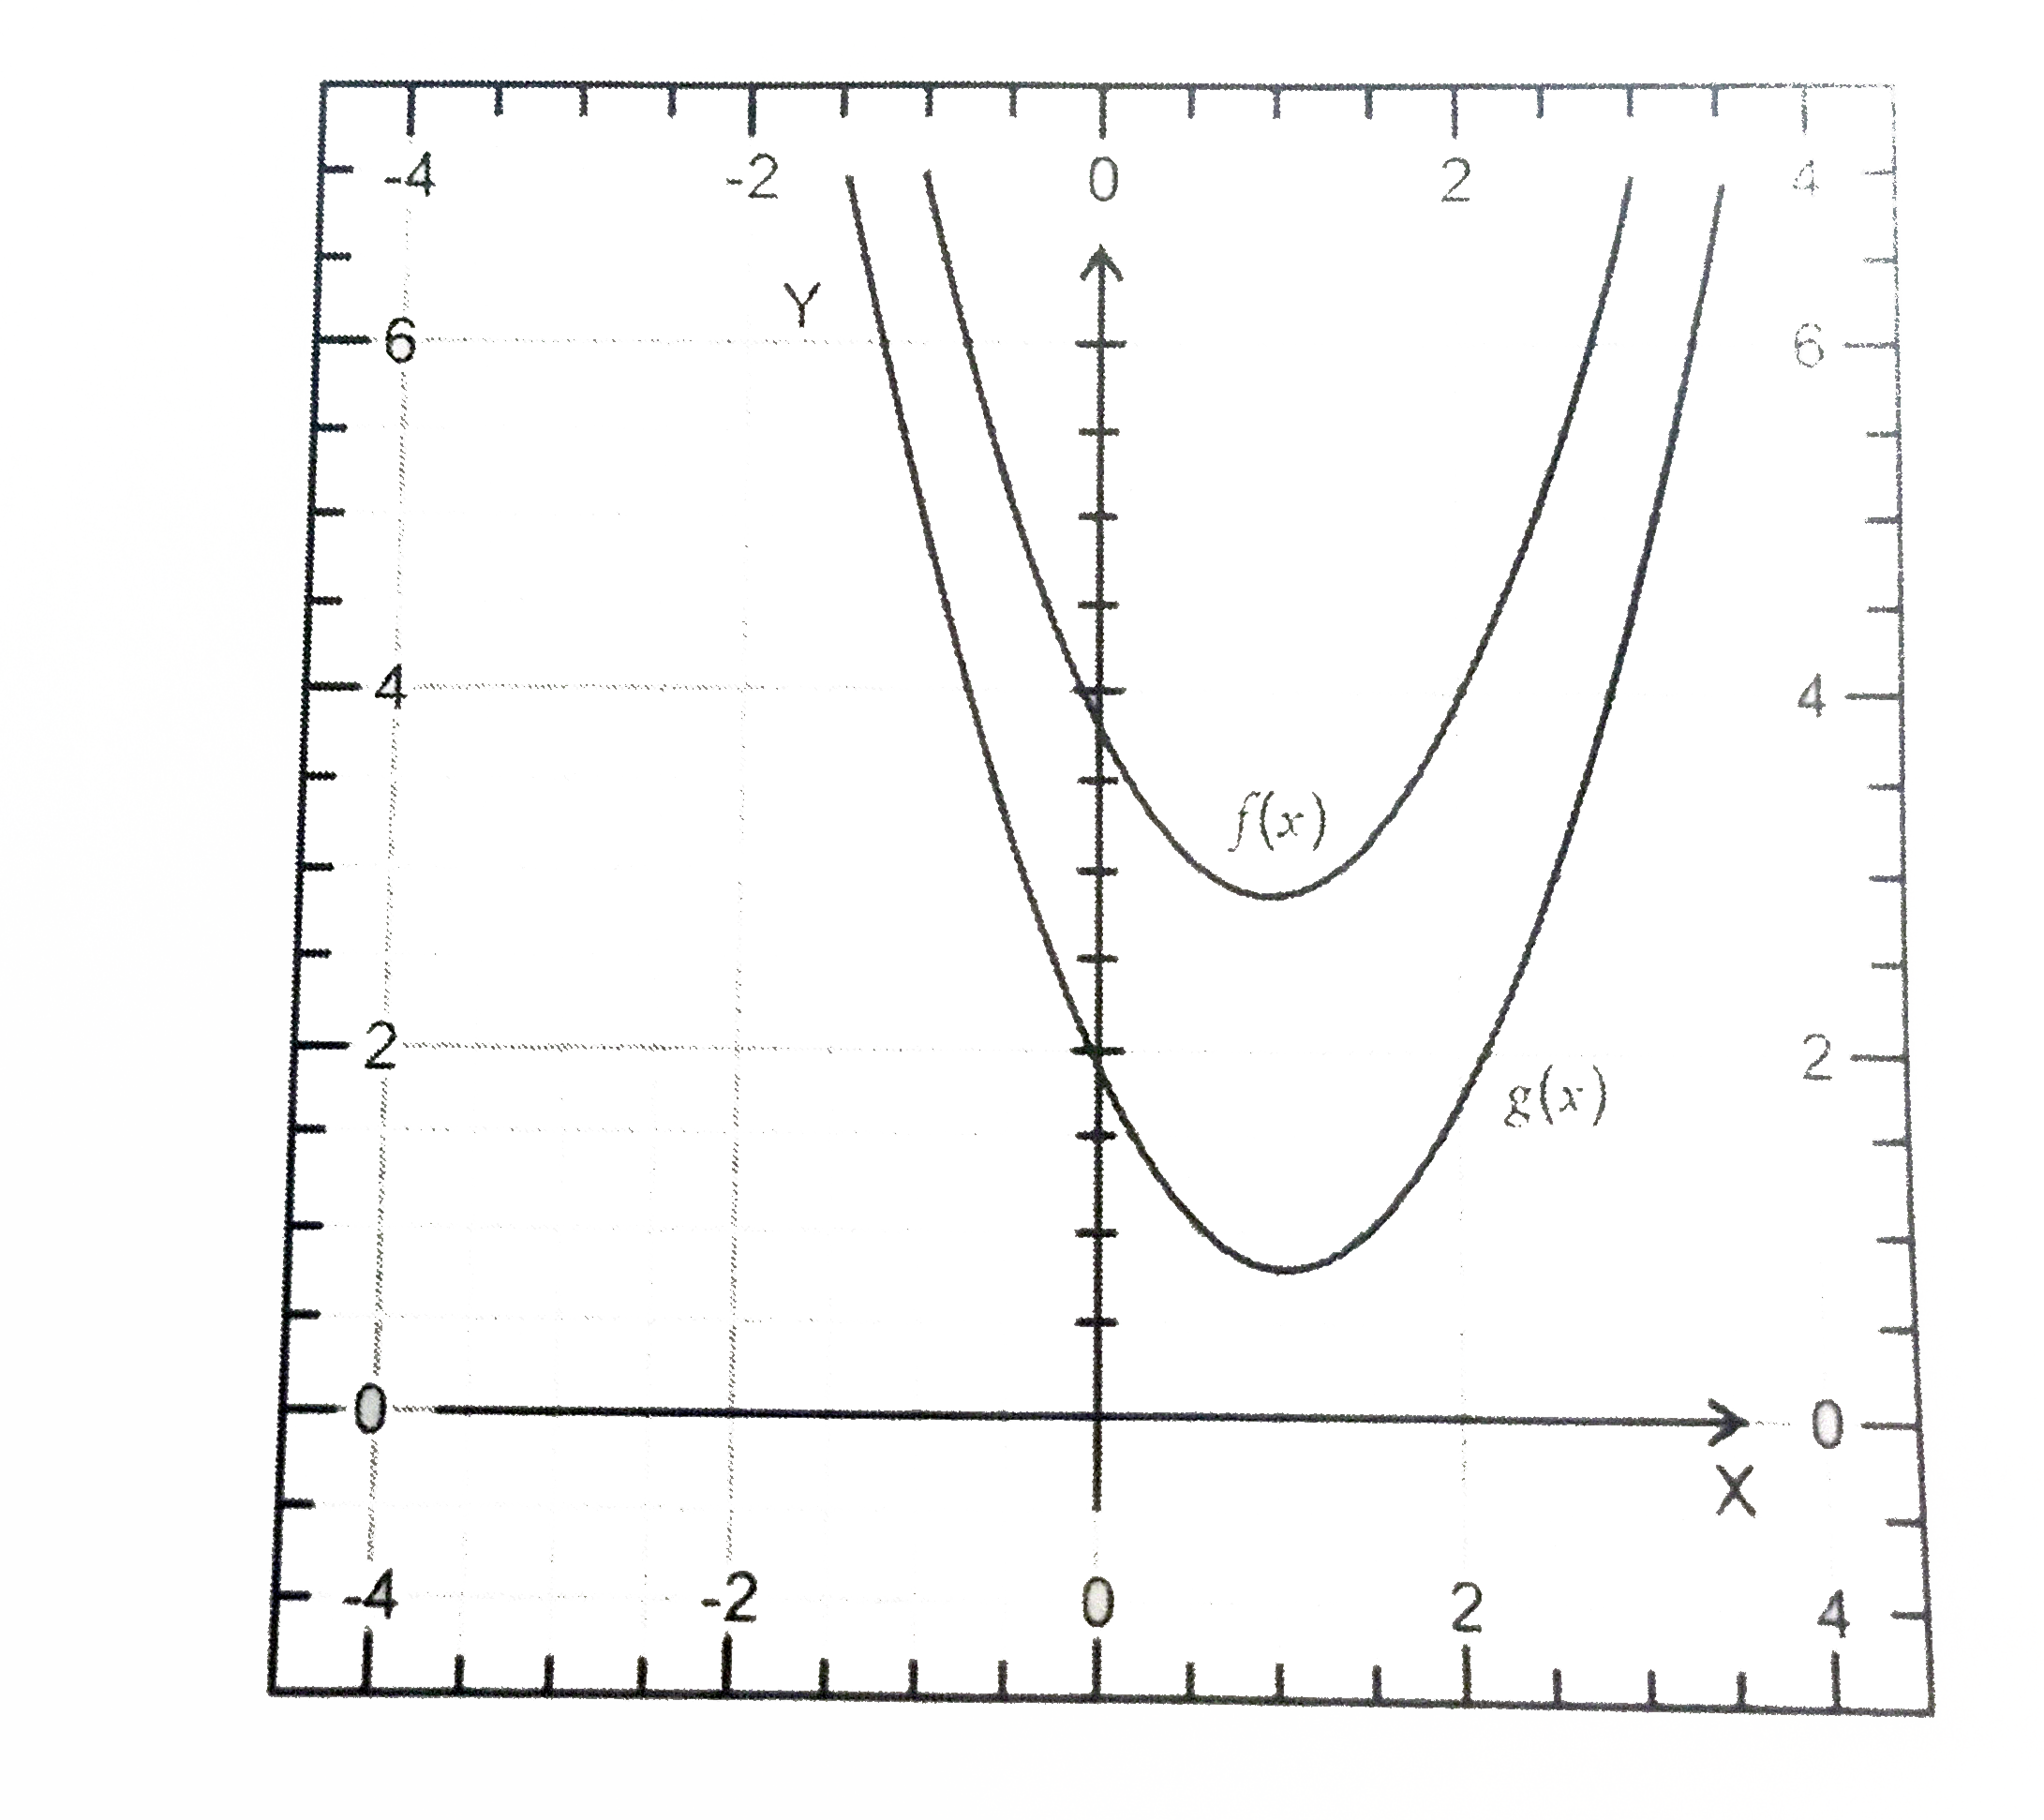
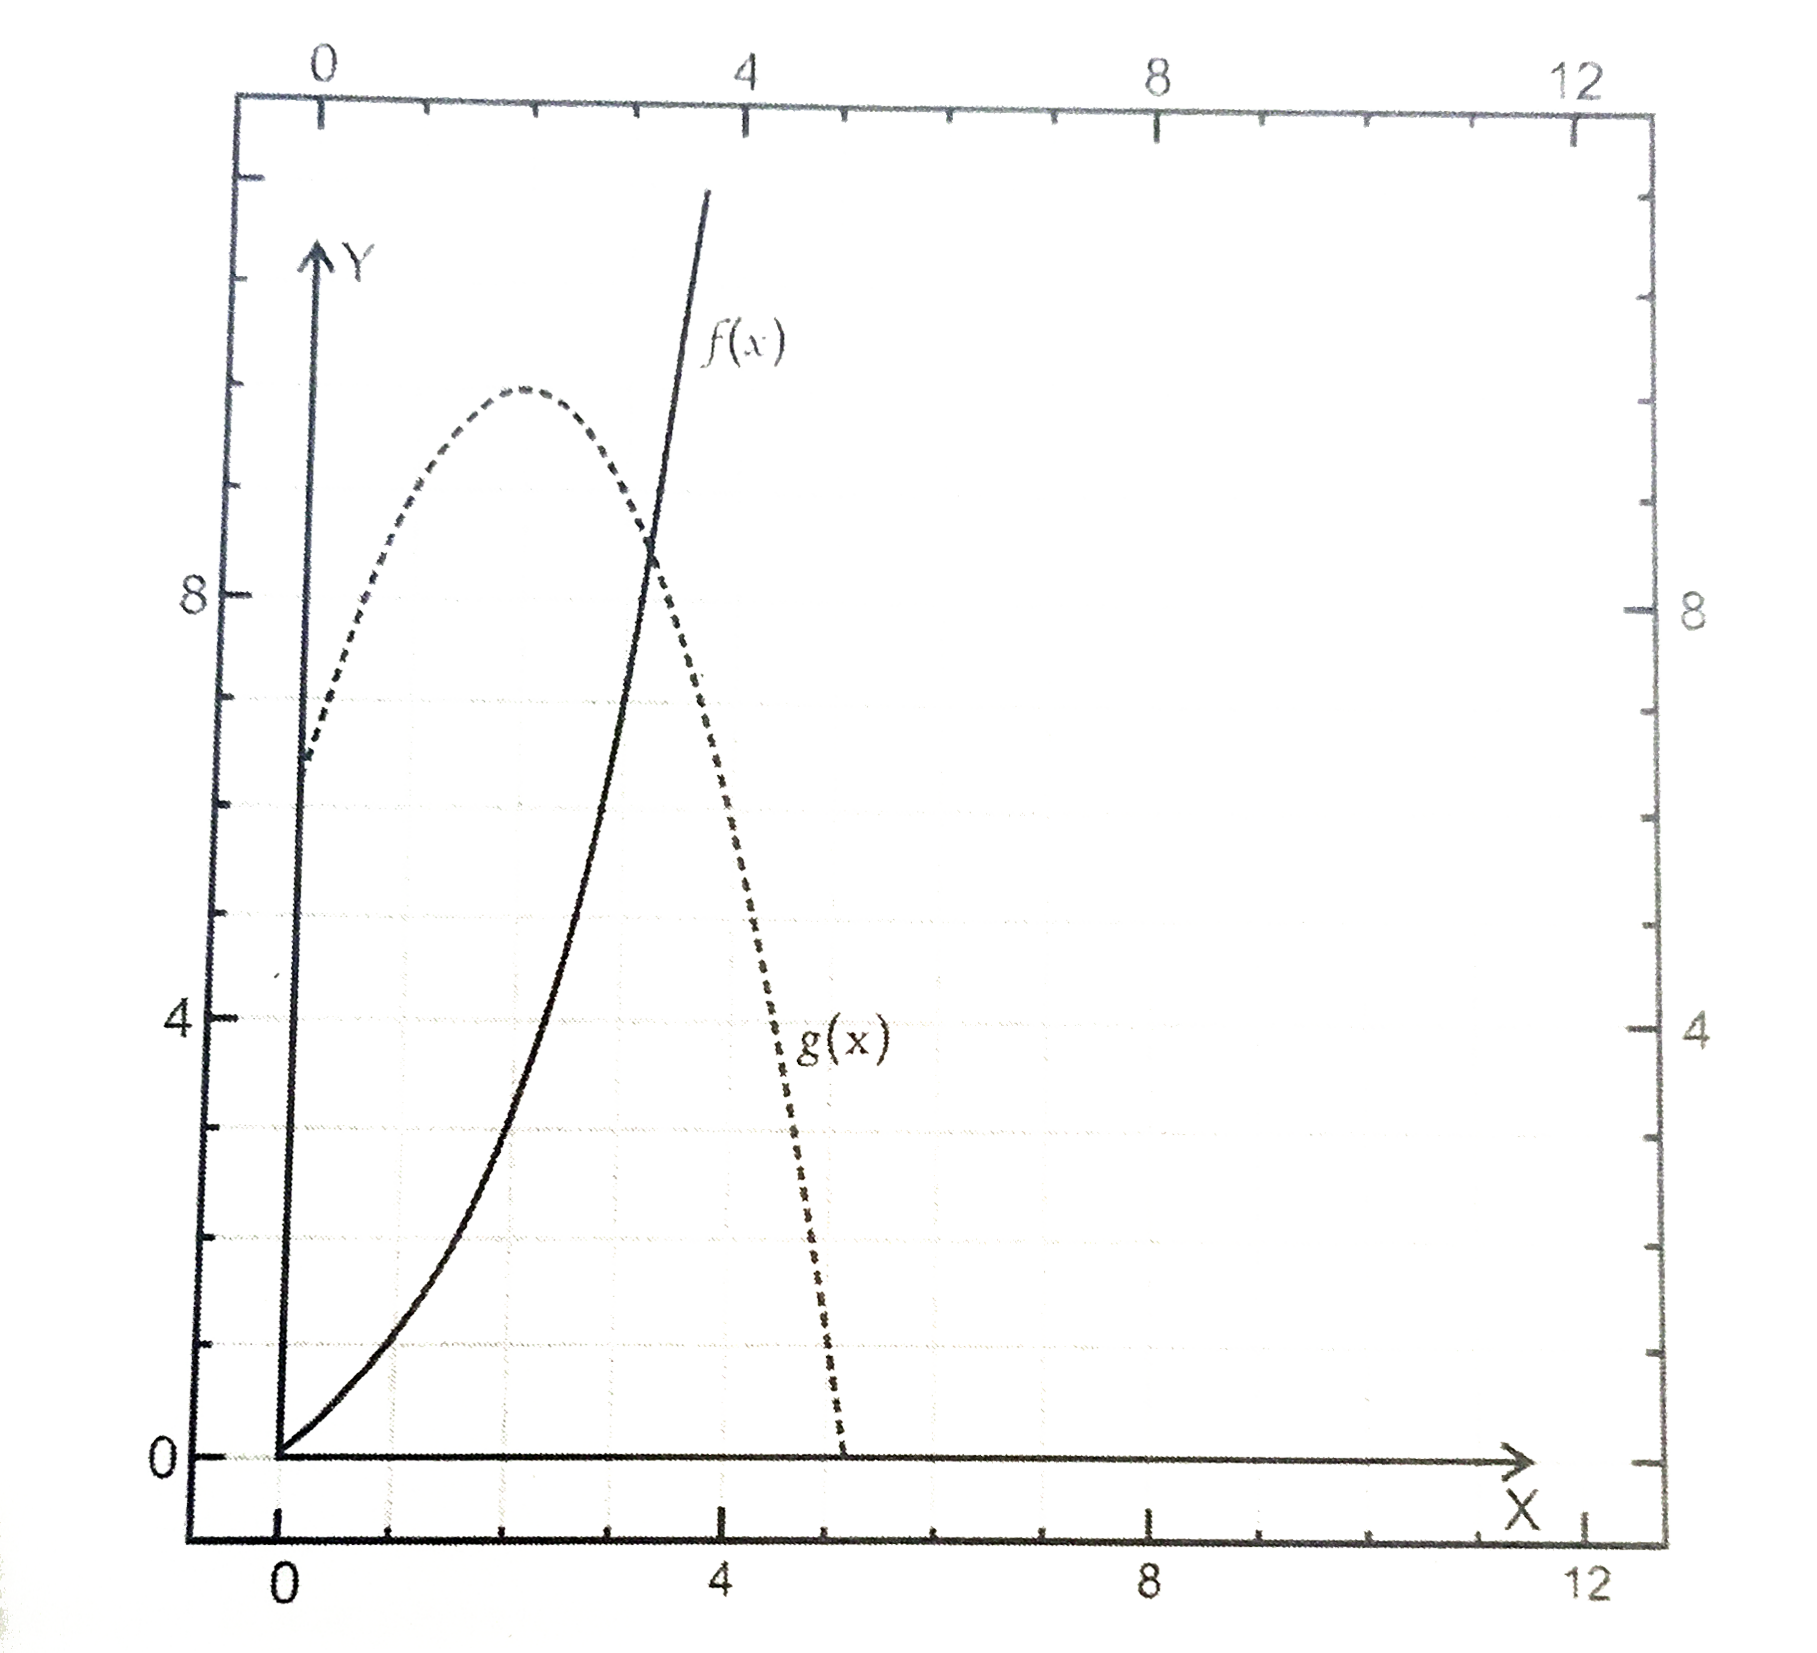
The graph of f(x) and g(x) are shown below. Which option is true?
f(x)=g(x+2)
f(x)=g(x)+2
f(x)=g(x−2)
f(x)=g(x)−2
The correct Answer is:B
Step by step video, text & image solution for The graph of f(x) and g(x) are shown below. Which option is true? by Maths experts to help you in doubts & scoring excellent marks in Class 12 exams.
Updated on:21/07/2023Topper's Solved these Questions
Similar Questions
The equation of a tangent to the parabola y2=8xisy=x+2 . The point on this line from which the other tangent to the parabola is perpendicular to the given tangent is (1) (−1,1) (2) (0,2) (3) (2,4) (4) (−2,0)
View Solution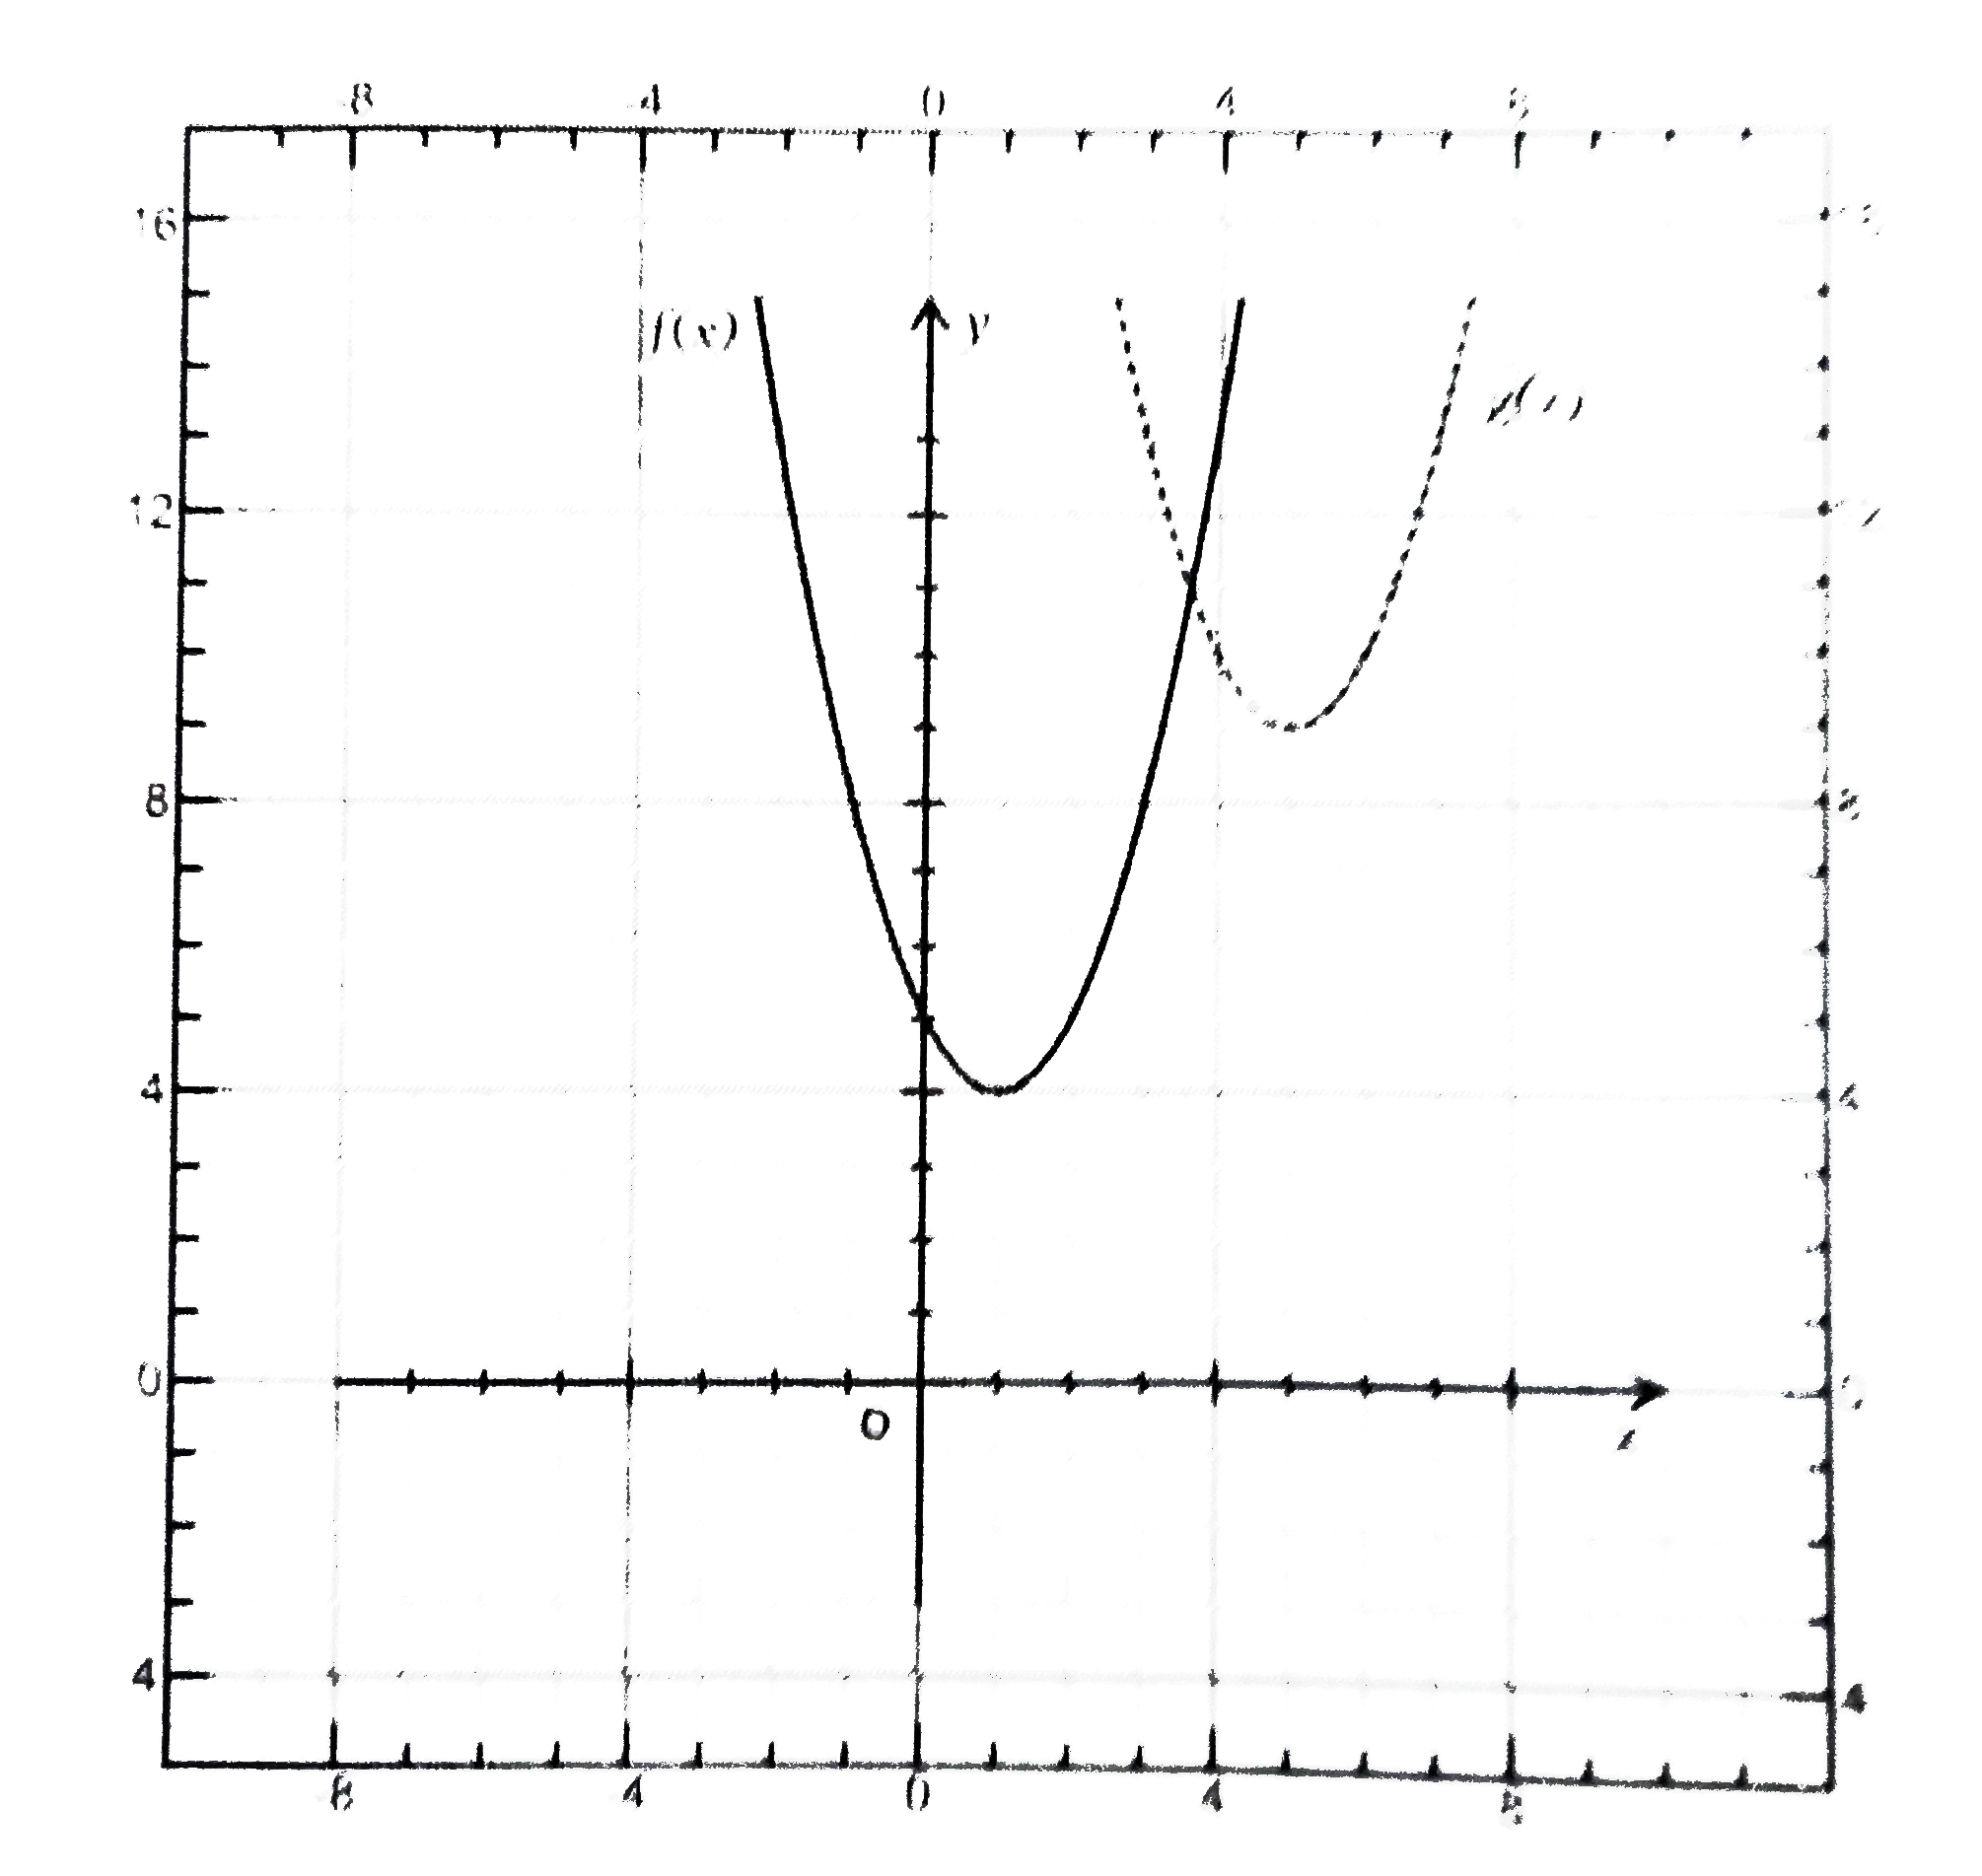
The graph of f(x) and g(x) are shown below. If g(x) = f(x + k) - m , what is the value of |k + m| ?
View Solution
Knowledge Check
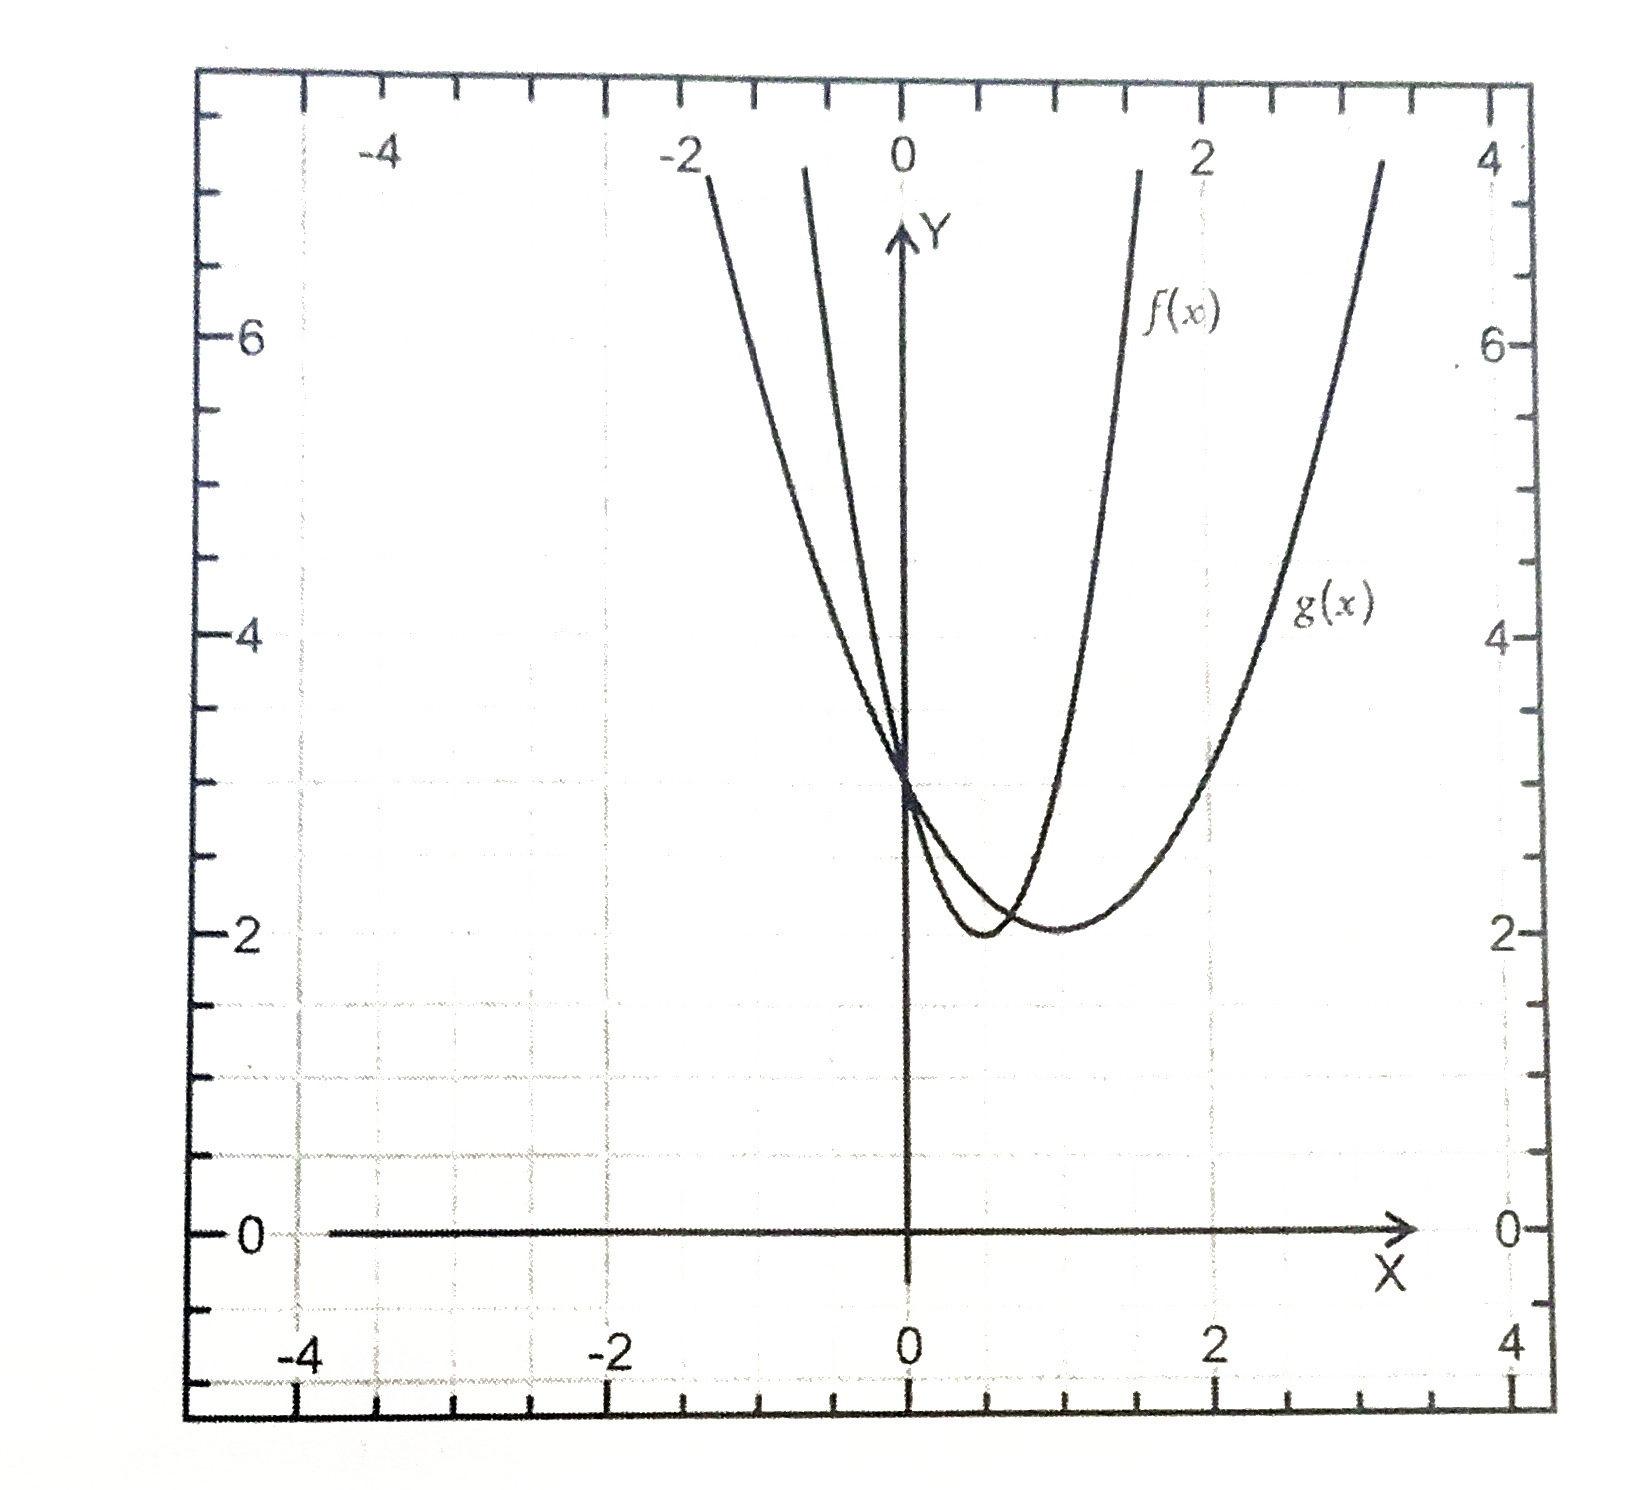
The graphs of f(x) and g(x) are shown below. Which option is true?Af(x)=g(x+1)Bf(x)=g(x)+1Cf(x)=2g(x)Df(x)=g(2x)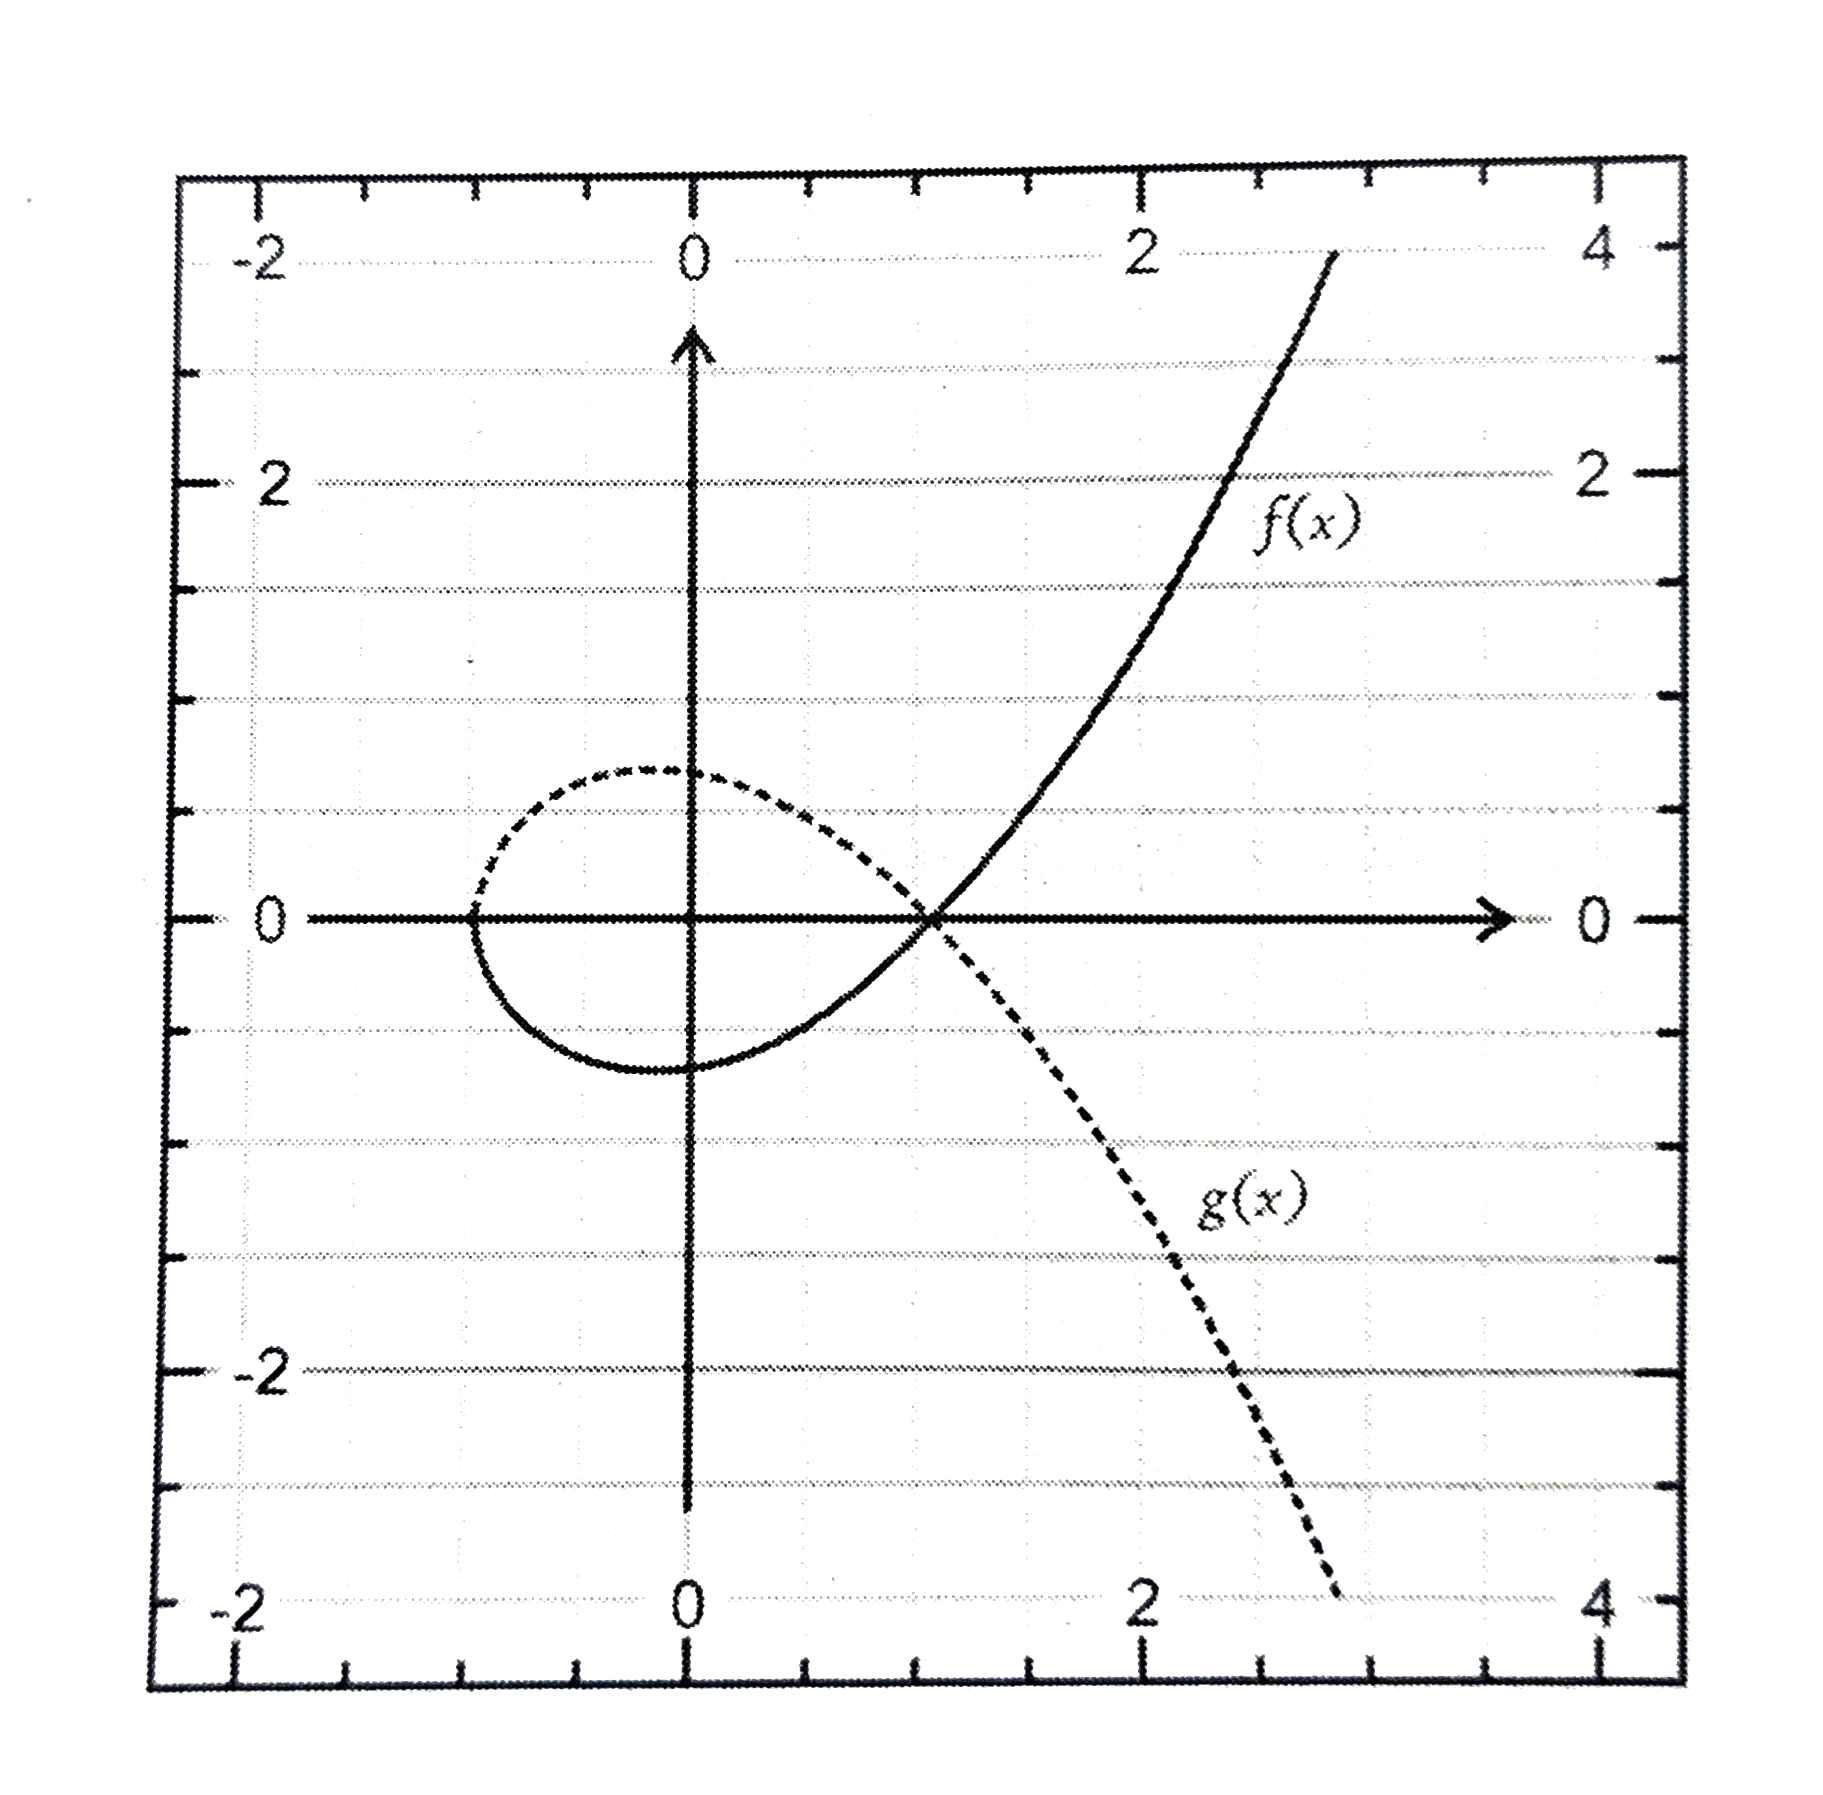
The graph of f(x) and g(x) are shown above . Which options is true ?Af(x)=g(−x)Bf(x)=g(x)−xCf(x)=−g(x)Df(x)=−g(−x)The graph of y=f(x) is shown below.
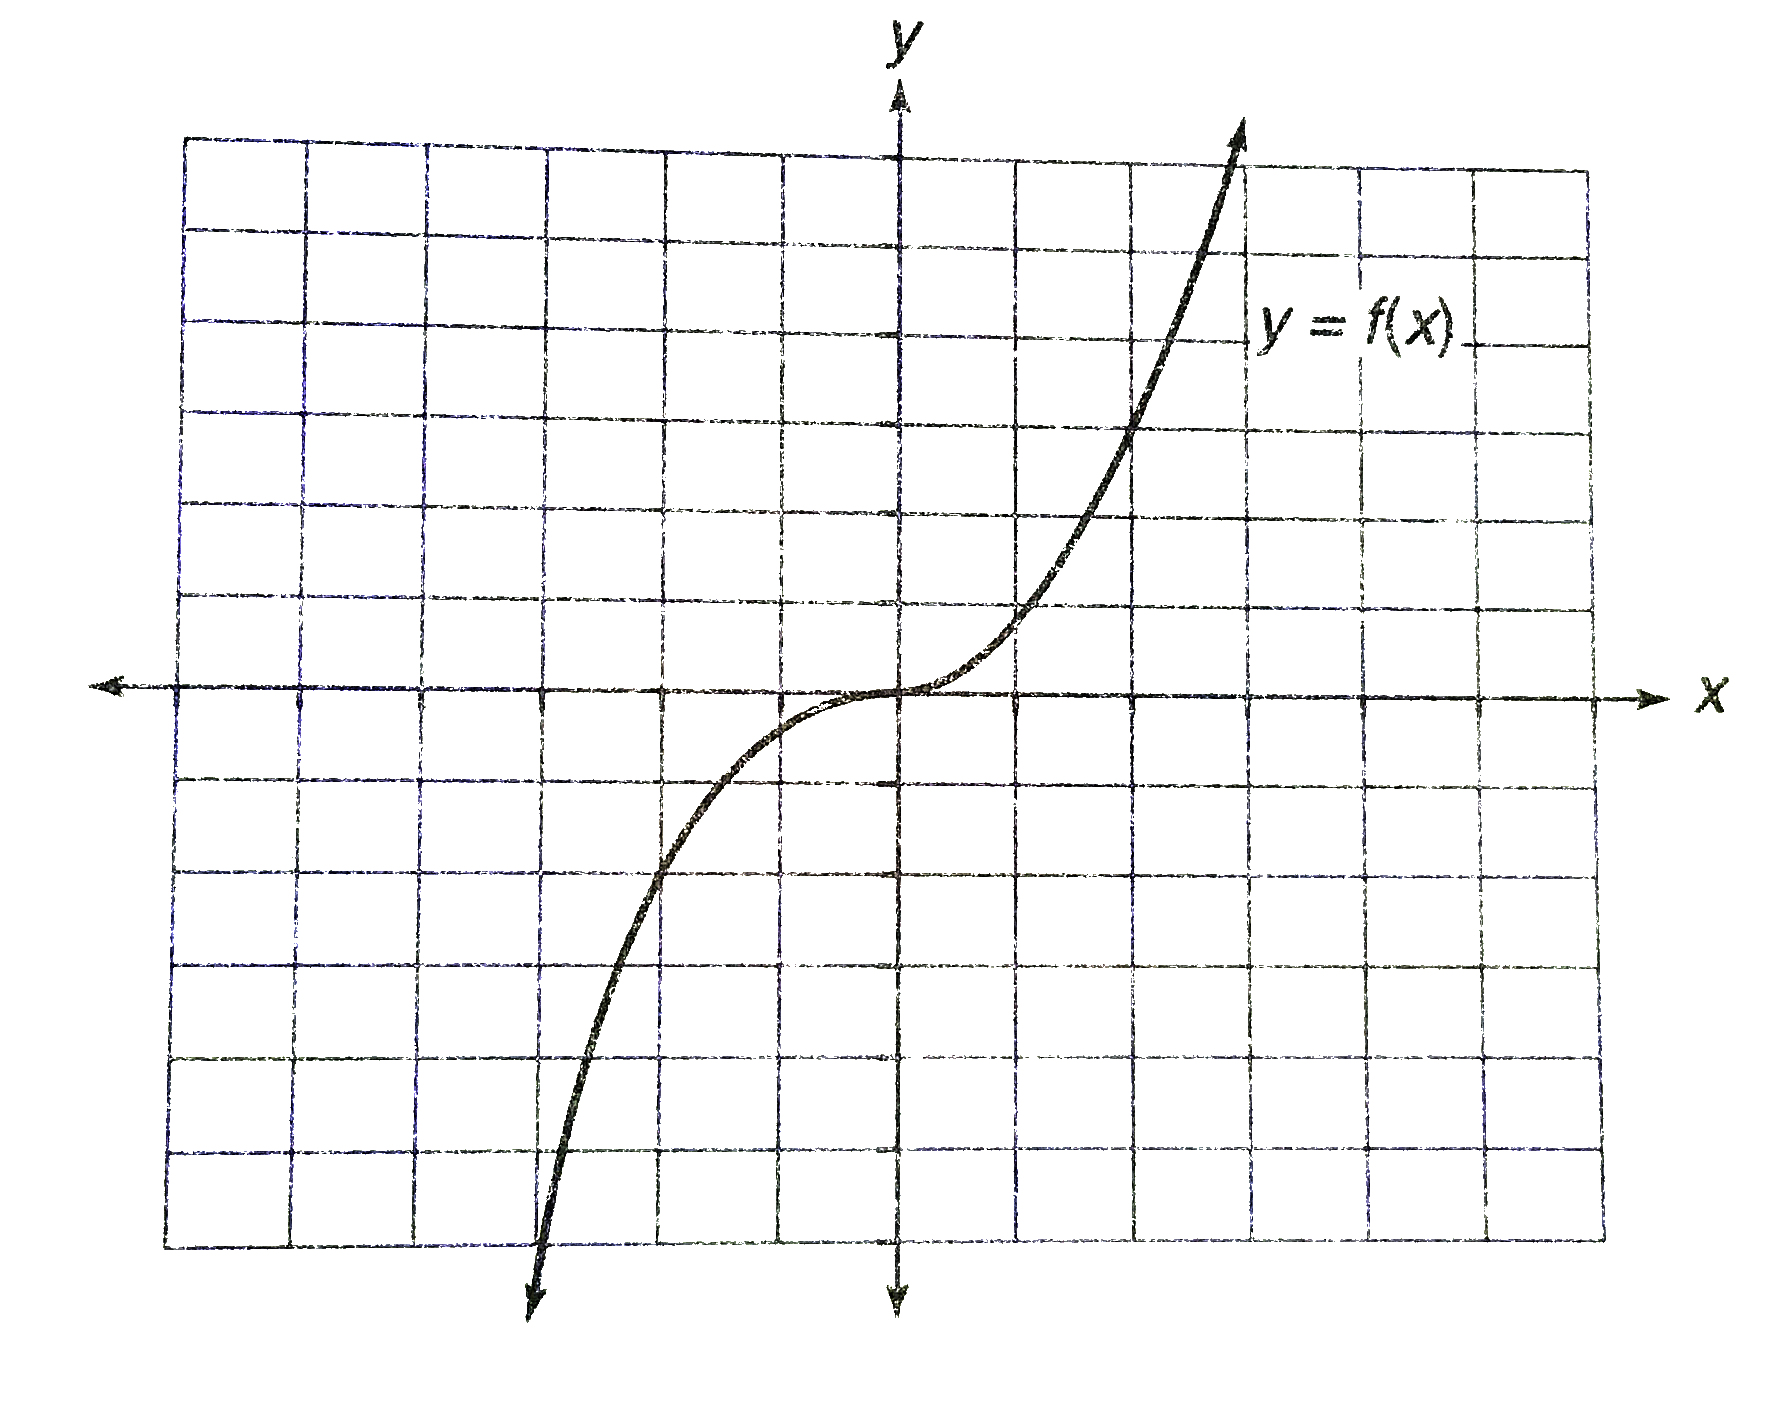
Which of the following could represents the graph of y=f(x−2)+1?A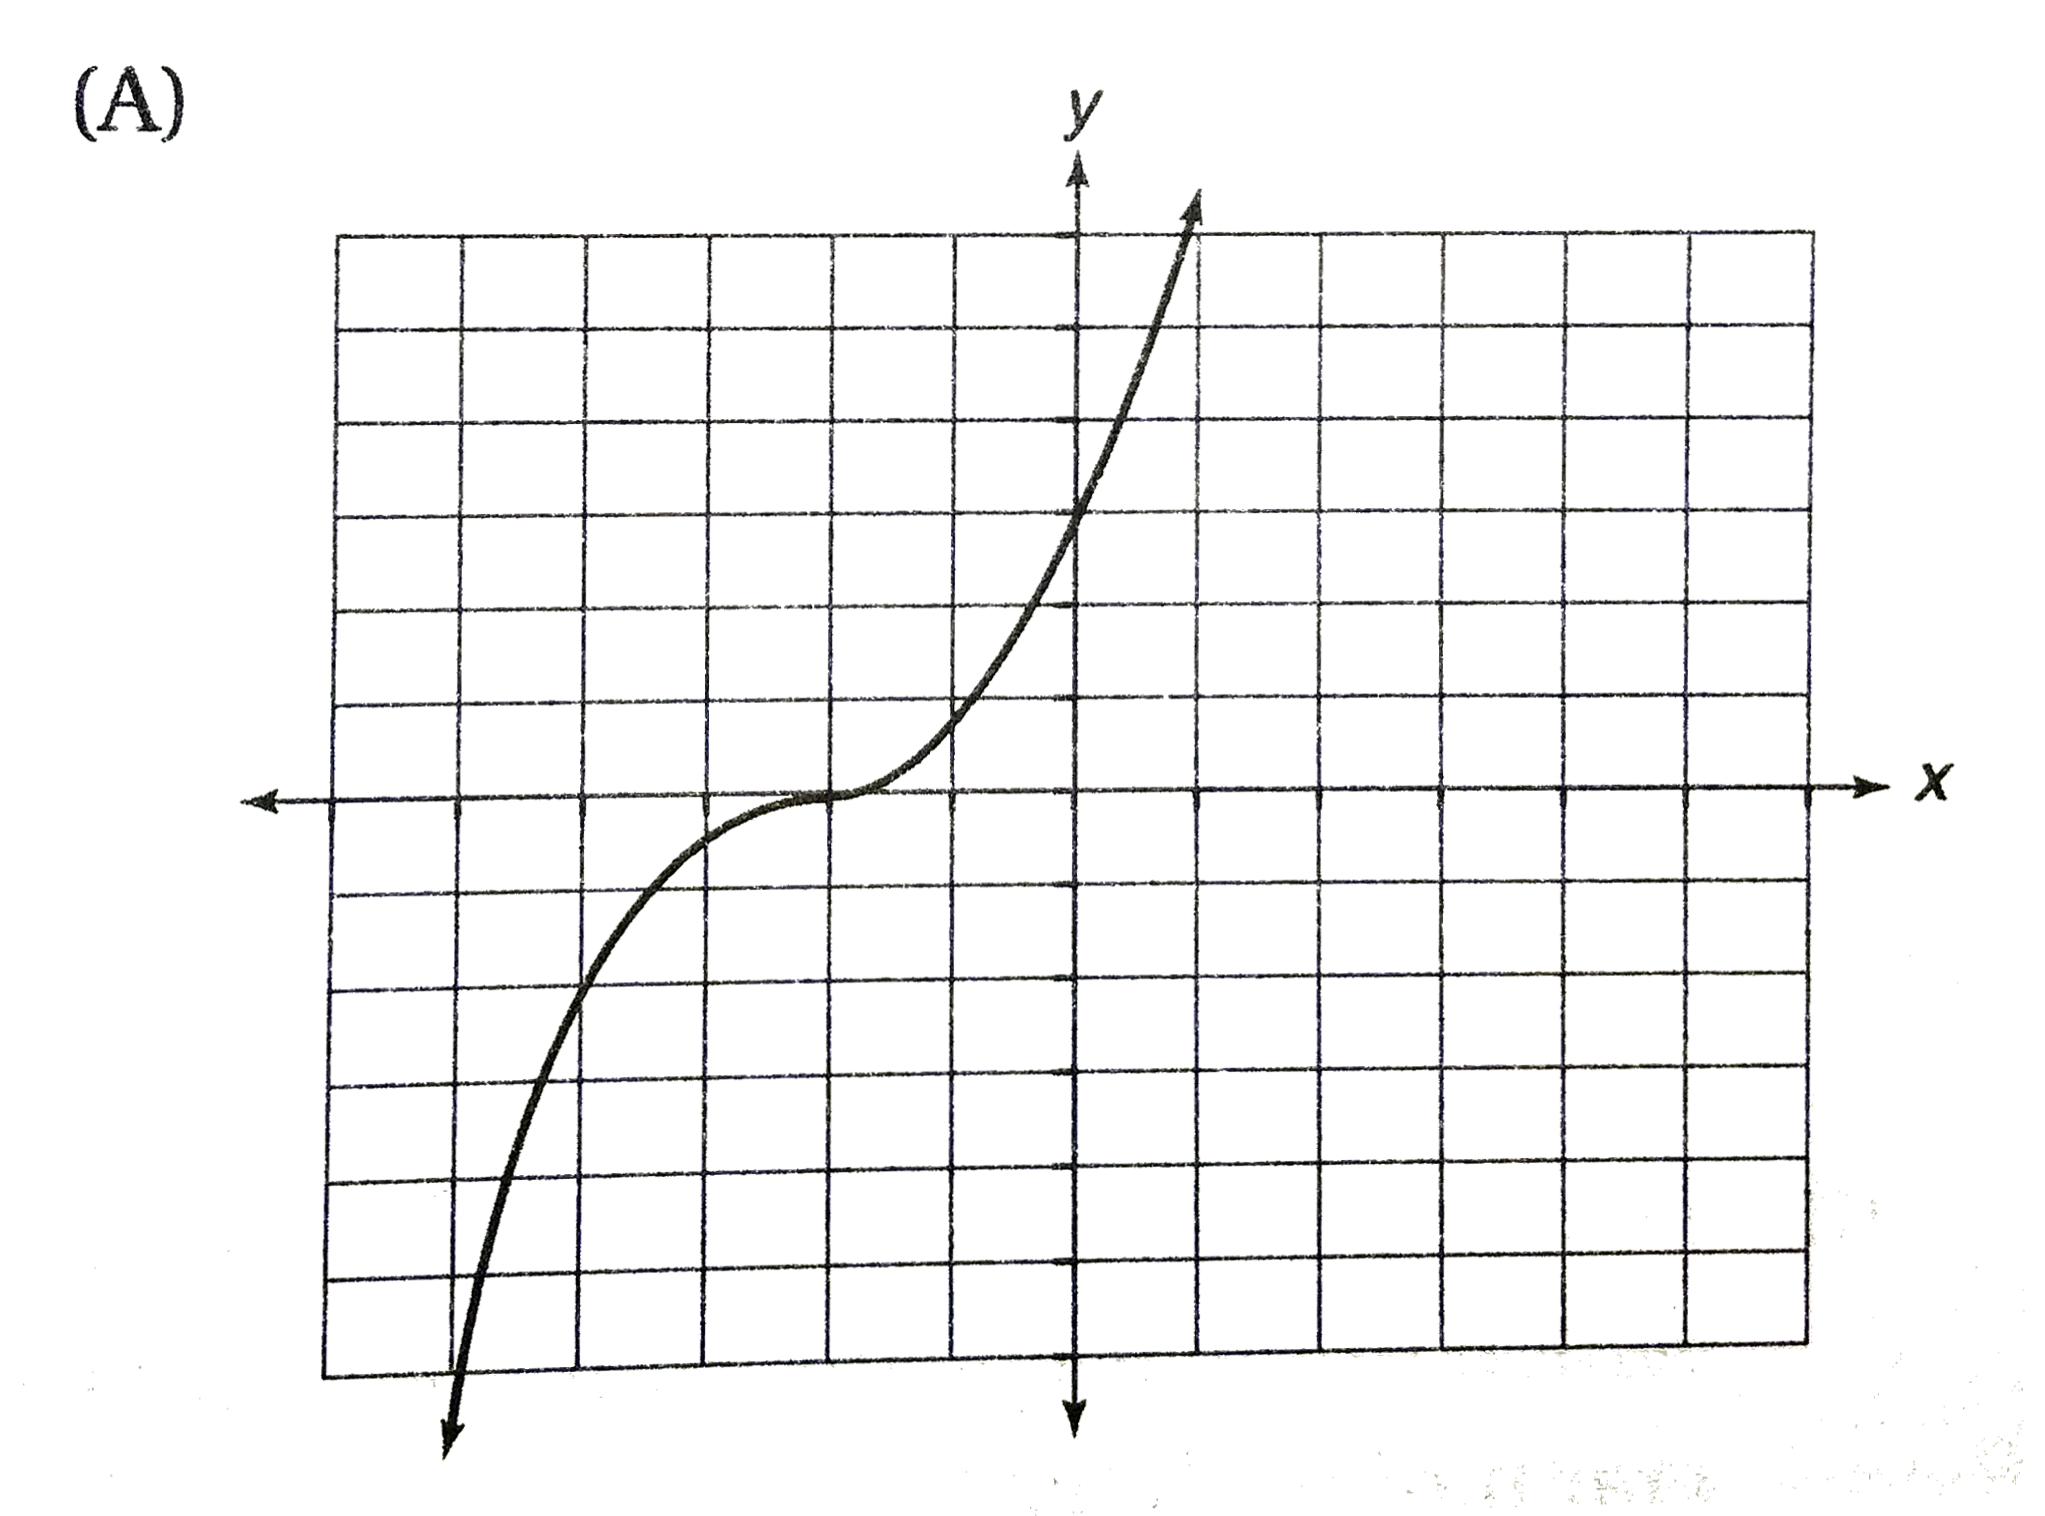 B
B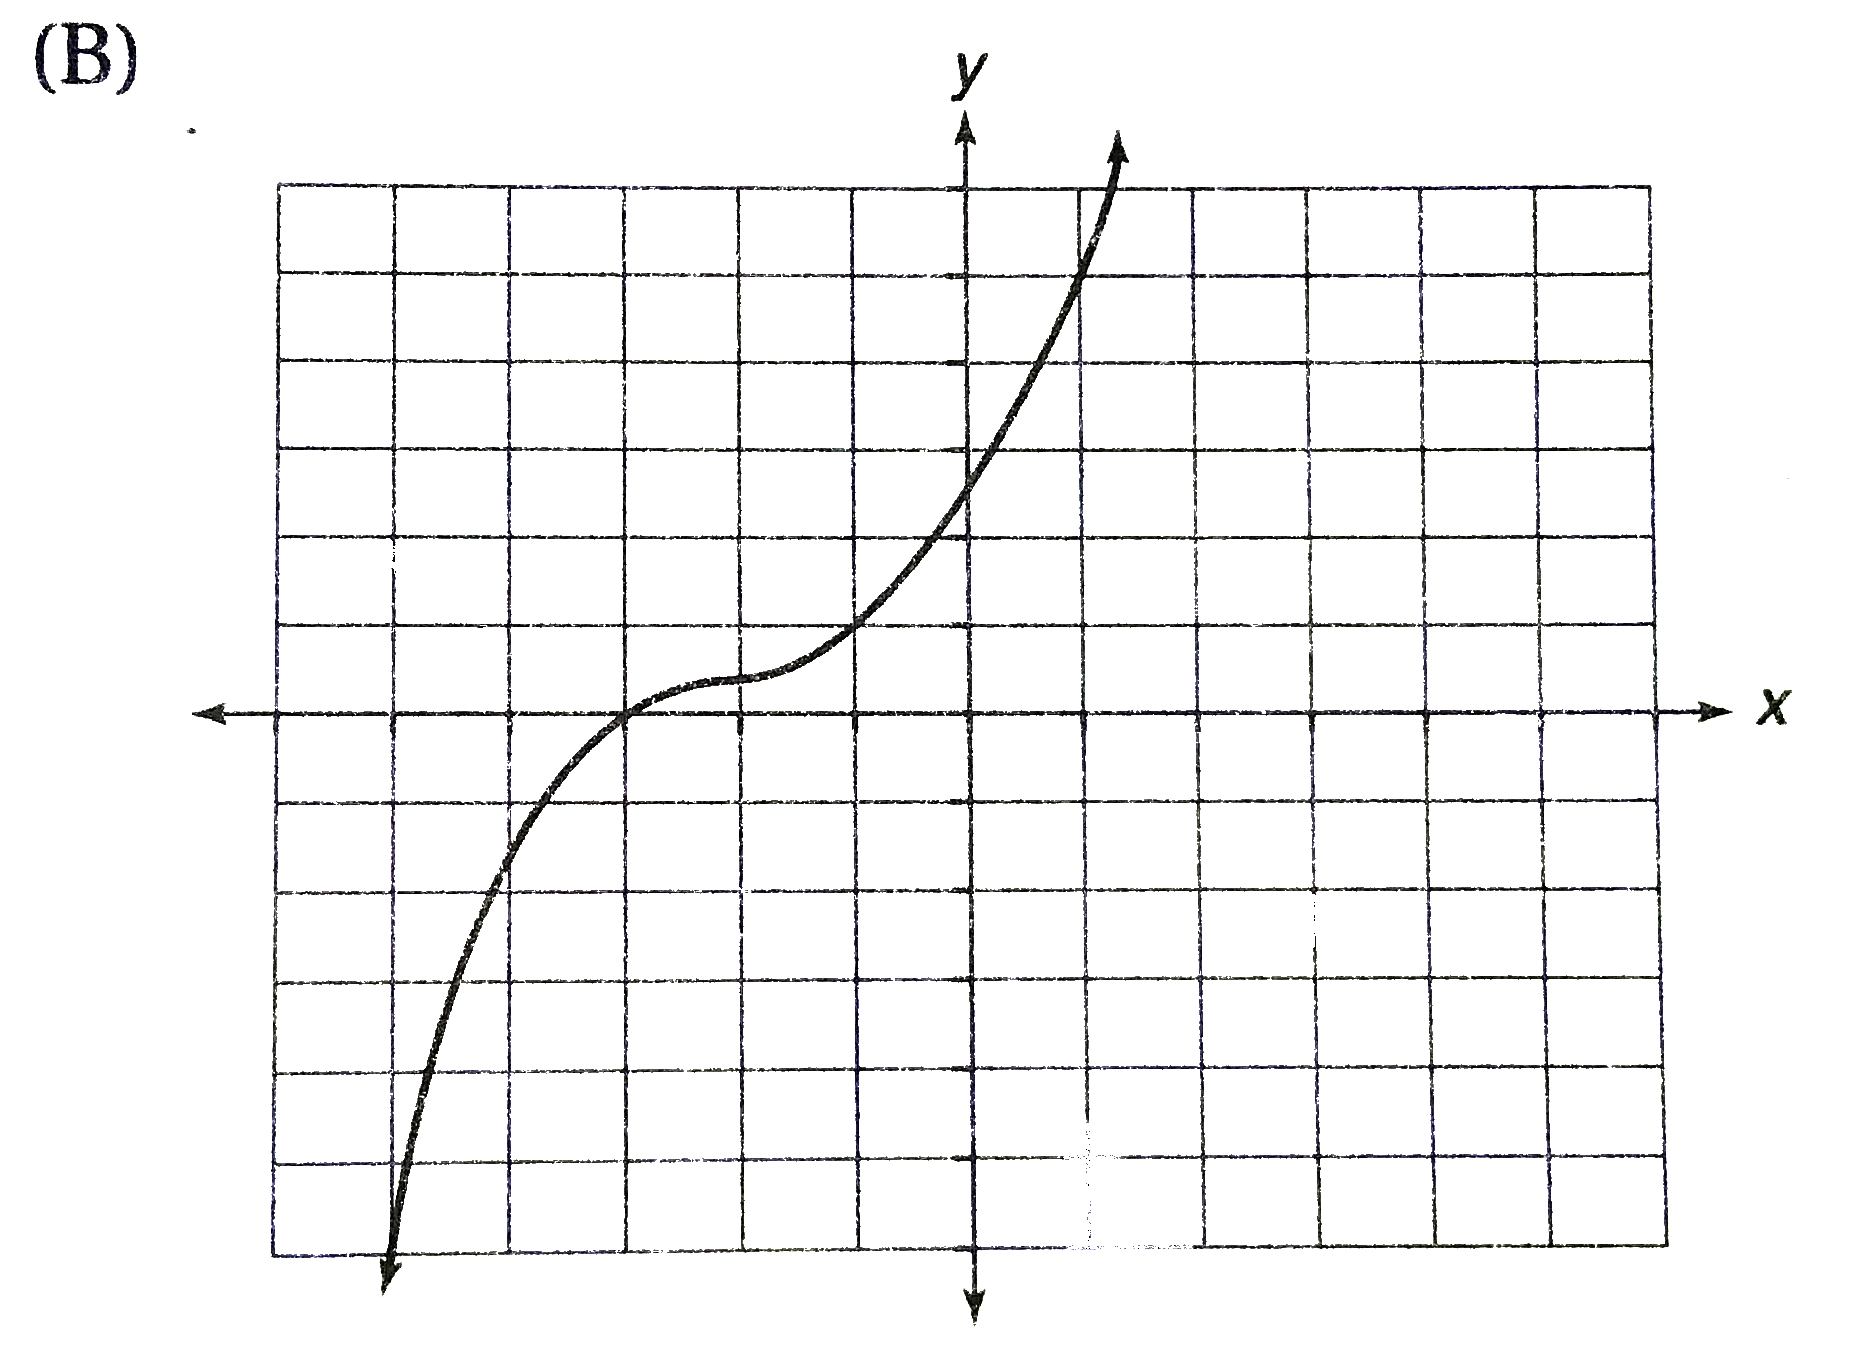 C
C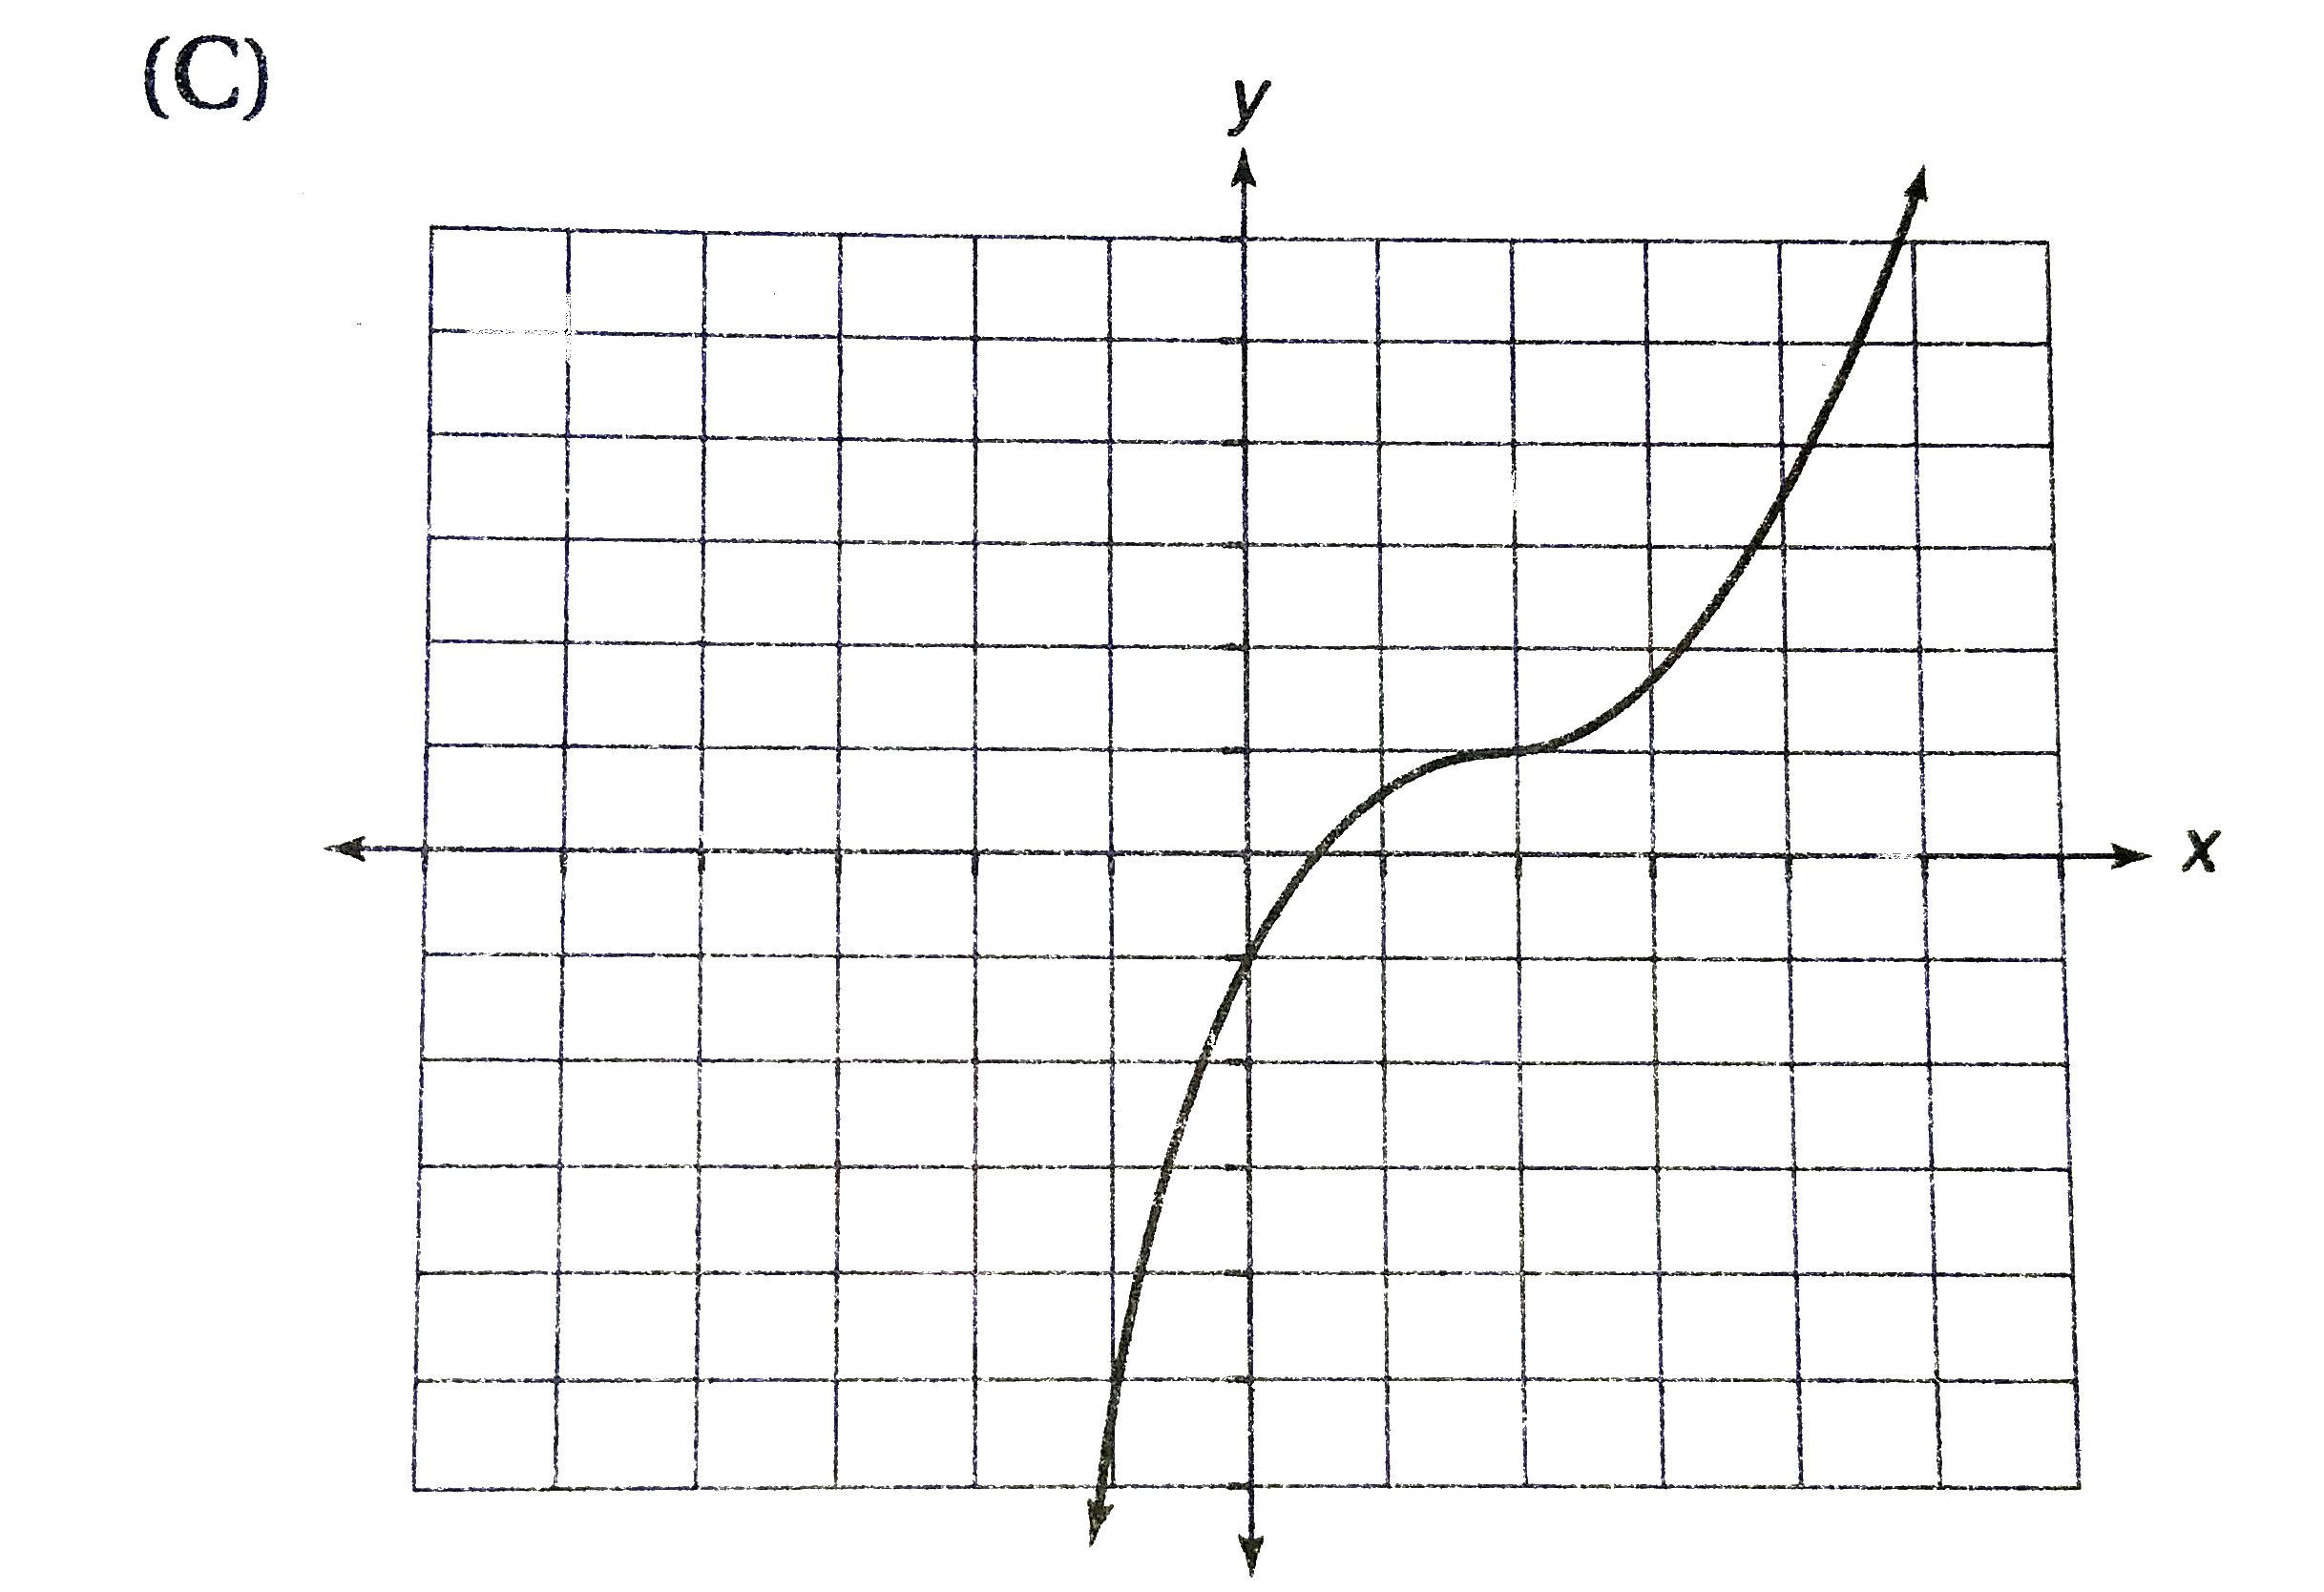 D
D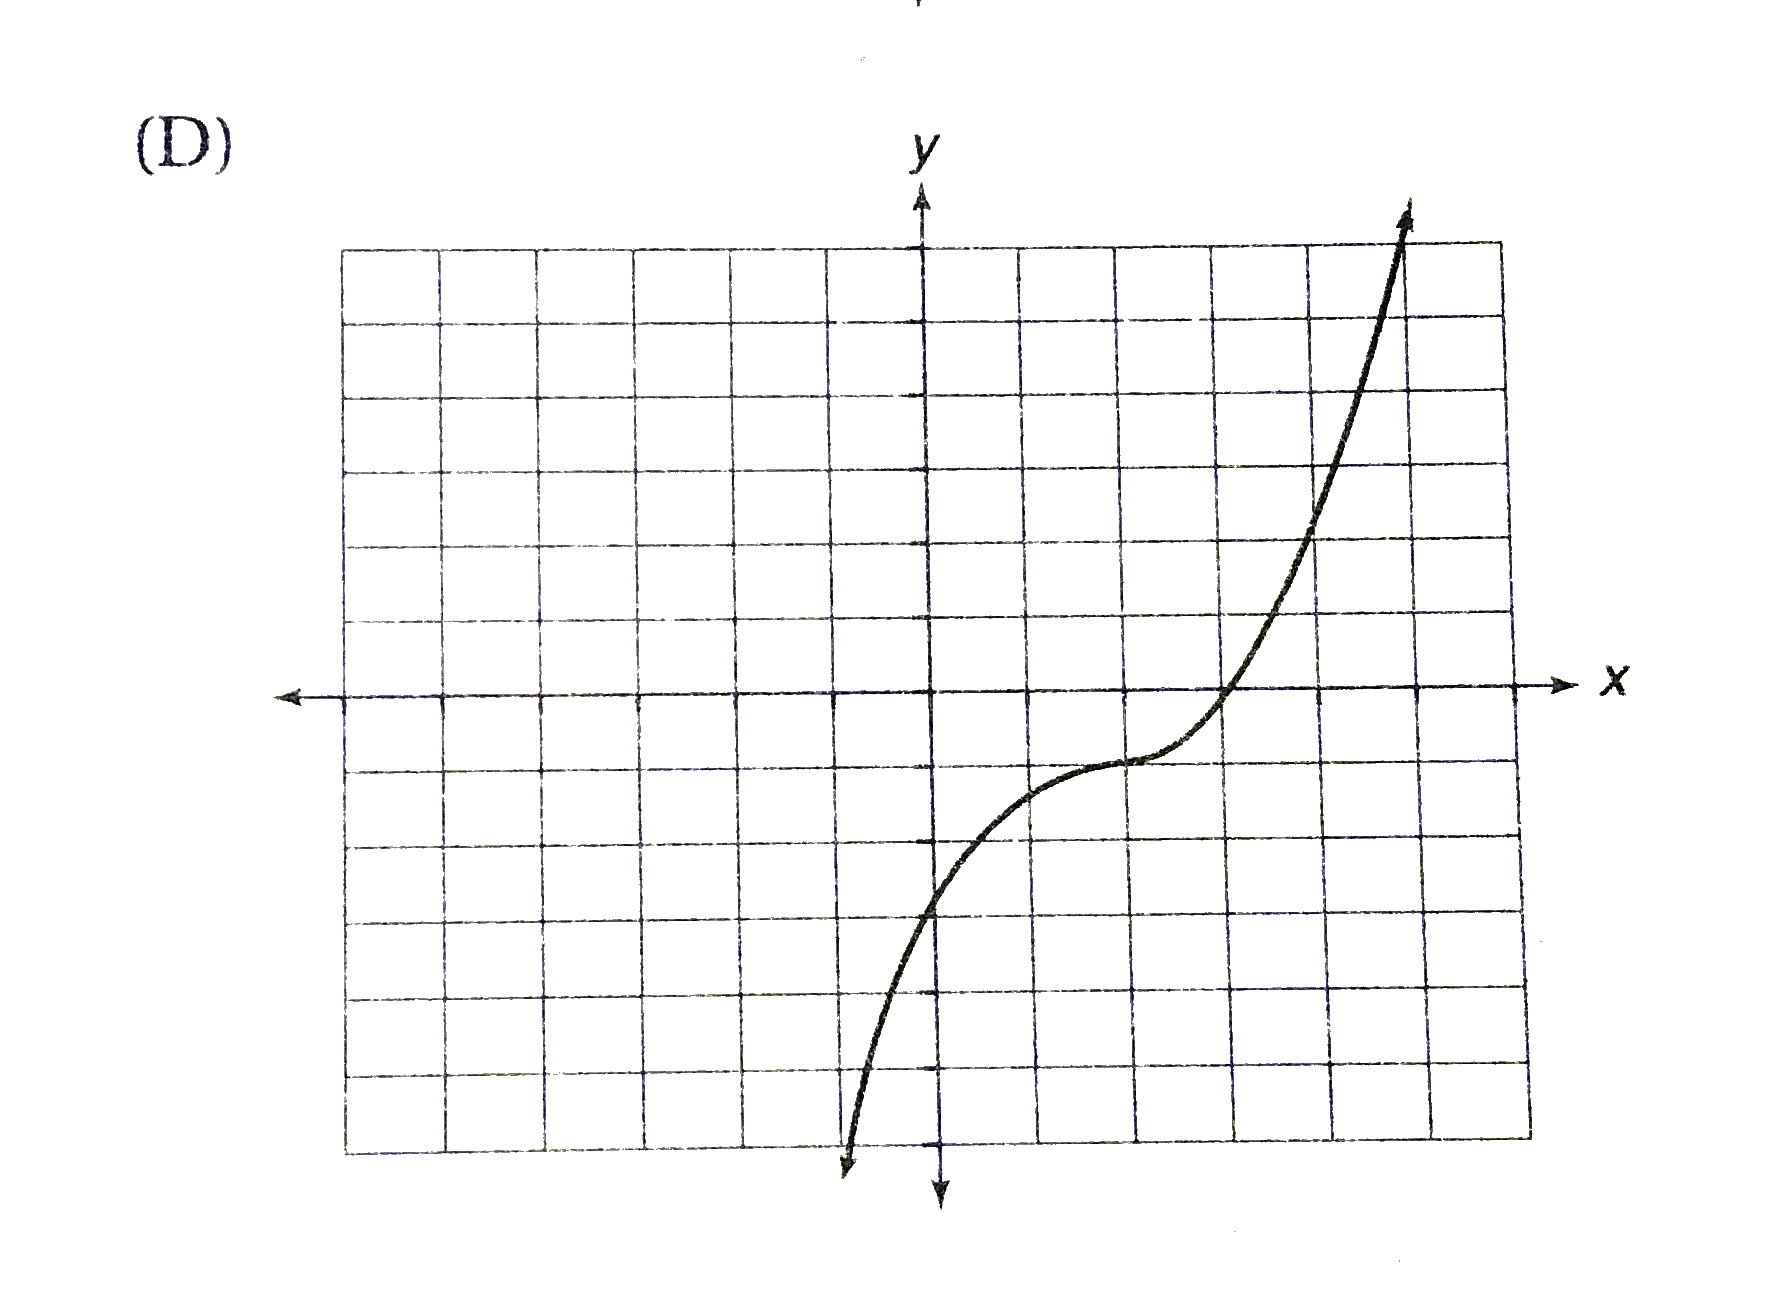
The graph of f(x) and g(x) are shown below. If 3f(g(k)+1)+g(f(m)), where k and m are positive integers from 1 to 5, what is the maximum value of (K+m)?
View Solution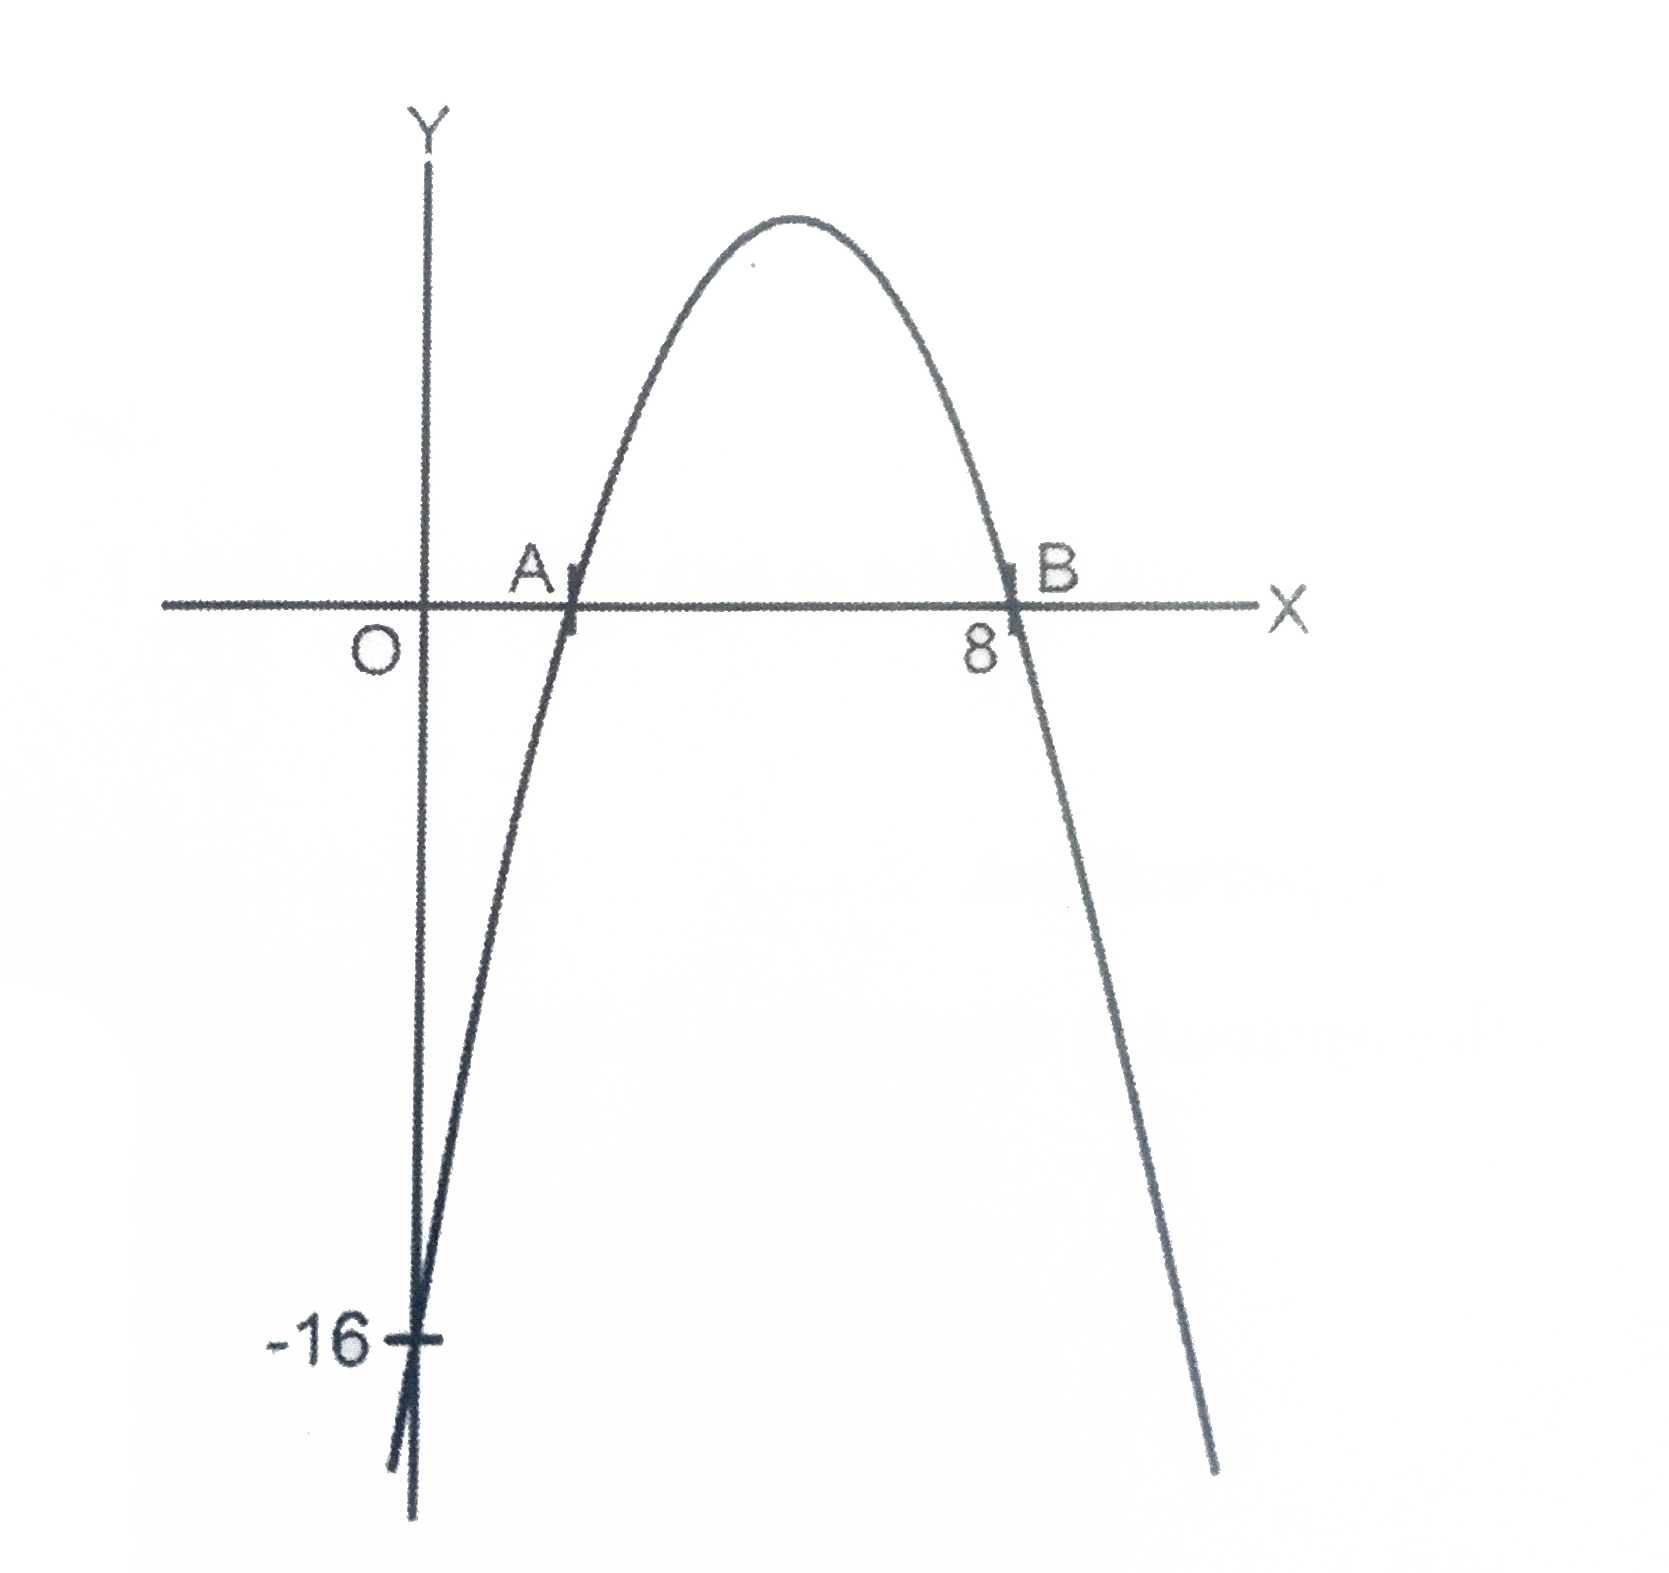
The graph of f(x)=−x2+ax+b is shown below. What is the area of the square constructed with side AB?
View SolutionQuestion 1 and 2 refer to the information and graph below.
Let function f be defined by the graph in the accompanying figure.
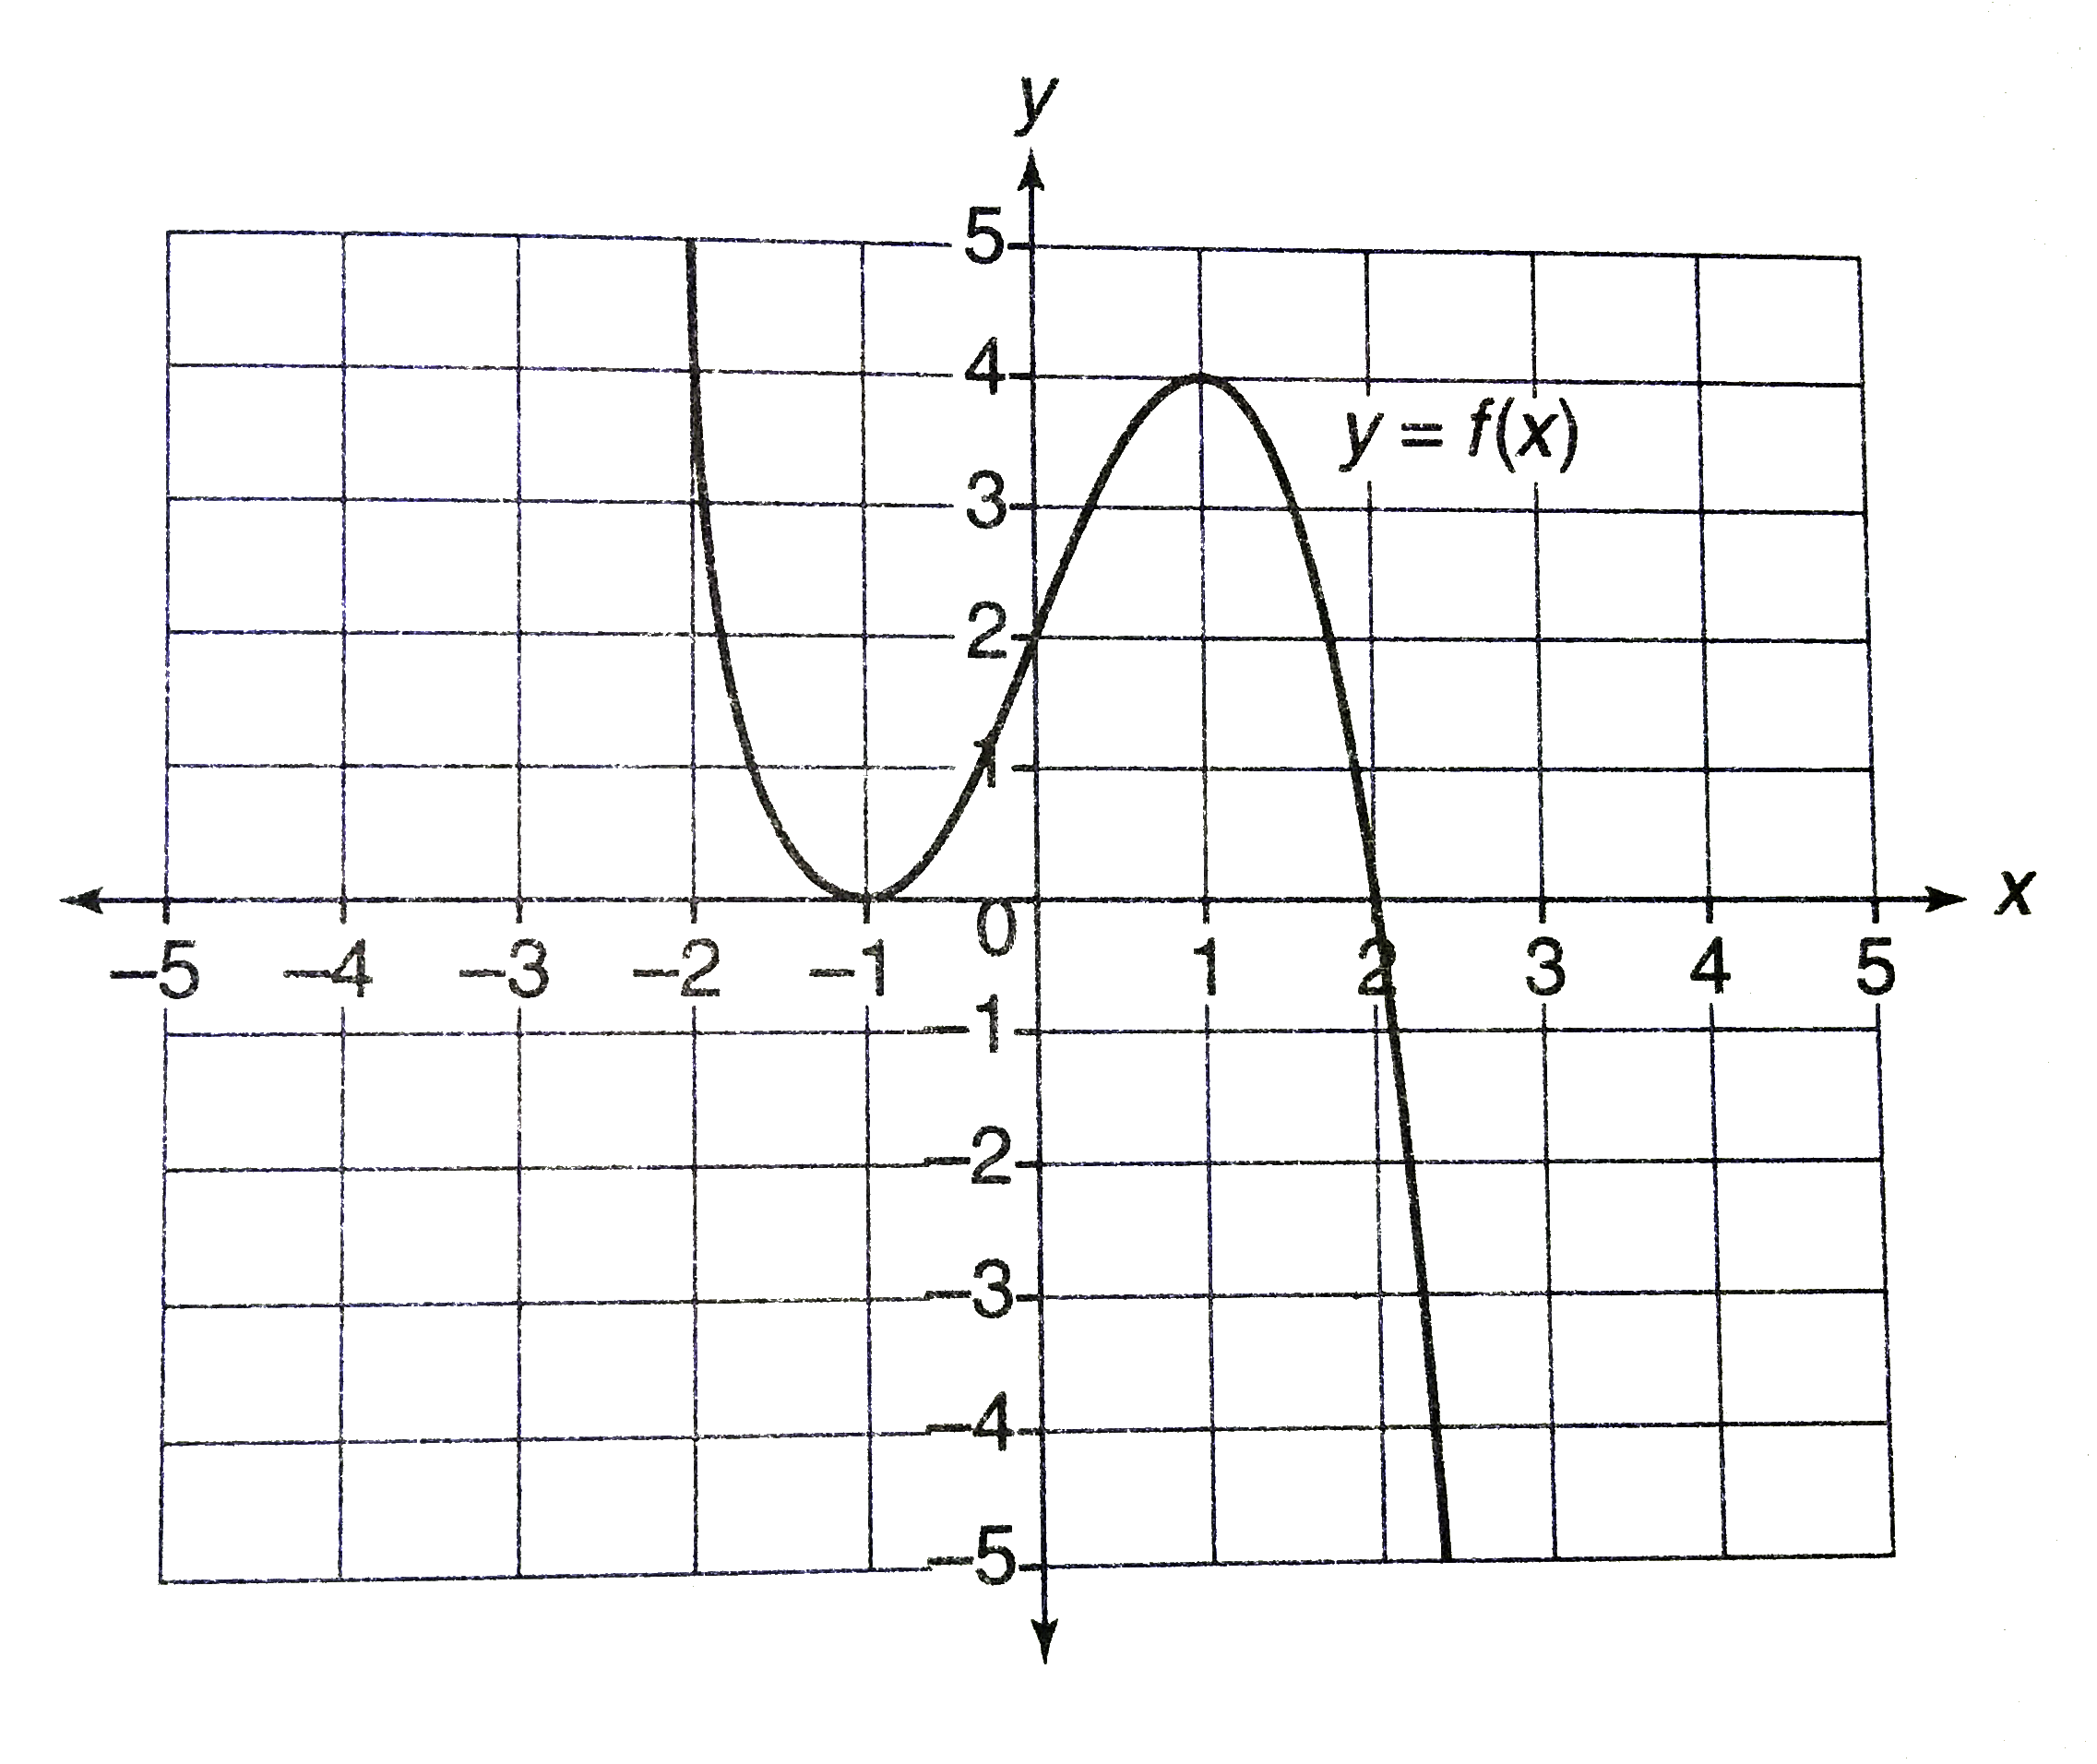
Q. Let m represents the number of points at which the graphs of y=f(x)andg(x)=3 intersect. Let n represents the number of points at which the graphs of y=f(x)−1andg(x)=3 intersect. What is the value of m+n?
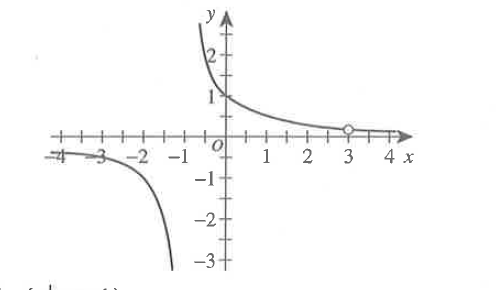
View SolutionThe graph of f(x)=x−3x2−2x−3 is shown below. What is the domain of f(x) ?
View SolutionThe graph of f(x) is shown below :
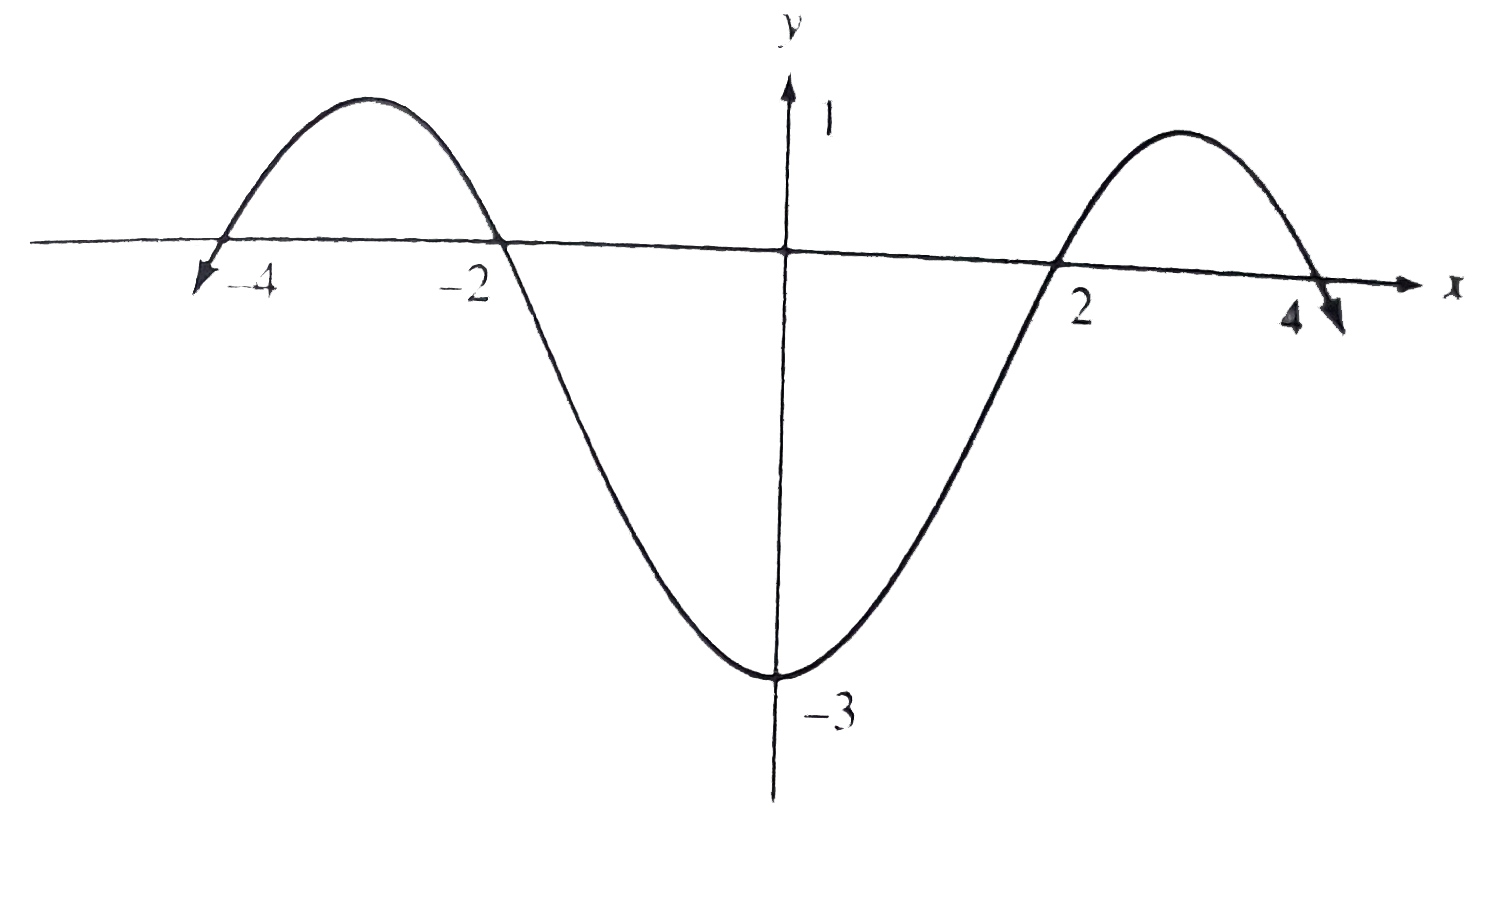
A transformation is applied that results in the following graph :
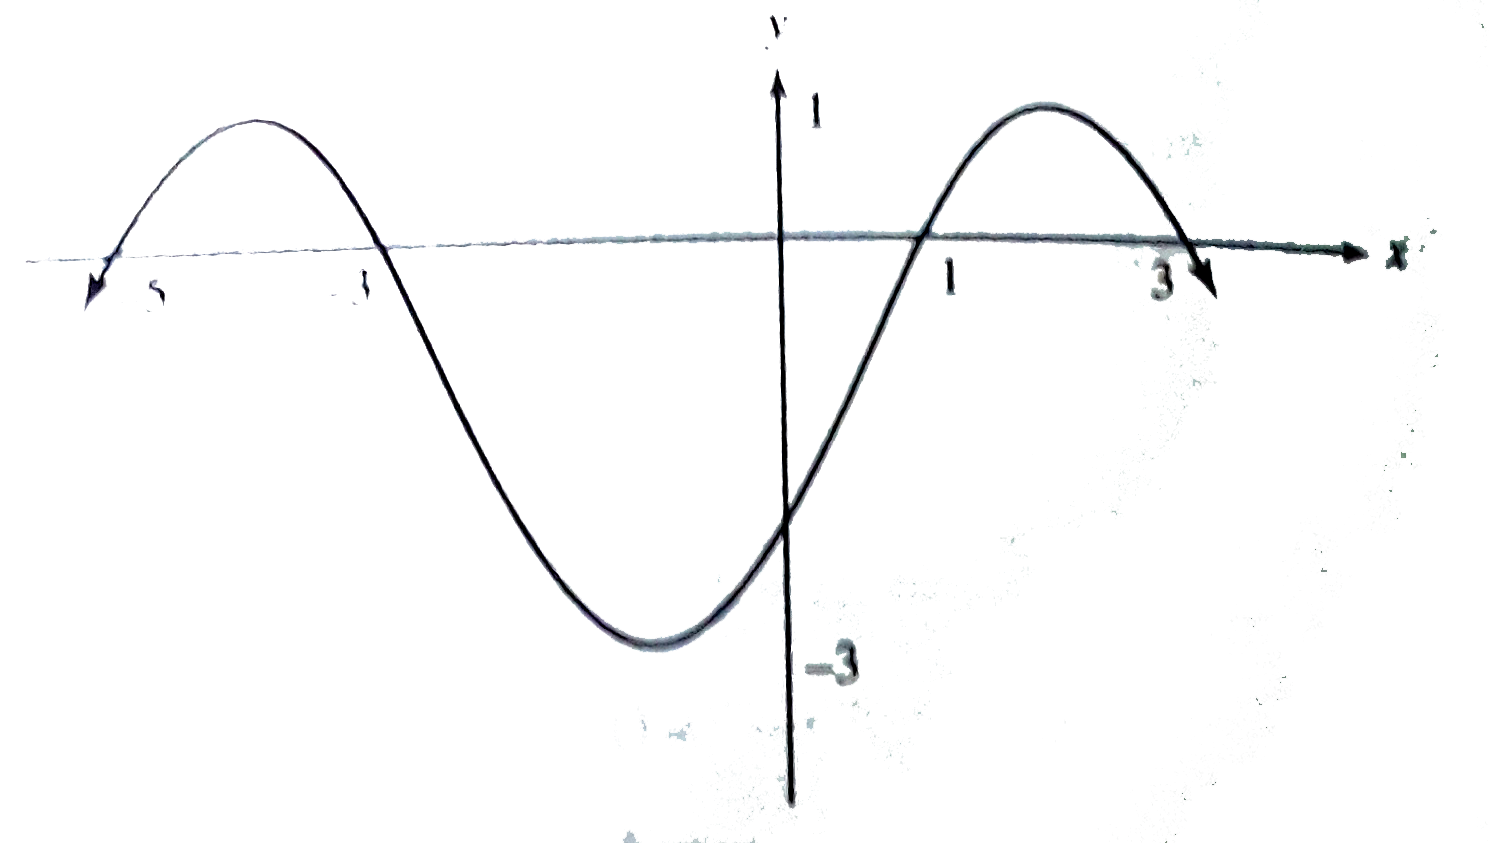
Which of the following functions describes this graph ?
View Solution
