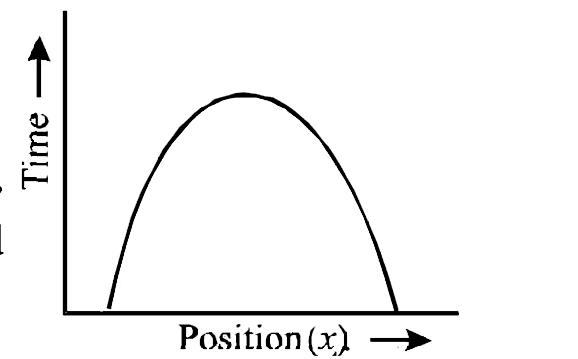
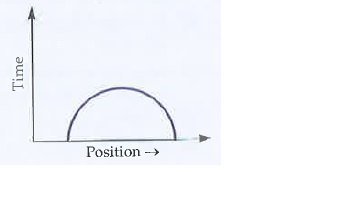
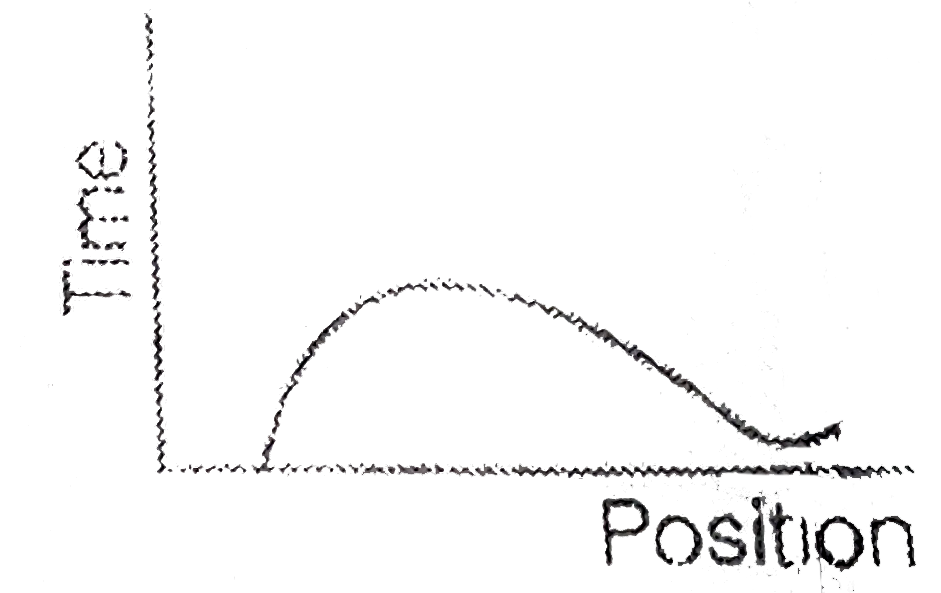
Do we observe the time variation of position is nature as shown in the graph?
A
yes
B
no
C
often
D
Rarely
Video Solution
Text Solution
(b) As x increases, time first increases and then decreases. This not possible.
|
Topper's Solved these Questions
Similar Questions
Knowledge Check
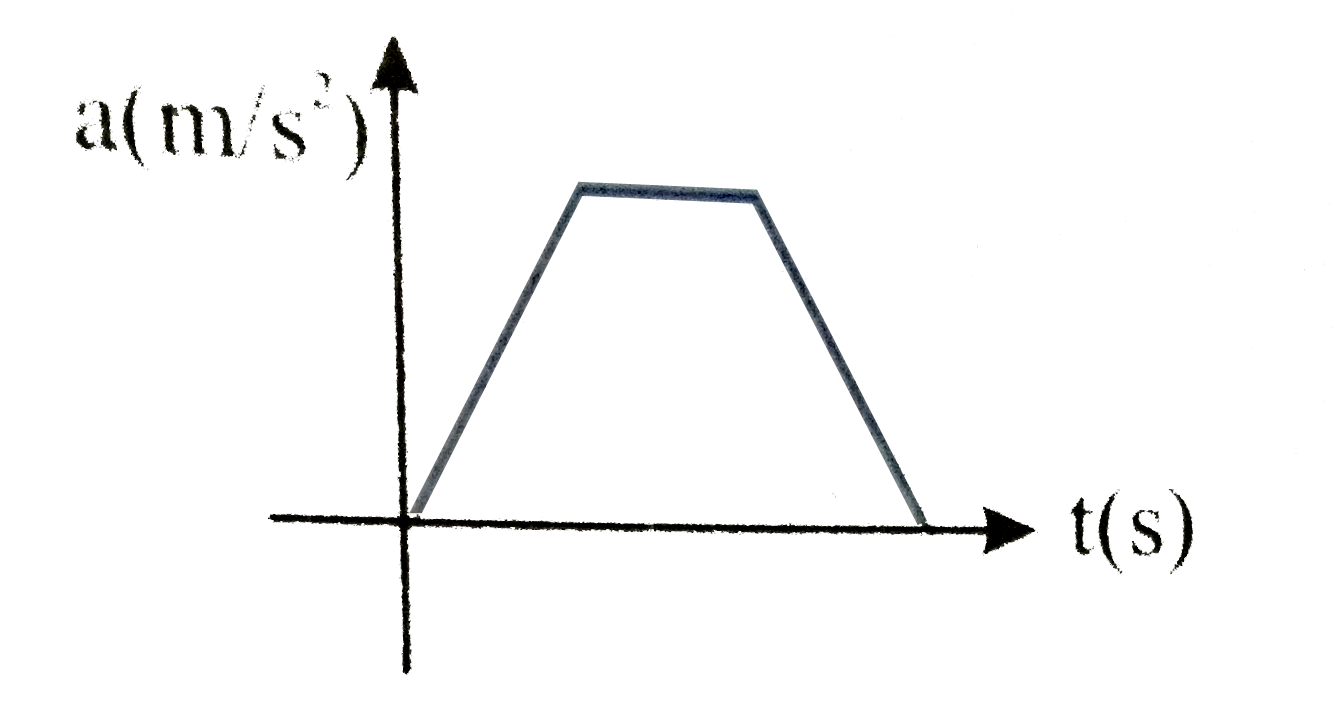
For a particle moving on a straight lint the variation of acceleration with time is given by the graph as shown. Initially the particle was at rest. Then the corresponding kinetic energy of the particle versus time graph will be
 .A
.A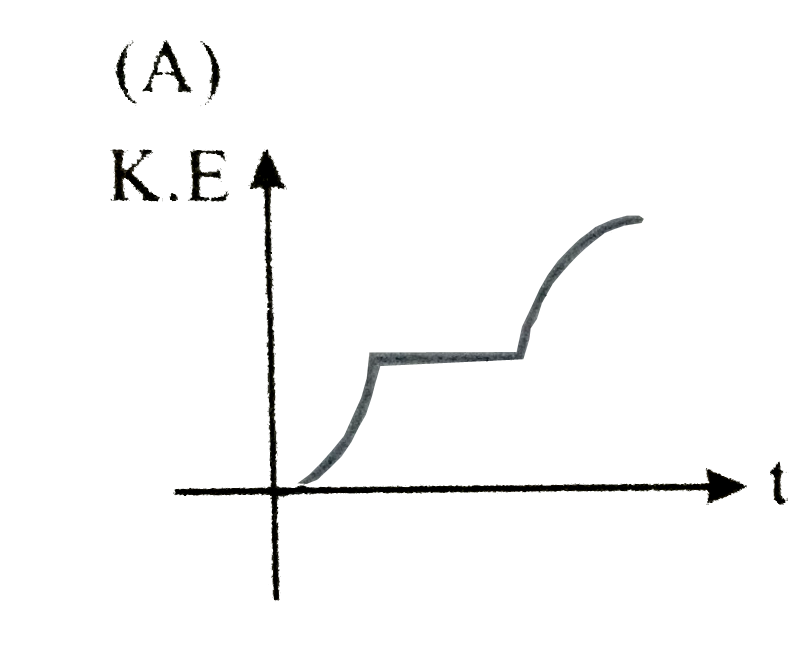 B
B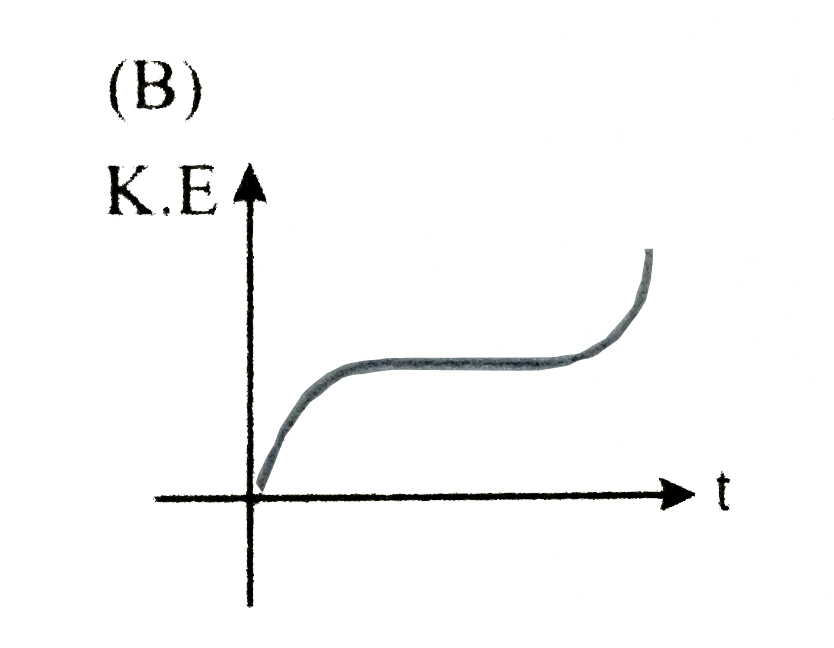 C
C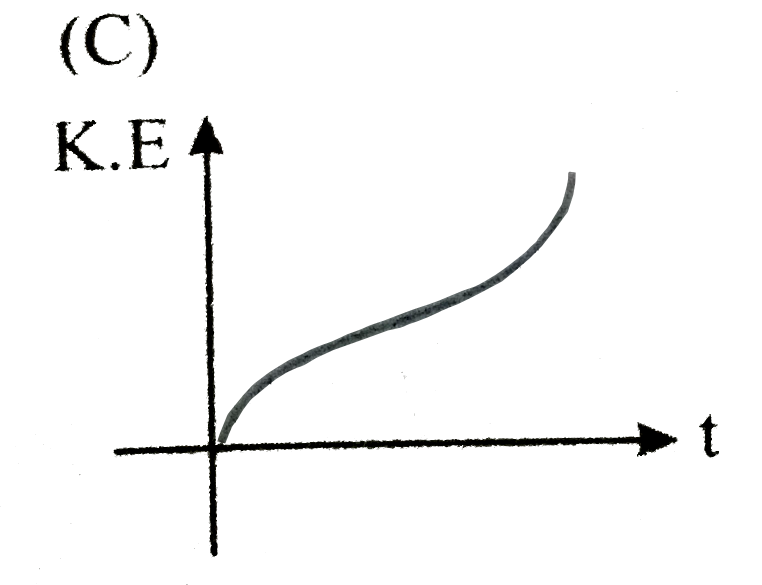 D
D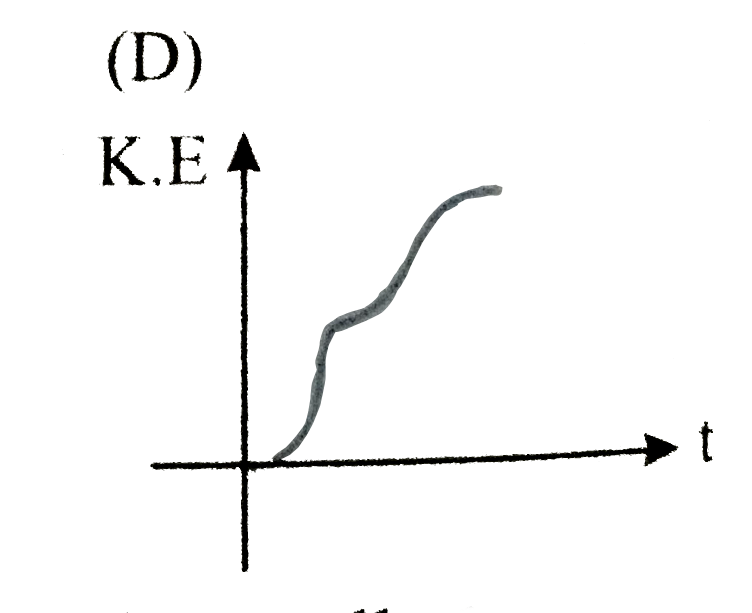
Displacement time graph of a particle moving in a straight line is as shown in figure.
From the graph we can conclude that work done on the block is :
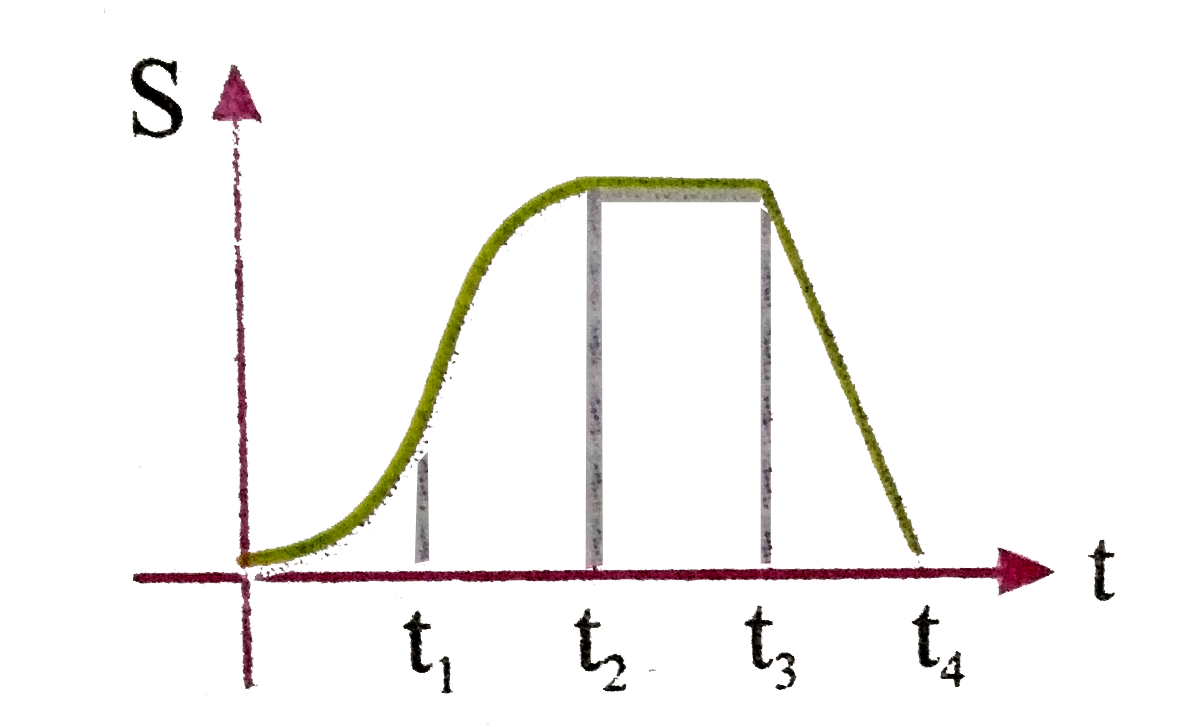 .Apositive from 0 to t1Bnegative from t1 to t2Czero from t2 to t3Dnegative from t3 to t4.
Show graphically variation of AC with time. Explain the nature of the graph.
View SolutionThe variation of current with time in a wire was shown in graph given below. Find flowing in 6 sec current (Amp time)
View SolutionThe variation of current with time in a wire was shown in graph given below. Find amount of charge flowing in 6 sec
View SolutionThe variation of current with time in a wire was shown in graph given below. Find amount of charge flowing in 6 sec.
View SolutionThe variation of current with time in a wire was shown in graph given below. Find amount of charge flowing in 6sec
View SolutionCalculate the root mean square value of the voltage of the given variation of an alternating EMF with time in graph as shown in figure-5.173.

View Solution


