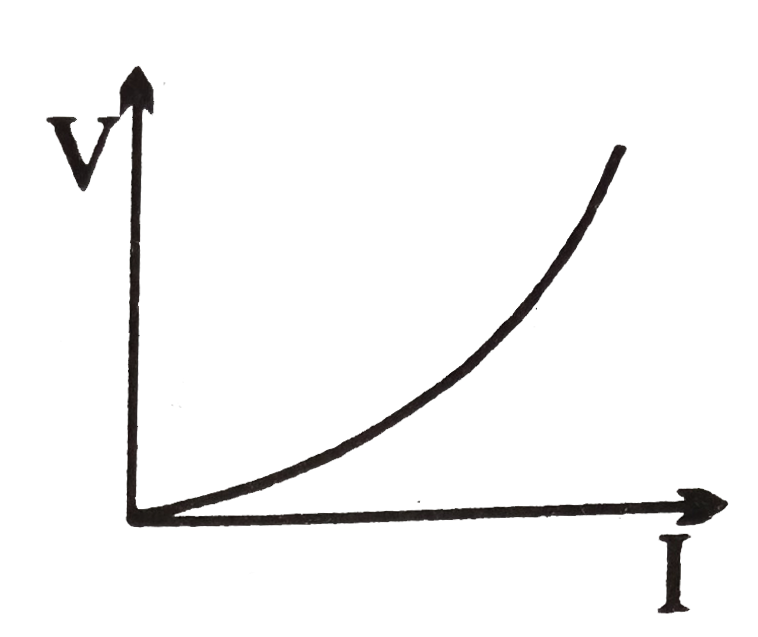
The variation between V-I has shown by graph for heating filament
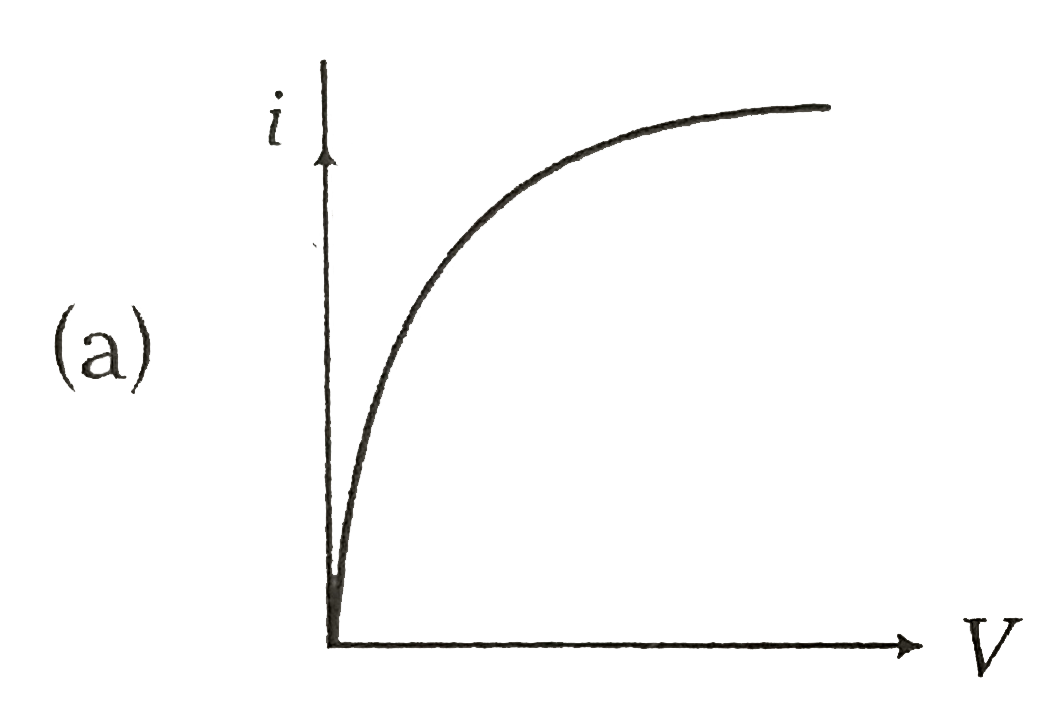
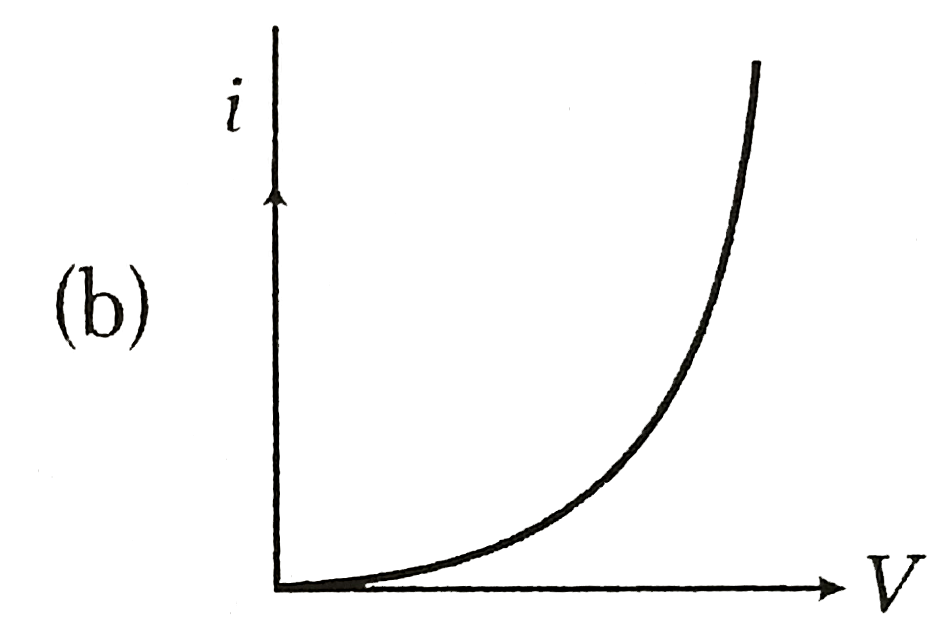
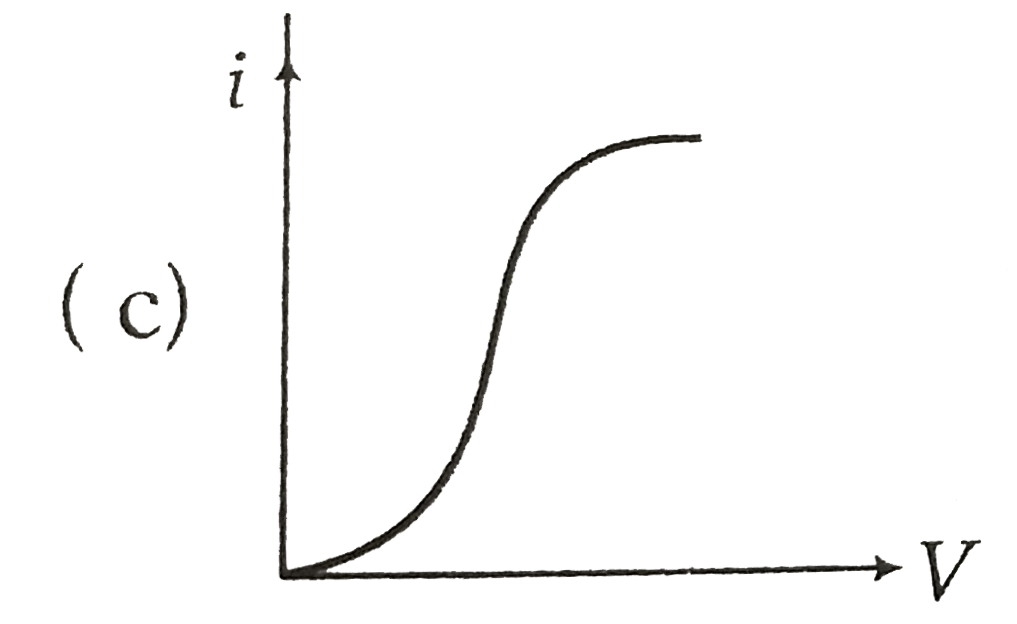
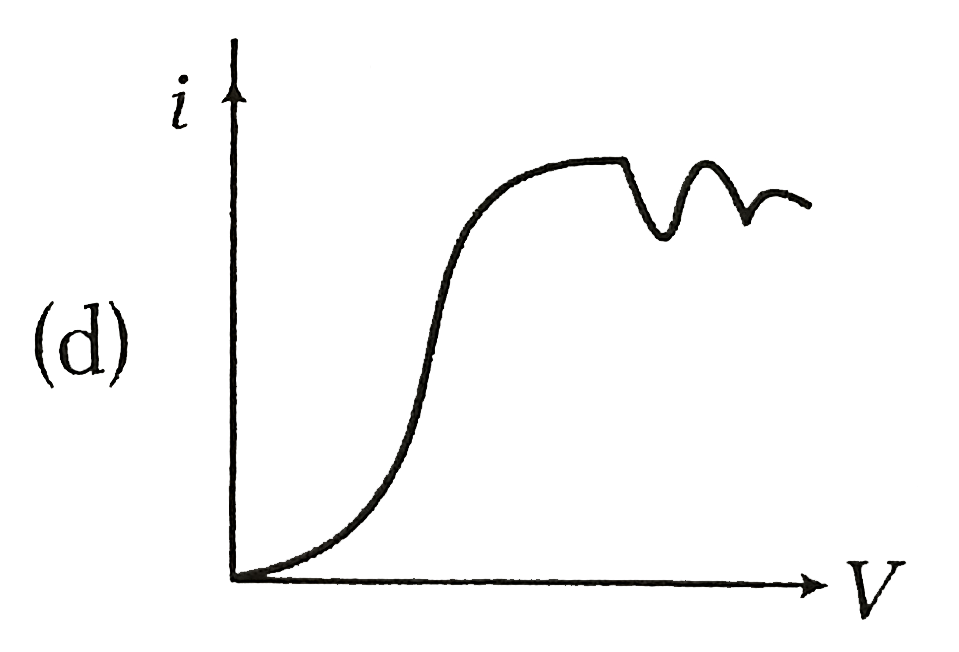
The correct Answer is:A
Step by step video, text & image solution for The variation between V-I has shown by graph for heating filament by Physics experts to help you in doubts & scoring excellent marks in Class 12 exams.
Updated on:21/07/2023Topper's Solved these Questions
- CURRENT ELECTRICITYBook:DC PANDEYChapter:CURRENT ELECTRICITYExercise:Match the columns
Explore 4 Videos
- COMMUNICATION SYSTEMBook:DC PANDEYChapter:COMMUNICATION SYSTEMExercise:Subjective
Explore 11 Videos
- ELECTROMAGNETIC INDUCTIONBook:DC PANDEYChapter:ELECTROMAGNETIC INDUCTIONExercise:Medical entrances gallery
Explore 25 Videos
Similar Questions
Knowledge Check
The graph between E and v is
A B
B C
C D
D
The graph between E and v is
A B
B C
C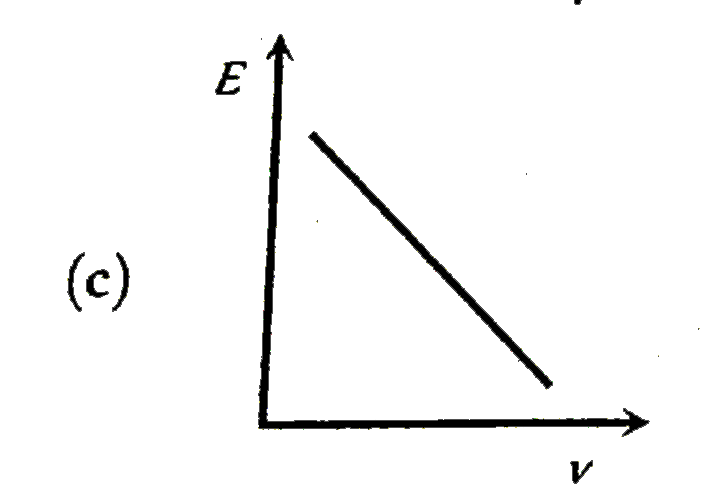 D
D
the correct variation between √E and p is shown by
A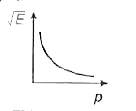 B
B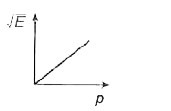 C
C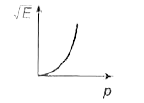 D
D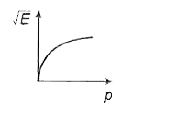
The variation of current with time in a wire was shown in graph given below. Find amount of charge flowing in 6 sec.
View SolutionThe variation of current with time in a wire was shown in graph given below. Find amount of charge flowing in 6sec
View SolutionIf for a given substance, melting point is TB and freezing point is TA then correct variation of entropy is by graph between entropy change and temperature is
View SolutionThe graph between L and T is correctly shown by
View SolutionThe variation of current (I) and voltage (V) is as shown in figure A. The variation of power P with current I is best shown by which of the following graph
View Solution

