Draw a graph showing the variation of reactance of (i) a capacitor and (ii) an inductor with the frequency of an a.c circuit.Solution in Tamil
i. Capacitive reactance Xc=12πγc
Xcα1γ
The graph between γandXCandγandXL

ii. Inductive reactance XL=2πγL
XLαγ
Similar Questions
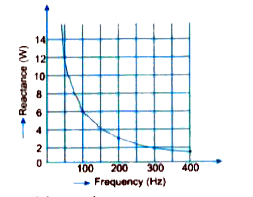
The figure shows the graphical variation of the reactance of a capacitor with frequency of ac source. (a) find the capacitance of the capacitor (b)an ideal inductor has the same reactance at 100 Hz frequency as the capacitor has the same frequency find the value of the inductor. (c) draw the graph showing the variation of the reactance of this inductor with frequency
View SolutionSketch a graph showing the variation of reactance of an inductor with frequency of the applied voltage
View SolutionSketch a graph showing the variation of capacitive reactance with the change in frequency of the a.c. source.
View Solution(i) Draw the graphs showing variation of inductive reactance and capacitive reactance with frequency of applied a.c. source.
(ii) Can the voltage drop across the inductor or the capacitor in a series LCR circuit be greater than the applied voltage of the a.c. source ? Justify your answer.
View SolutionThe figure shows the graphical variation of the rectance of a capacitor with frequency of acsource.

(a) Find the capacitance of the capacitor.
(b) An ideal inductor has the same reactance at 100 Hz frequency as the capacitor has at the same frequency. Find the value of inductance of the inductor.
(c ) Draw the graph showing the variation of the rectance of this inductor with frequency.
View SolutionDraw the variation of Capacitive reactance with the change in frequency of an A.C source.
View SolutionDraw a labelled graph showing variation of impedance of a series LCR circuit with frequency of the a.c. supply.
View SolutionDraw graphs to show the variation of capacitive reactanced with frequency
View Solution

