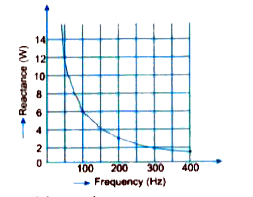
Sketch a graph to show how the reactance of(i) a capacitor (ii) an inductor varies as a function of frequency ?
To solve the question of how the reactance of a capacitor and an inductor varies as a function of frequency, we will break it down into two parts: the reactance of a capacitor (Xc) and the reactance of an inductor (Xl).
1. Formula for Capacitive Reactance:
The reactance of a capacitor is given by the formula:
Xc=1ωC
where ω is the angular frequency and C is the capacitance.
2. Relate Angular Frequency to Frequency:
We know that angular frequency ω can be expressed in terms of frequency f:
ω=2πf
Substituting this into the formula for Xc:
Xc=12πfC
3. Analyze the Relationship:
From the equation Xc=12πfC, we can see that as the frequency f increases, Xc decreases. This indicates an inverse relationship.
4. Sketch the Graph:
- On the x-axis, plot the frequency f.
- On the y-axis, plot the capacitive reactance Xc.
- The graph will be a hyperbola that approaches the x-axis as frequency increases, indicating that Xc decreases with increasing frequency.
Part (ii): Reactance of an Inductor (Xl)
1. Formula for Inductive Reactance:
The reactance of an inductor is given by the formula:
Xl=ωL
where L is the inductance.
2. Relate Angular Frequency to Frequency:
Again, substituting ω=2πf into the formula for Xl:
Xl=2πfL
3. Analyze the Relationship:
From the equation Xl=2πfL, we can see that as the frequency f increases, Xl also increases. This indicates a direct relationship.
4. Sketch the Graph:
- On the x-axis, plot the frequency f.
- On the y-axis, plot the inductive reactance Xl.
- The graph will be a straight line that passes through the origin, indicating that Xl increases linearly with increasing frequency.
Final Graphs:
- For the capacitor, the graph will show a hyperbolic decrease in Xc as f increases.
- For the inductor, the graph will show a linear increase in Xl as f increases.
The reactance of a capacitor is given by the formula:
Xc=1ωC
where ω is the angular frequency and C is the capacitance.
We know that angular frequency ω can be expressed in terms of frequency f:
ω=2πf
Substituting this into the formula for Xc:
Xc=12πfC
From the equation Xc=12πfC, we can see that as the frequency f increases, Xc decreases. This indicates an inverse relationship.
- On the x-axis, plot the frequency f.
- On the y-axis, plot the capacitive reactance Xc.
- The graph will be a hyperbola that approaches the x-axis as frequency increases, indicating that Xc decreases with increasing frequency.
The reactance of an inductor is given by the formula:
Xl=ωL
where L is the inductance.
Again, substituting ω=2πf into the formula for Xl:
Xl=2πfL
From the equation Xl=2πfL, we can see that as the frequency f increases, Xl also increases. This indicates a direct relationship.
- On the x-axis, plot the frequency f.
- On the y-axis, plot the inductive reactance Xl.
- The graph will be a straight line that passes through the origin, indicating that Xl increases linearly with increasing frequency.
- For the capacitor, the graph will show a hyperbolic decrease in Xc as f increases.
- For the inductor, the graph will show a linear increase in Xl as f increases.
Topper's Solved these Questions
- ELECTROMAGNETIC INDUCTION & ALTERNATING CURRENTBOOK - PRADEEPCHAPTER - ELECTROMAGNETIC INDUCTION & ALTERNATING CURRENTEXERCISE - Solved Examples (b)
1 Videos
- ELECTROMAGNETIC INDUCTION & ALTERNATING CURRENTBOOK - PRADEEPCHAPTER - ELECTROMAGNETIC INDUCTION & ALTERNATING CURRENTEXERCISE - Short Answer Qusetions
2 Videos
- DUAL NATURE OF RADIATION AND MATTERBOOK - PRADEEPCHAPTER - DUAL NATURE OF RADIATION AND MATTEREXERCISE - Exercise
191 Videos
- ELECTROMAGNETIC WAVESBOOK - PRADEEPCHAPTER - ELECTROMAGNETIC WAVESEXERCISE - II Focus multiple choice question
5 Videos
Similar Questions
Sketch a graph to show how charge Q given to a capacitor of capacity C varies with the potential difference V.
View SolutionHow the reactance of an inductor depends on frequency ?
View SolutionWhat would be the equivalent reactance of a capacitor and inductor when these are connected to a DC source ?
View SolutionSketch a graph showing the variation of reactance of an inductor with frequency of the applied voltage
View SolutionThe figure shows the graphical variation of the reactance of a capacitor with frequency of ac source. (a) find the capacitance of the capacitor (b)an ideal inductor has the same reactance at 100 Hz frequency as the capacitor has the same frequency find the value of the inductor. (c) draw the graph showing the variation of the reactance of this inductor with frequency

View SolutionThe figure shows the graphical variation of the rectance of a capacitor with frequency of acsource.

(a) Find the capacitance of the capacitor.
(b) An ideal inductor has the same reactance at 100 Hz frequency as the capacitor has at the same frequency. Find the value of inductance of the inductor.
(c ) Draw the graph showing the variation of the rectance of this inductor with frequency.
View SolutionSketch a graph showing the variation of capacitive reactance with the change in frequency of the a.c. source.
View SolutionWhat is the capacitive reactance of a 5μF capacitor when it is a part of a circuit whose frequency is
(i) 50 Hz
(ii) 106 Hz ?
View SolutionHow will the inductive reactance and capacitive reactance change on doubling the frequency of AC ?
View SolutionExplain why the reactance provided by a capacitor to an alternating current decreases with increasing frequency.
View Solution
