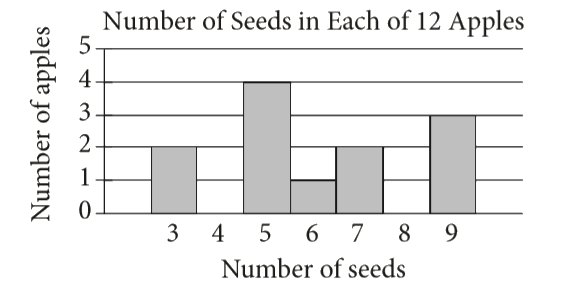
Based on the histogram above, of the following, which is closest to the average (arithmetic mean) number of seeds per apple?
4
5
6
7
The correct Answer is:C
Step by step video, text & image solution for Based on the histogram above, of the following, which is closest to the average (arithmetic mean) number of seeds per apple? by Maths experts to help you in doubts & scoring excellent marks in Class 12 exams.
Similar Questions
Knowledge Check
- Question 1 - Select One

The histogram above shows the result of a survey taken of 25 individuals who were polled about how many weeks of vacation per year they receive. Which of the following is closest to the average (arithmetic mean) number of weeks of vacation per individual?A2B3C4D5 - Question 2 - Select One
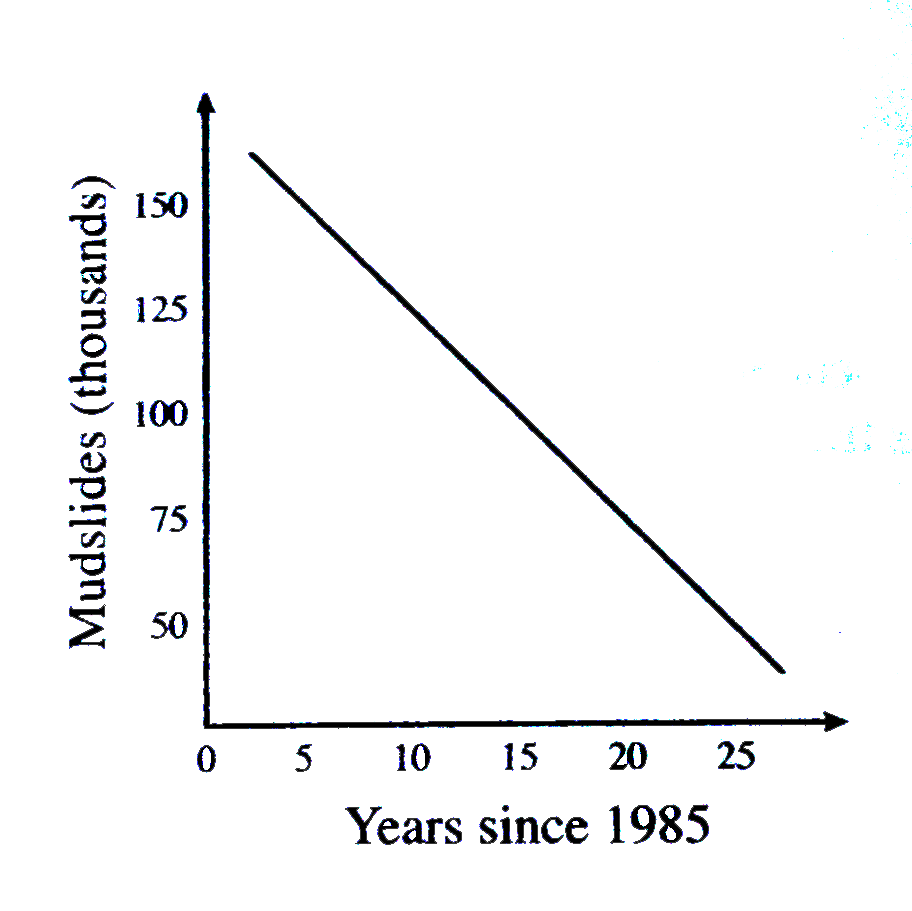
The number of mudslides in a certain country for the past 25 years is approximated by the graph shown above . The graph displays the number of mudslides (in thousands) from 1985 to 2010. Based on the graph , which of the following is closest to the average yearly decrease in the number of mudslides ?A1B5C10D25 - Question 3 - Select One
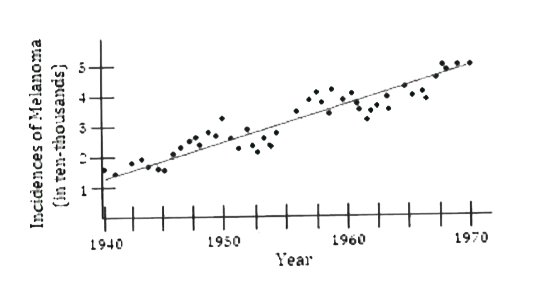
The scatterplot above shows the number of people diagnosed with melanoma, in ten-thousands, from 1940 to 1970. Based on the line of best fit to the data, as shown in the figure, which of the following values is closest to the average yearly increase in the number of incidences of melanoma?A1300B330C0.33D0.13
Which of the following is closest relative of man?
View Solution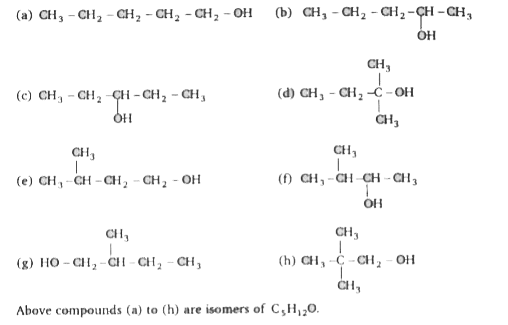
Based on the above isomer answer the following (A to F).
Which isomer is least acidic ?View SolutionFor which of the following lists of 5 numbers is the average (arithmetic mean) greatest than the median?
View Solution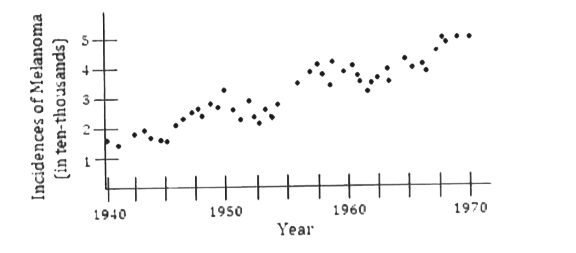
The scatterplot above shows the numbers of people diagnosed with melanoma, in ten - thousands, from 1940 to 1970. Based on the data shown in the figure, which of the following values is closest to the range of the number of incidences of melanoma between 1945 and 1950?View SolutionAdam delivered n pizzas on Monday , 5 times as many pizzas on Tuesday as on Monday , 3 fewer pizzas on Wednesday than on Tuesday, and 7 more pizzas on Thursday than on Tuesday. What is the average (arithmetic mean) number of pizzas he delivered per day over the 4 days ?
View Solution

