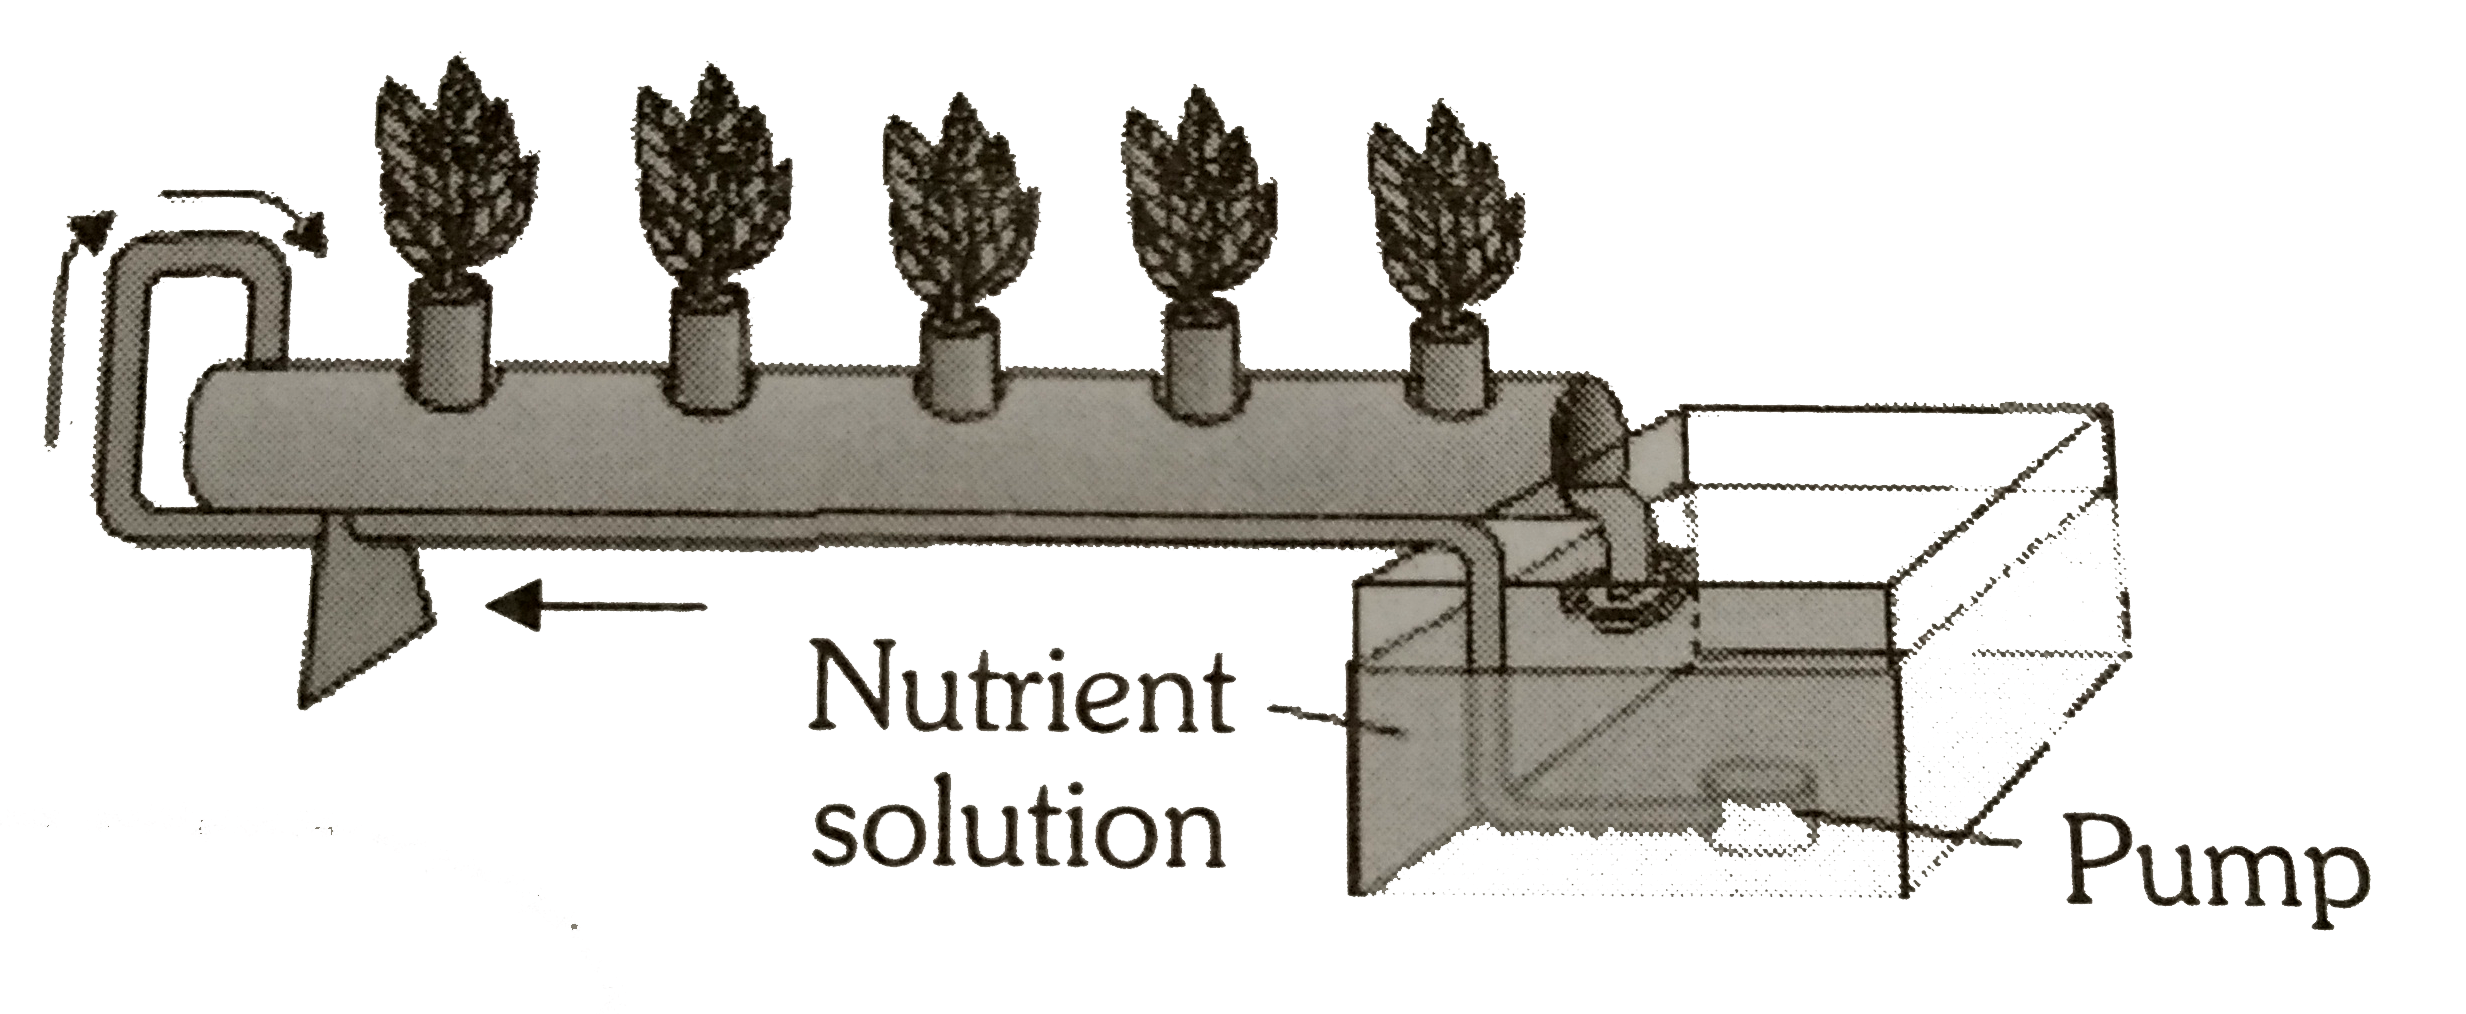
The given figure shows hydrophonic/soil less plant production. Plants are grown in a tube or through placed on a slight incline. The arrows indicate the direction of flow of nutrient solution.
Nutrient solution is sent to the elevated end of the tube from the reservoir by __________ and it flows back into reservoir due to __________

Pump, Gravity
Gravity, Pump
Gravity, Gravity
Pump, Pump
Step by step video & image solution for The given figure shows hydrophonic/soil less plant production. Plants are grown in a tube or through placed on a slight incline. The arrows indicate the direction of flow of nutrient solution. Nutrient solution is sent to the elevated end of the tube from the reservoir by __________ and it flows back into reservoir due to __________ by Biology experts to help you in doubts & scoring excellent marks in Class 11 exams.
Updated on:21/07/2023Topper's Solved these Questions
Similar Questions
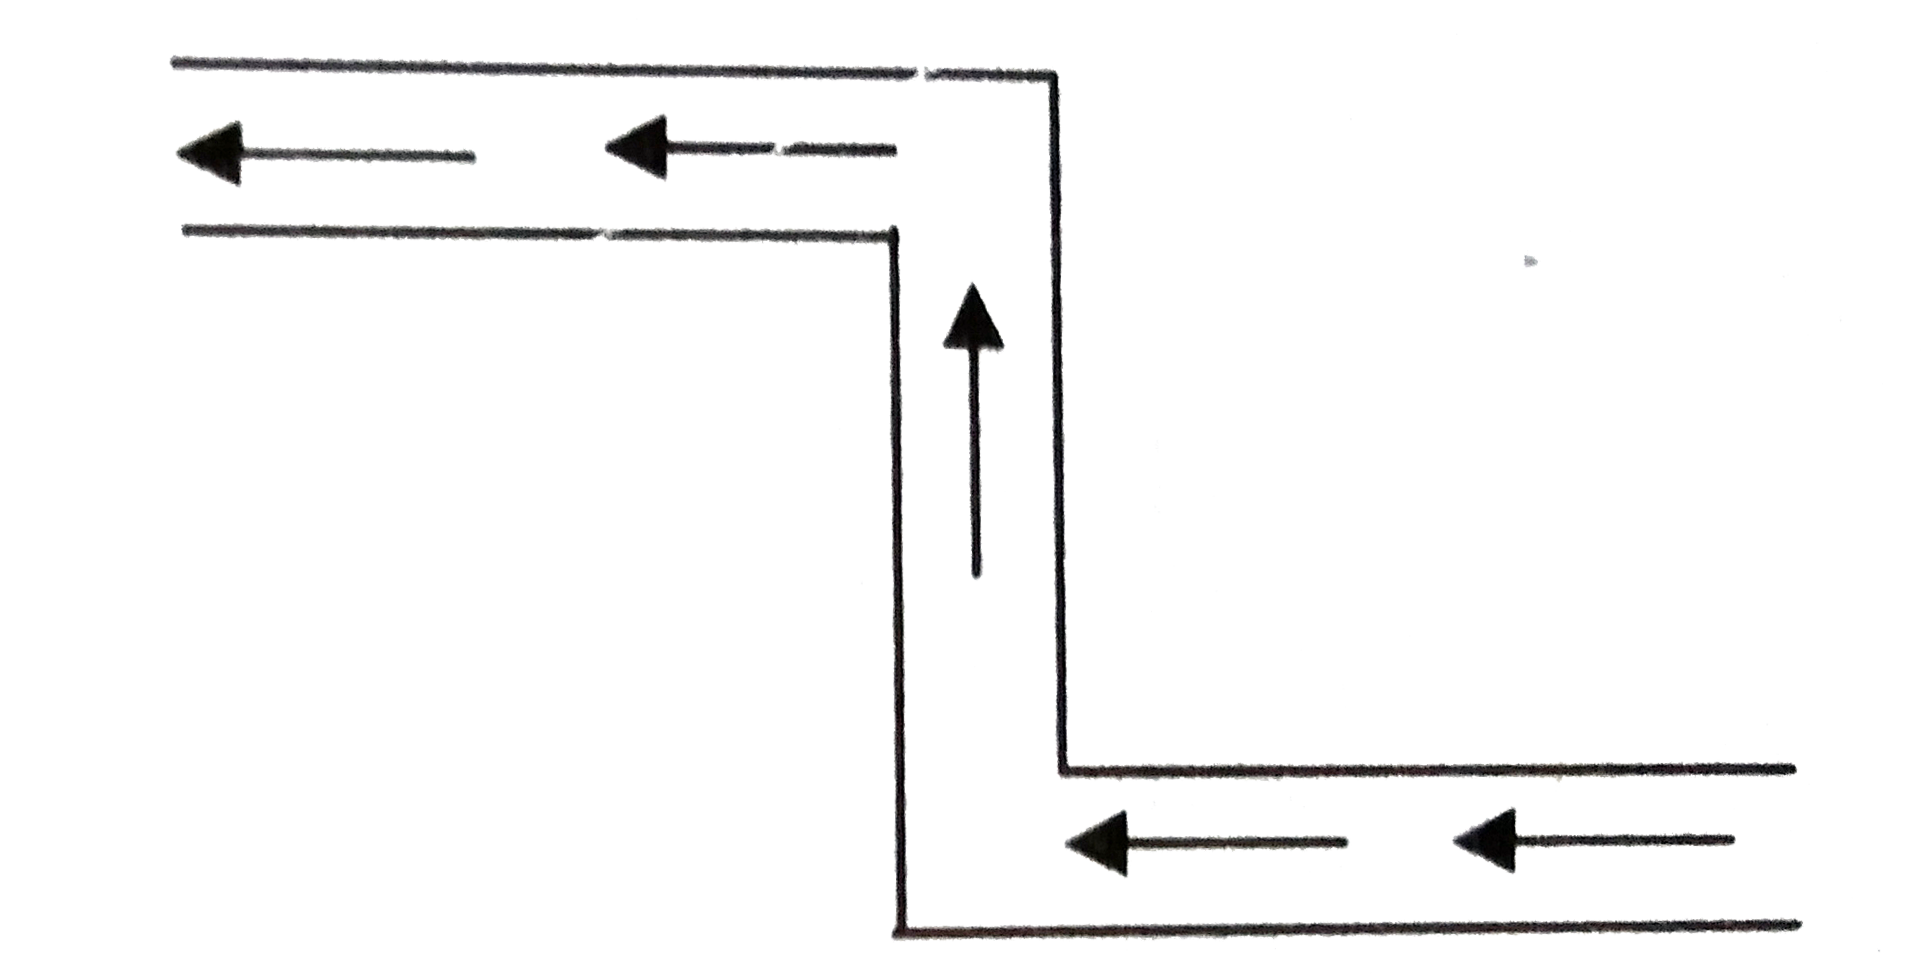
The figure bwlow indicates flow of water through a tube of uniform cross-section with a constant speed in the direction as shown by the arrows. On the tube, water exerts

View SolutionWater flows through a tunnel from the reservior of a dam towards the turbine installed in its power plant . The power plant is situated h metre below the reservoir . If the ratio of the cross sectional areas of the tunnel at the resercoir and power station end is η , find the speed of the water entering into the turbine .
View Solution
Knowledge Check
The given figure shows hydrophonic/soil less plant production. Plants are grown in a tube or through placed on a slight incline. The arrows indicate the direction of flow of nutrient solution.
Nutrient solution is sent to the elevated end of the tube from the reservoir by __________ and it flows back into reservoir due to __________
 APump, PumpBGravity, GravityCGravity, PumpDPump, Gravity
Plants can be cultivated in soil less medium where all required nutrients are supplied from the outside in water solution, this method comes under
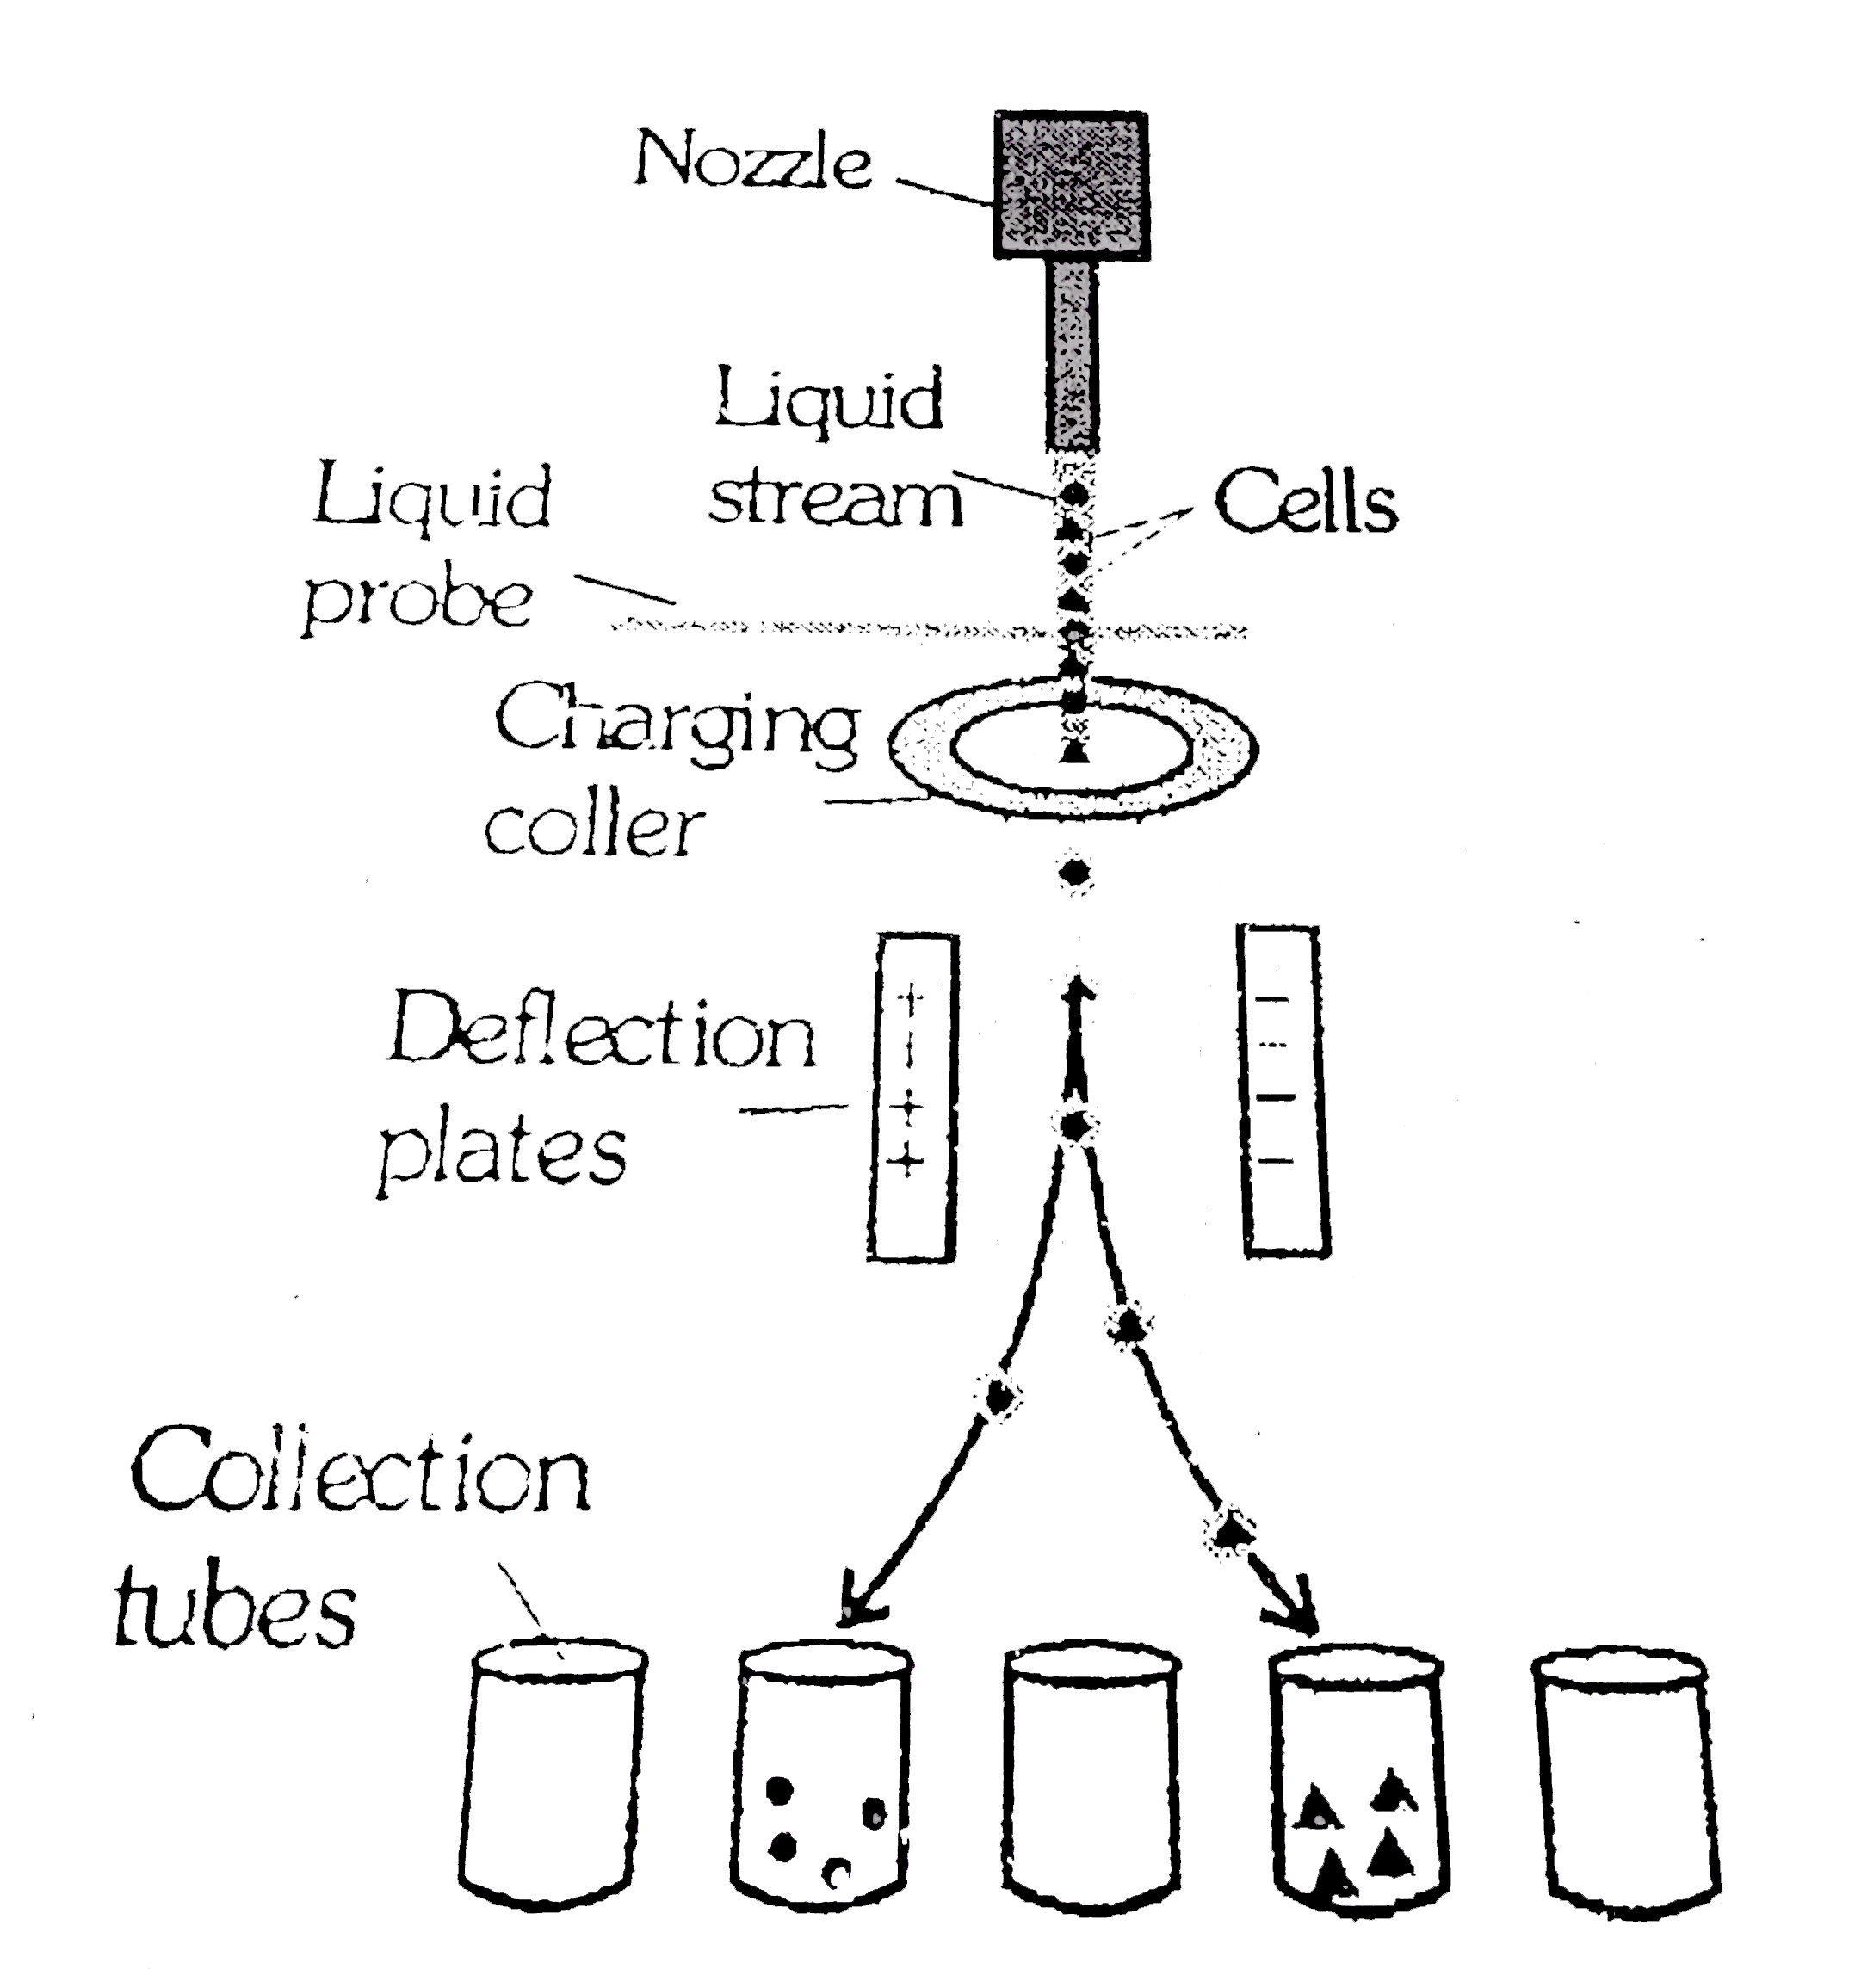
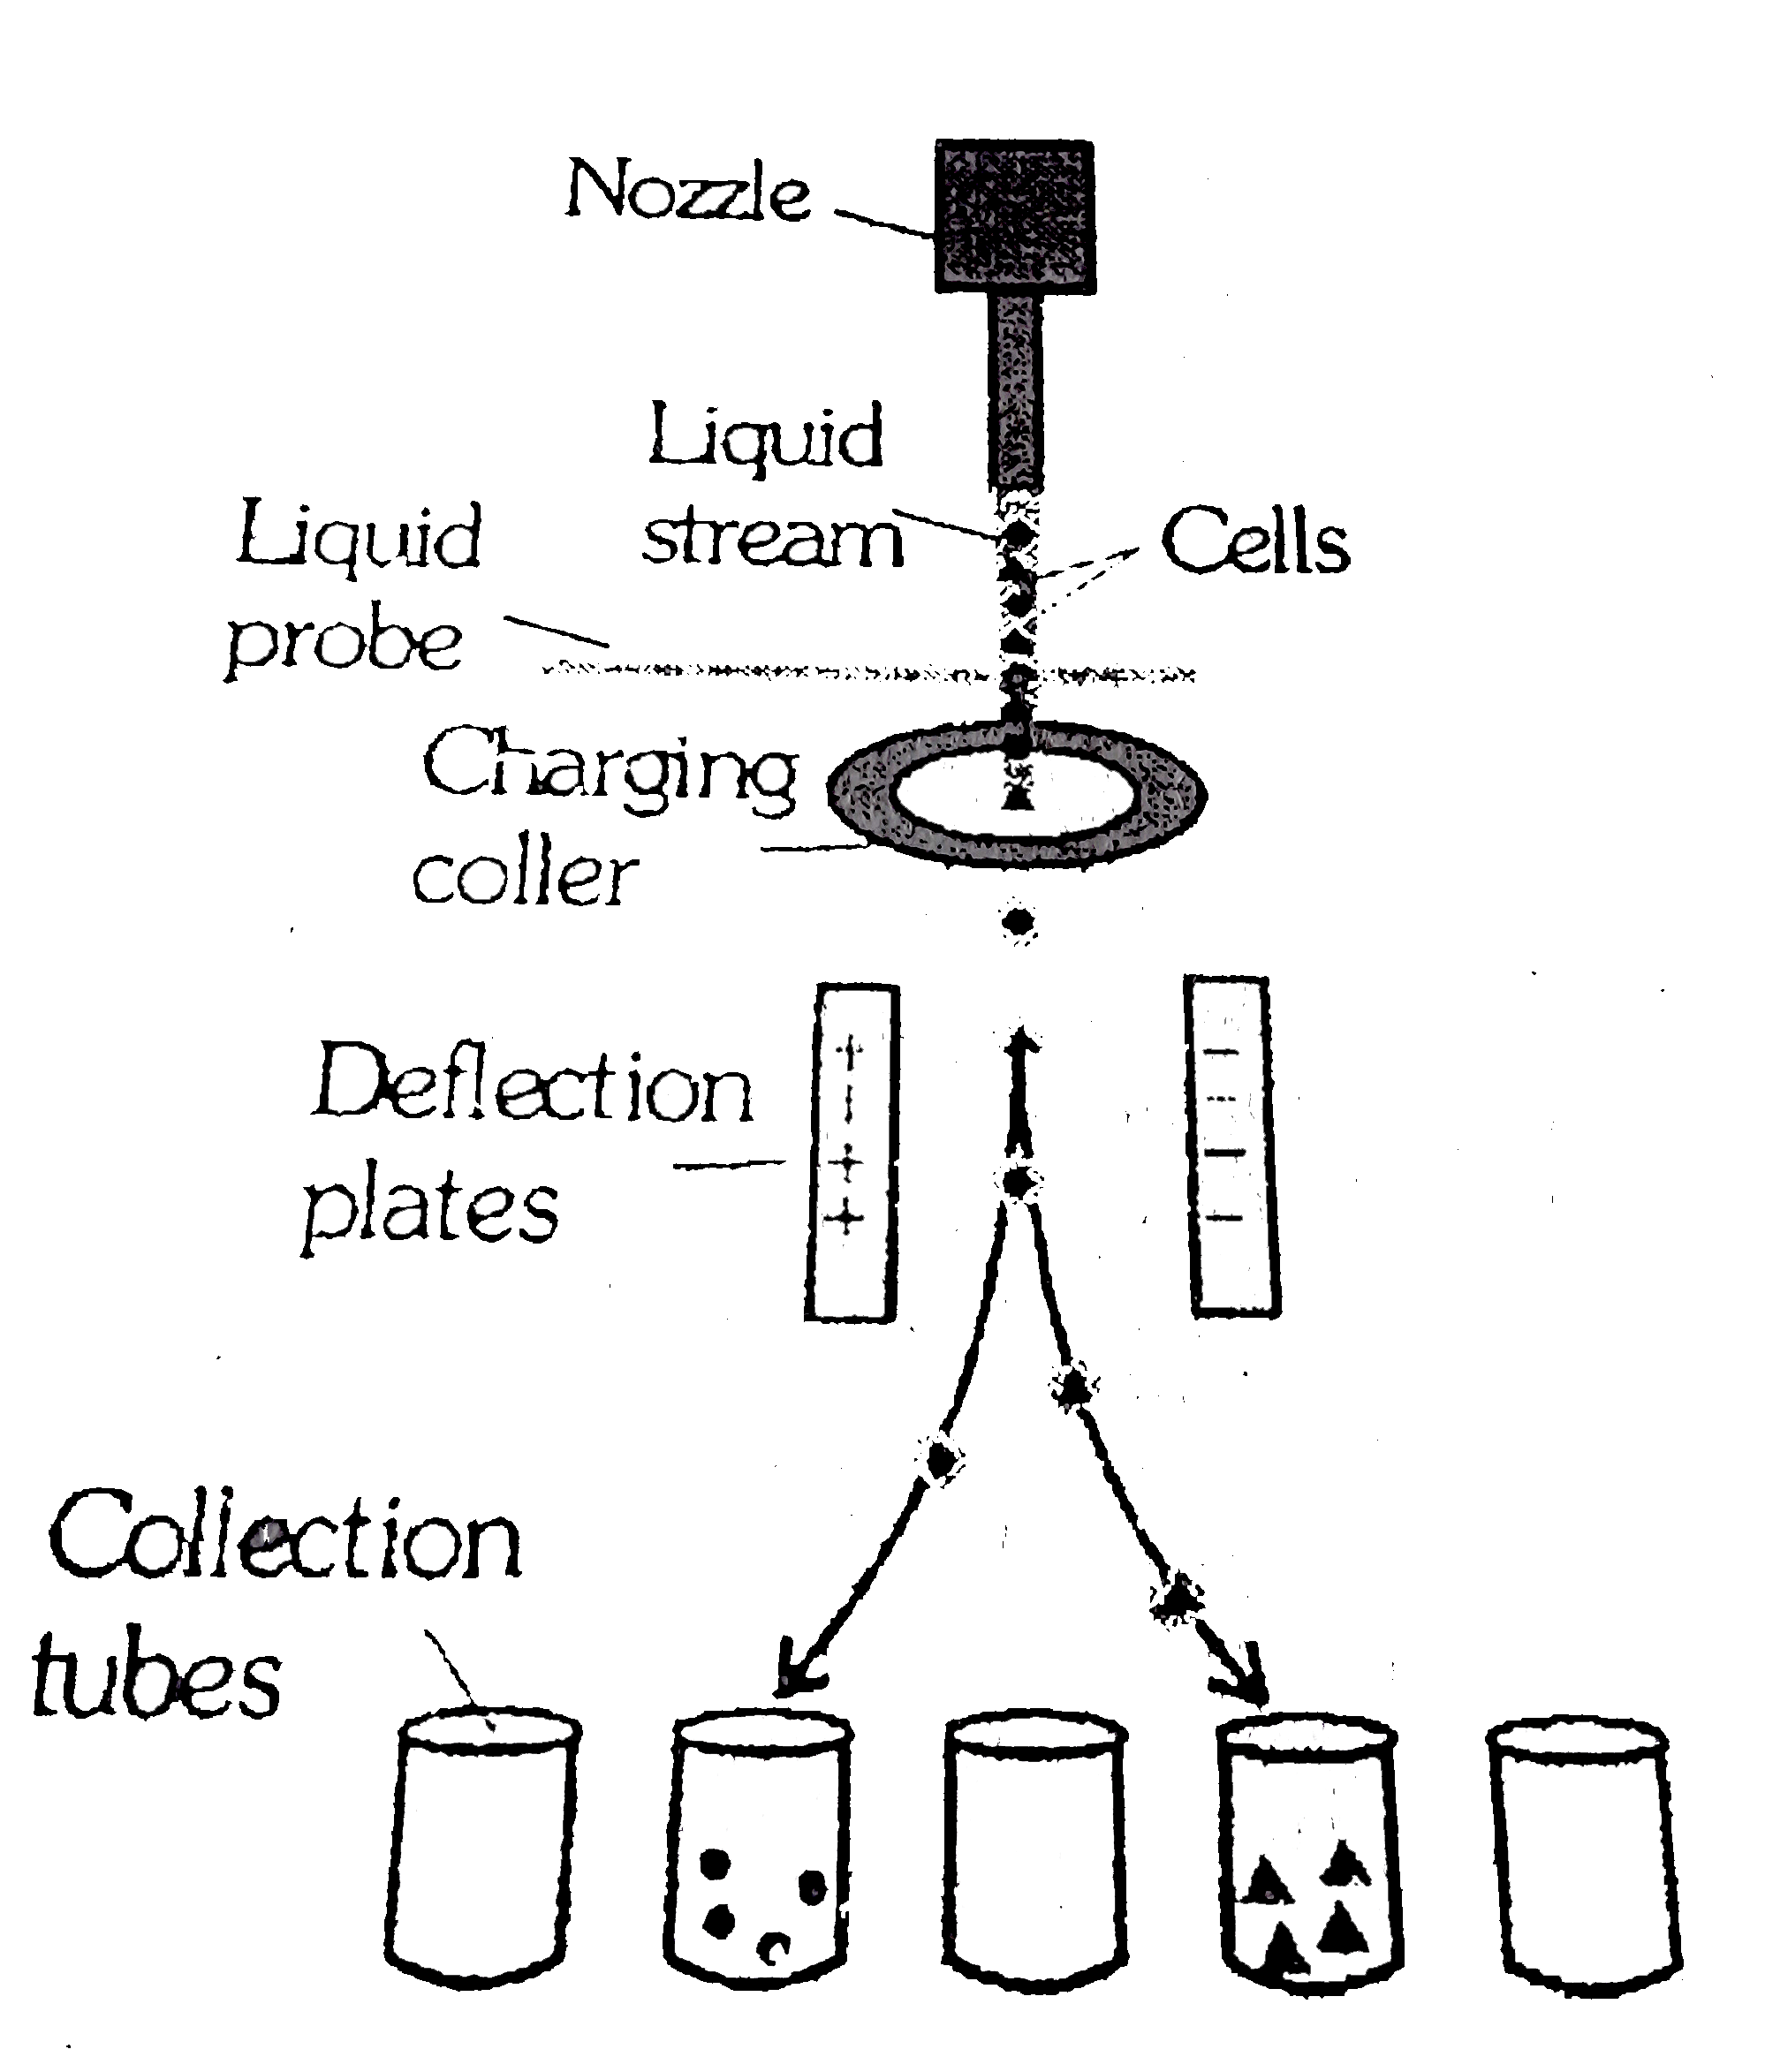
AAeroponicsBHydroponicsCHybrid cultureDCritical culture mediaFlow cytometry, illustrated in the figure, is a technique used to sort cells by type. The cells are placed in a conducting saline solution which is then forced from a nozzle. The stream breaks up into small droplets, each containing one cell. A metal collar surrounds the stream right at the point where the droplets seprate from the stream. Charging the collar polarizes the conducting liquid, causing the droplets to become charged as they break off from the steam. A leser beam probes the solution just upstream from the charging collar, looking for the presence of certain types of cells. All droplets containing one particular type of cell are given the same charge by the charging collar. Droplets with other desired types of cells receive a different charge, and droplats with no desired cell receive no charge. The charged. The charges droplets then pass between two parallel charged electrodes where they receive a horizontal force that directs force that directs them into different collection tubes, depending on air charge.

A+2q,+q,O,−q,−2qB+q,+2q,0,−2q,−qC−q,−2q,0,+2q,+qD−2q,−q,0,+q,+2q
The organs A of a person have been damaged completely due to which too much of a poisonous waste material B has started accumulating in his blood, making it dirty. In order to save this person's life, the blood from an artery in the person's arm is made to flow into long tubes made of substance E which are kept in coiled form in a tank containing solution F. This solution contains three materials G, H and I in similar proportions to those in normal blood. As the person's blood passes through long tubes of substance E, most of the wastes present in it go into solution. The clean blood is then put back into a vein in the arm of the person for circulation
(a) What are organs A ?
(b) Name the waste substance B
(c) What are (i) E, and (ii) F ?
(d) Name G, H and I
(e) What is the process described above known as ?
View Solution(i) An organ pipe has one end closed and at the other end there is a vibrating diaphragm. The diaphragm is a pressure node. The pipe resonates when the frequency of the diaphragm is 2 KHz. Distance between adjacent nodes is 8.0 cm. When the frequency is slowly reduced, the pipe again resonates at 1.2 KHz.
(a) Find the length of the tube.
(b) Find the next frequency above 2 KHz at which the pipe resonates.
(ii) The figure shows an arrangement for measuring the speed of sound in air. A glass tube is fitted with a movable piston that allows the indicated length L to be adjusted. There is enough gap between the piston and the tube wall to allow the air to pass through it. A speaker is placed near the open end of the tube. A microphone is placed close to the speaker and it is connected to a waveform display. The display is a pure sinusoidal waveform making 750 oscillations in 5 s. Initially, the piston is held at end A and is then slowly pulled back. Loud sound is produced by the tube when L=50cm and L=157cm. Calculate the speed of sound in air.

View SolutionFlow cytometry, illustrated in the figure, is a technique used to sort cells by type. The cells are placed in a conducting saline solution which is then forced from a nozzle. The stream breaks up into small droplets, each containing one cell. A metal collar surrounds the stream right at the point where the droplets seprate from the stream. Charging the collar polarizes the conducting liquid, causing the droplets to become charged as they break off from the steam. A leser beam probes the solution just upstream from the charging collar, looking for the presence of certain types of cells. All droplets containing one particular type of cell are given the same charge by the charging collar. Droplets with other desired types of cells receive a different charge, and droplats with no desired cell receive no charge. The charged. The charges droplets then pass between two parallel charged electrodes where they receive a horizontal force that directs force that directs them into different collection tubes, depending on air charge.

Another way to sort the droplets would be to given each droplet the same charge, then vary the electric field between the deflection plates. For the apparatus as sketched, this technique will not work because
View SolutionRead the following passage and answer the questions given after it. The ocean will not look the same color in the future. Essentially, climate change will make the blues of the ocean bluer and the greens greener. Scientists from MIT, Boston, figured this out by creating a global model that simulates the growth of a tiny creature that lives in the oceans and affects the color we see. Their research was published in the journal Nature Communications.
The ocean looks blue or green to us because of a combination of how sunlight interacts with water molecules and with whatever else lives in that water.
The molecules in water absorb all but the blue part of the spectrum of sunlight, and the water reflects that blue color back. That's the color we see.
The water looks greener when it has more phytoplankton, tiny, microscopic organisms that, like plants, can use chlorophyll to capture mostly the blue portions of the spectrum of sunlight. They then use photosynthesis to create the chemical energy they need to live. When there are more of these creatures in the water absorbing sunlight, they make the water look greener. Conversely, if there are fewer phytoplankton, the water looks bluer.
The creatures' growth is dependent on how much sunlight, carbon dioxide and nutrients are around. Climate change is altering the ocean currents, meaning there will be fewer nutrients for phytoplankton to feed on in some areas, so there will be a decline in their number in those regions.
Since the 1908, satellites have taken regular measurements of how much chlorophyll is in the ocean. Those levels can change because of weather events or because of climate change.
The study predicts that the blues will intensify, most likely in subtropical regions where phytoplankton will decrease. These are areas near the equator like Bermuda and the Bahamas that are already quite low in phytoplankton.
Regions where there are a lot of nutrients, like in the Southern Ocean or parts of the North Atlantic, will see even faster-growing phytoplankton because those waters are warming with climate change. Those waters will look greener.
Climate change will bring a color change to half of the world's oceans by the end of the century, the study says. That's bad on several levels: For one, phytoplankton remove about as much carbon dioxide from the air as plants and help regulate our climate, research shows.
They are also key to other animals' survival" Phytoplankton are at the base, and if the base changes, it endangers everything else along the food web, going far enough to the polar bears or tuna or just about anything that you want to eat or love to see in pictures, "said Stephanie Dutkiewicz, a principal research scientist in MIT.
In which areas will the ocean look bluer?
View SolutionRead the following passage and answer the questions given after it. The ocean will not look the same color in the future. Essentially, climate change will make the blues of the ocean bluer and the greens greener. Scientists from MIT, Boston, figured this out by creating a global model that simulates the growth of a tiny creature that lives in the oceans and affects the color we see. Their research was published in the journal Nature Communications.
The ocean looks blue or green to us because of a combination of how sunlight interacts with water molecules and with whatever else lives in that water.
The molecules in water absorb all but the blue part of the spectrum of sunlight, and the water reflects that blue color back. That's the color we see.
The water looks greener when it has more phytoplankton, tiny, microscopic organisms that, like plants, can use chlorophyll to capture mostly the blue portions of the spectrum of sunlight. They then use photosynthesis to create the chemical energy they need to live. When there are more of these creatures in the water absorbing sunlight, they make the water look greener. Conversely, if there are fewer phytoplankton, the water looks bluer.
The creatures' growth is dependent on how much sunlight, carbon dioxide and nutrients are around. Climate change is altering the ocean currents, meaning there will be fewer nutrients for phytoplankton to feed on in some areas, so there will be a decline in their number in those regions.
Since the 19908, satellites have taken regular measurements of how much chlorophyll is in the ocean. Those levels can change because of weather events or because of climate change.
The study predicts that the blues will intensify, most likely in subtropical regions where phytoplankton will decrease. These are areas near the equator like Bermuda and the Bahamas that are already quite low in phytoplankton.
Regions where there are a lot of nutrients, like in the Southern Ocean or parts of the North Atlantic, will see even faster-growing phytoplankton because those waters are warming with climate change. Those waters will look greener.
Climate change will bring a color change to half of the world's oceans by the end of the let century, the study says. That's bad on several levels: For one, phytoplankton remove about as much carbon dioxide from the air as plants and help regulate our climate, research shows.
They are also key to other animals' survival" Phytoplankton are at the base, and if the base changes, it endangers everything else along the food web, going far enough to the polar bears or tuna or just about anything that you want to eat or love to see in pictures, "said Stephanie Dutkiewicz, a principal research scientist in MIT.
Where do phytoplankton grow profusely?
View Solution
