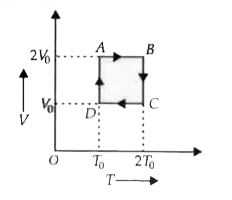
A sample of ideal gas is taken through the cyclic process shown in the figure. The temerauture of the gas in state A is TA =200 K. In states B and C the temperature of the gas is the same.
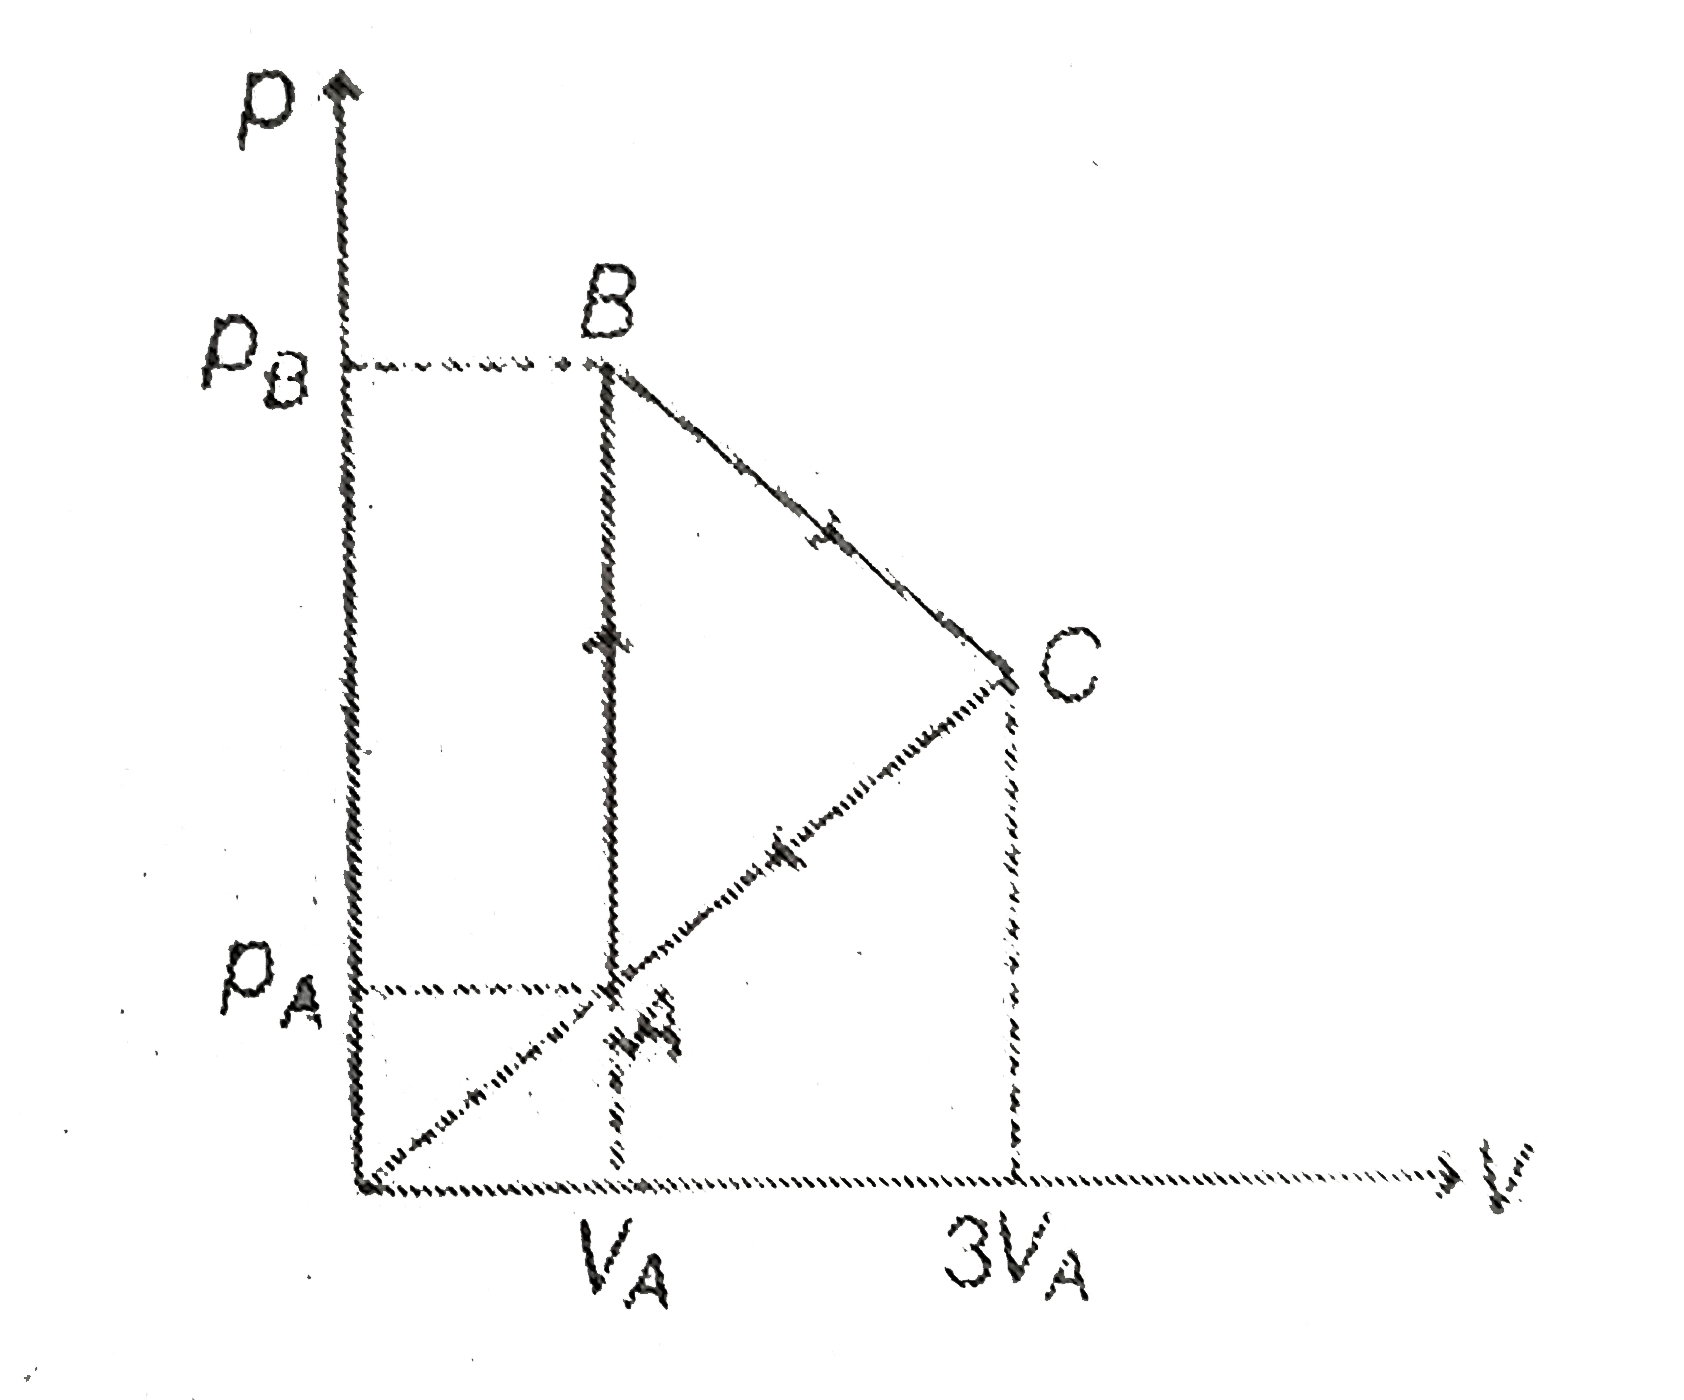
Which of the following graphs best reprsent the cyclic process in T-V diagram
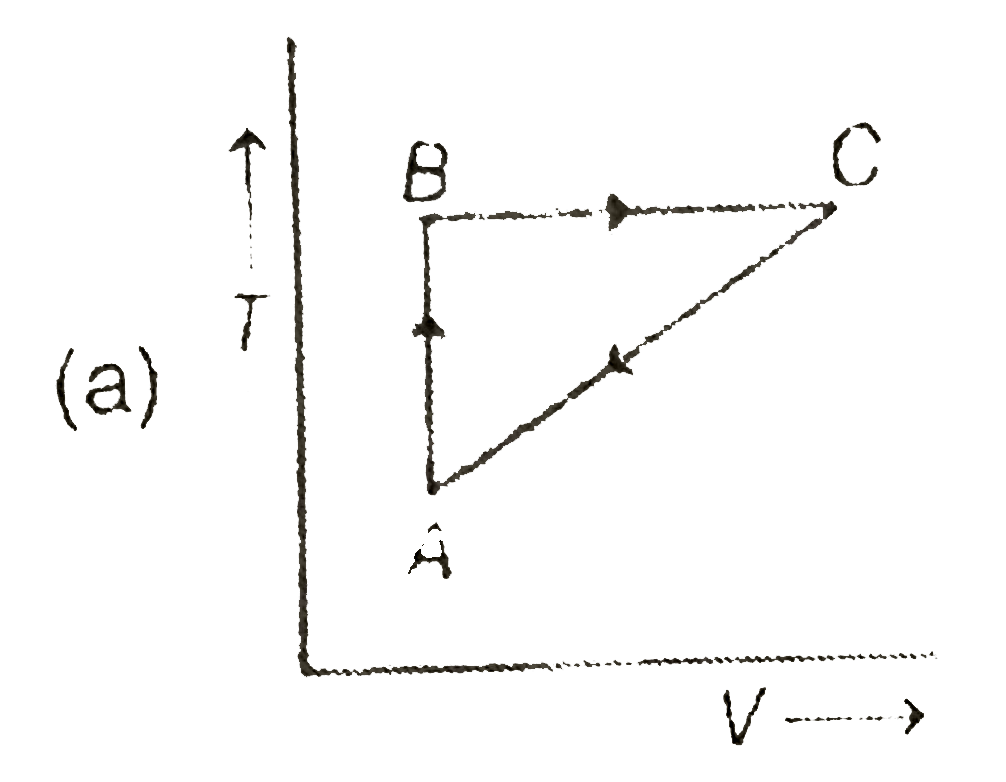
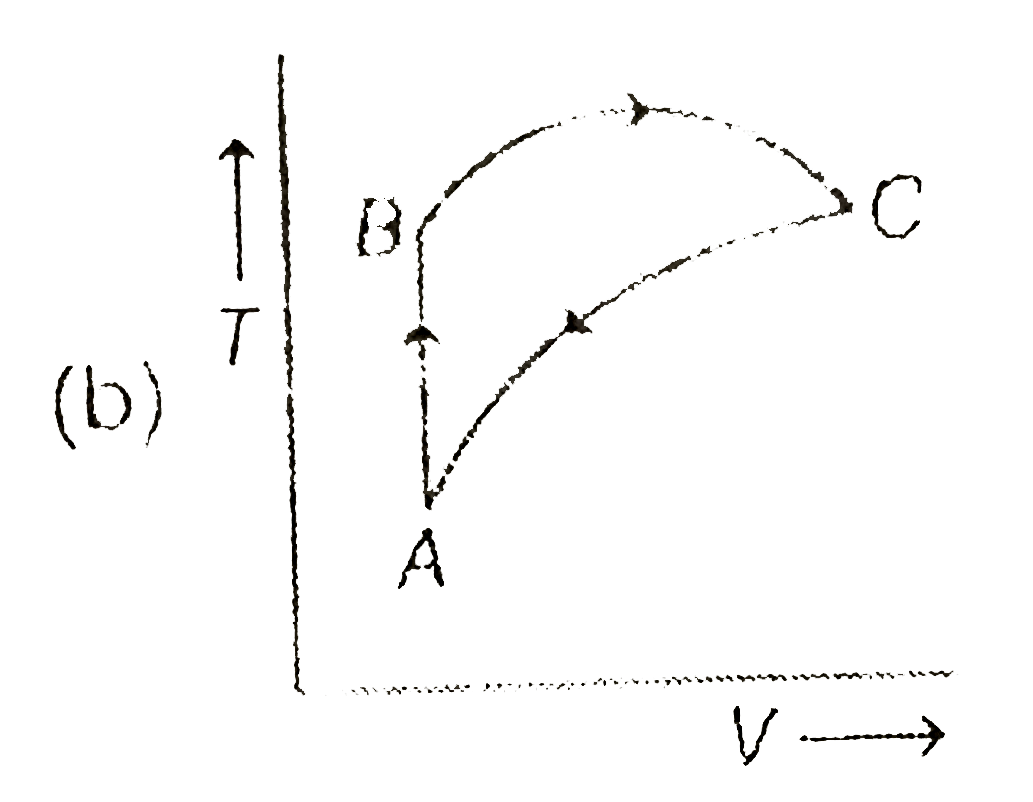
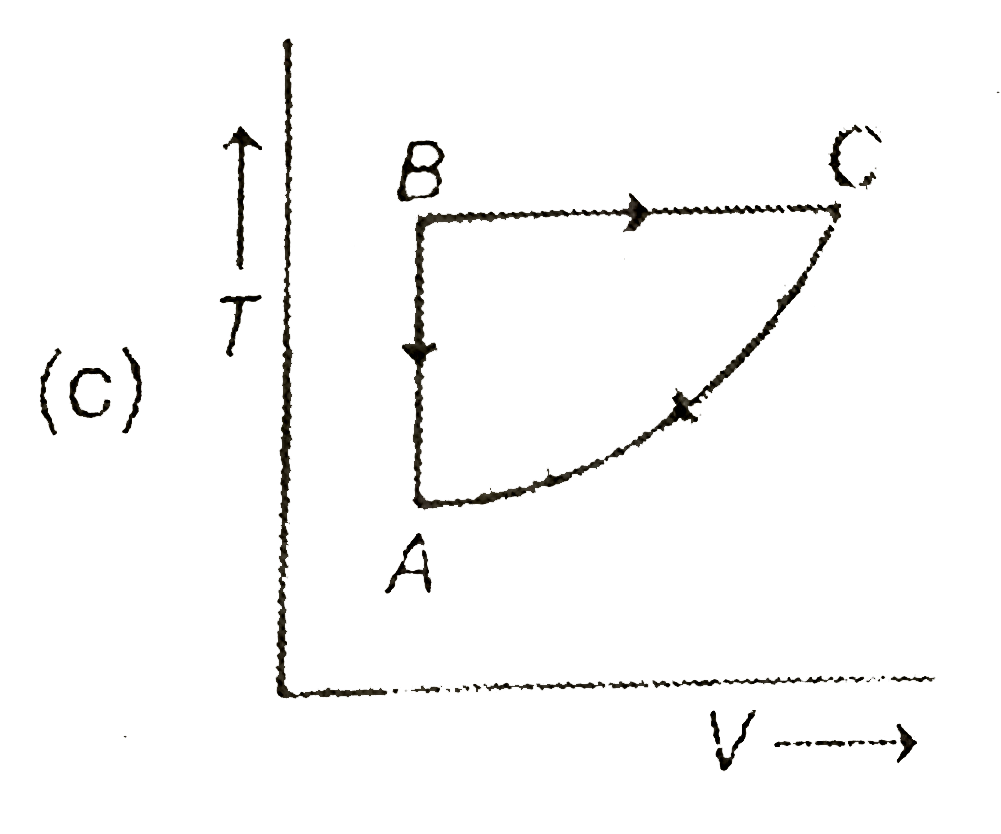
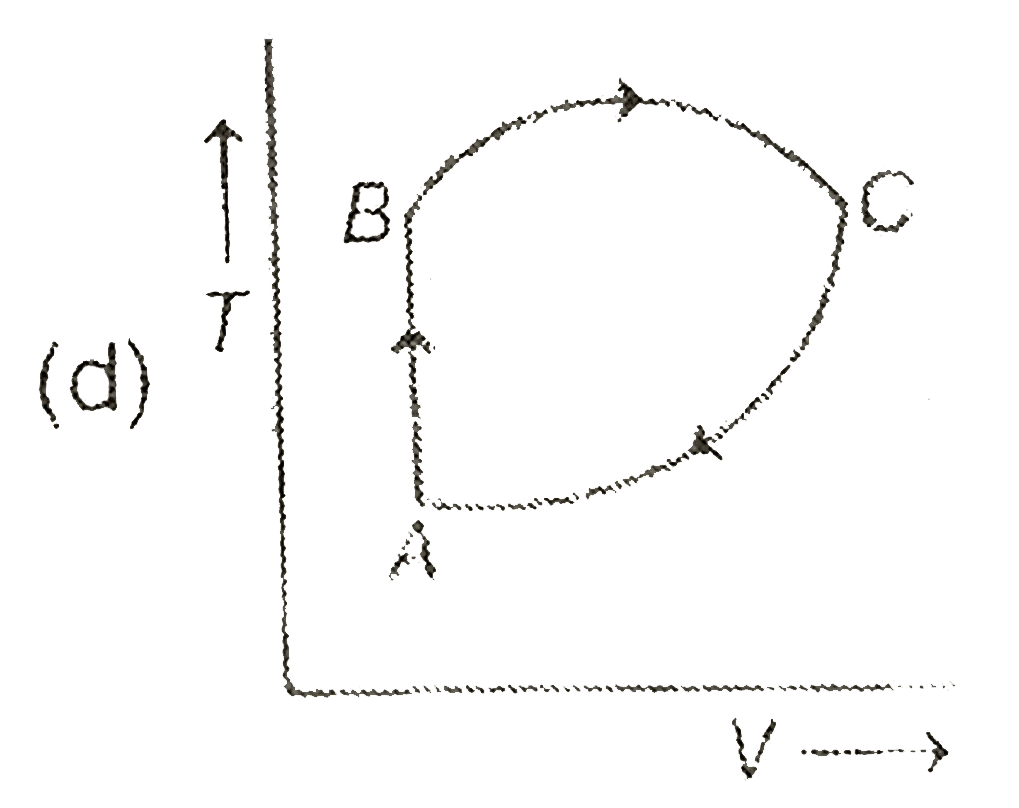
The correct Answer is:D
Step by step video, text & image solution for A sample of ideal gas is taken through the cyclic process shown in the figure. The temerauture of the gas in state A is T_(A) =200 K. In states B and C the temperature of the gas is the same. Which of the following graphs best reprsent the cyclic process in T-V diagram by Physics experts to help you in doubts & scoring excellent marks in Class 11 exams.
Updated on:21/07/2023Topper's Solved these Questions
Similar Questions
Knowledge Check
A sample of ideal gas is taken through the cyclic process shown in the figure. The temerauture of the gas in state A is TA =200 K. In states B and C the temperature of the gas is the same.
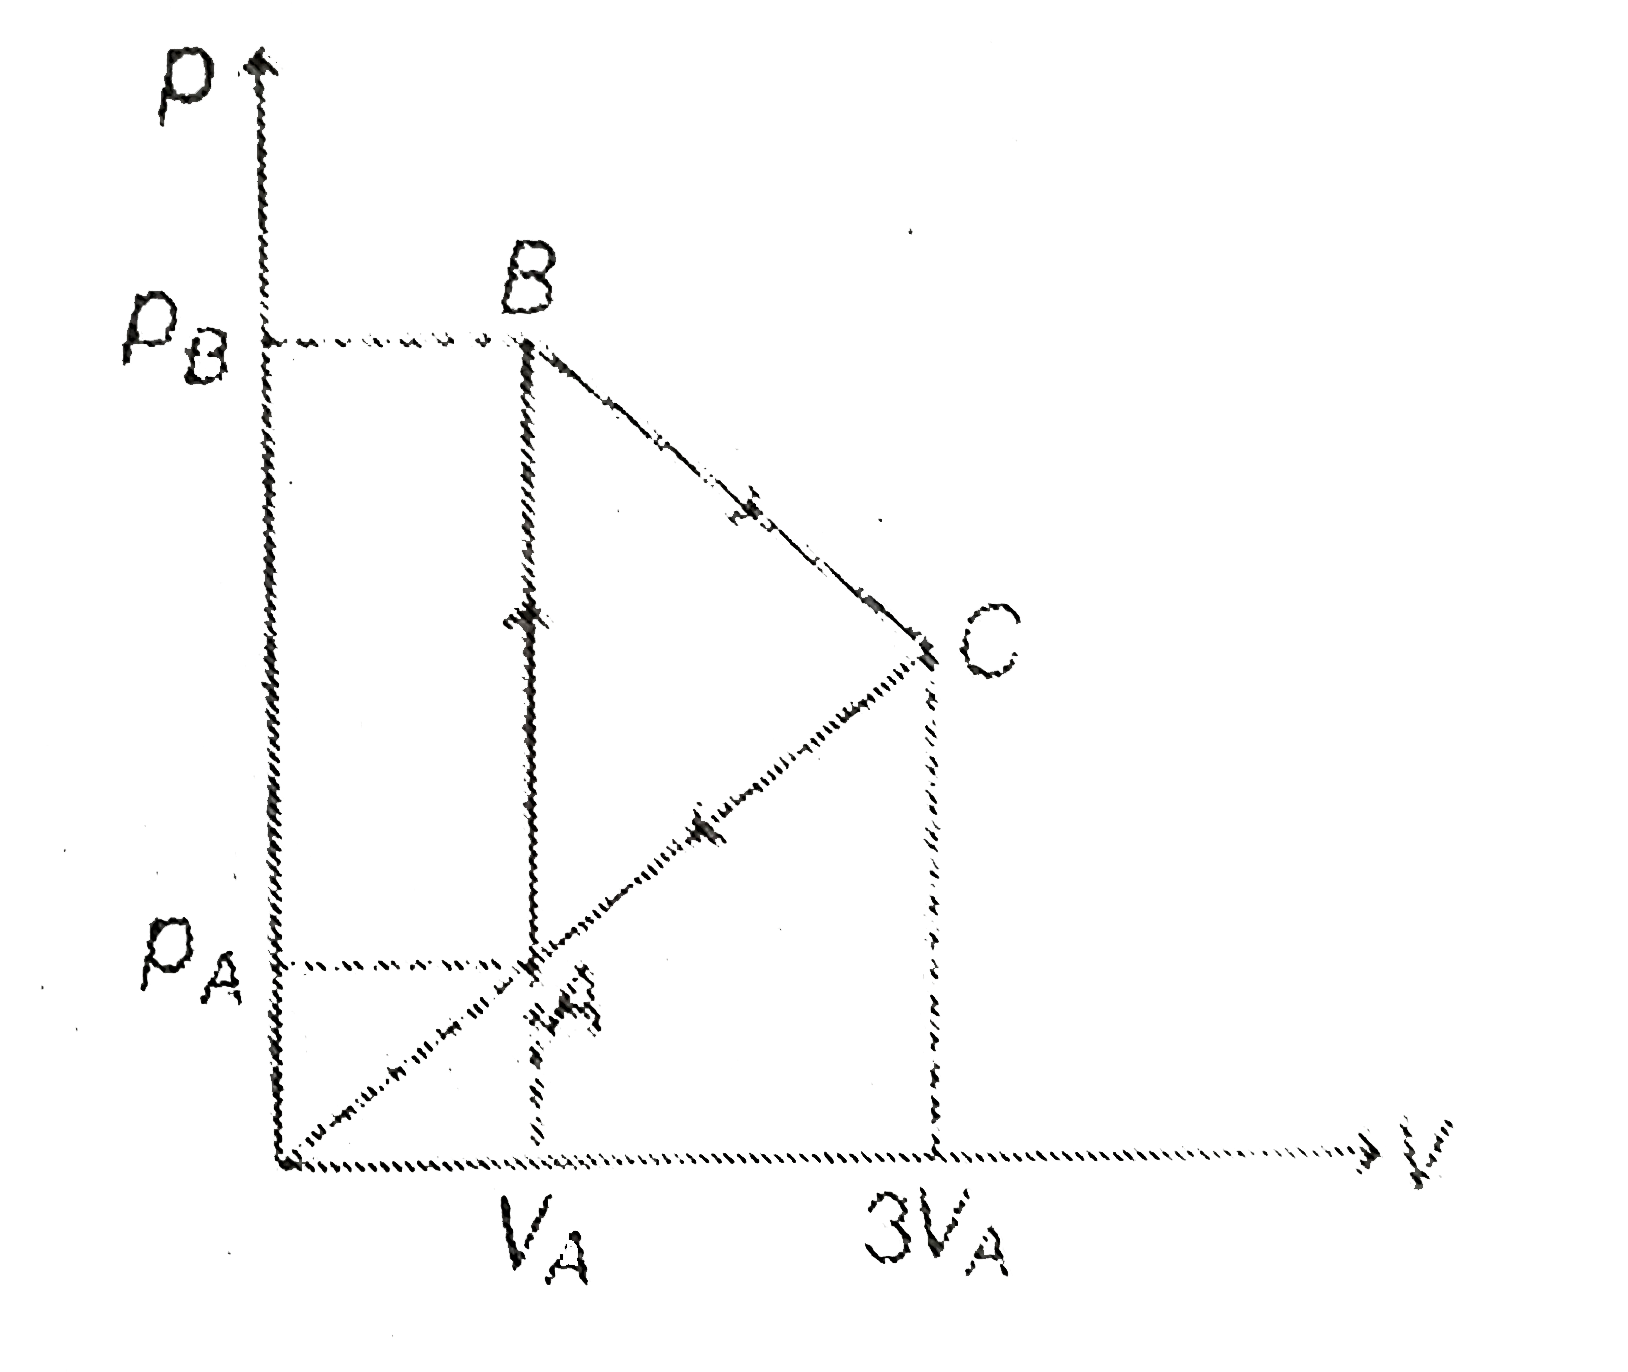
Net work done by the gas in the process isA2pAVAB4pAVAC6pAVAD8pAVAA sample of ideal gas is taken through the cyclic process shown in the figure. The temerauture of the gas in state A is TA =200 K. In states B and C the temperature of the gas is the same.

What is the greastes temperature of the gas during the cyclic process ?A600 KB1200 KC2400 KDNone of theseIdeal gas is taken through the process shown in the figure :
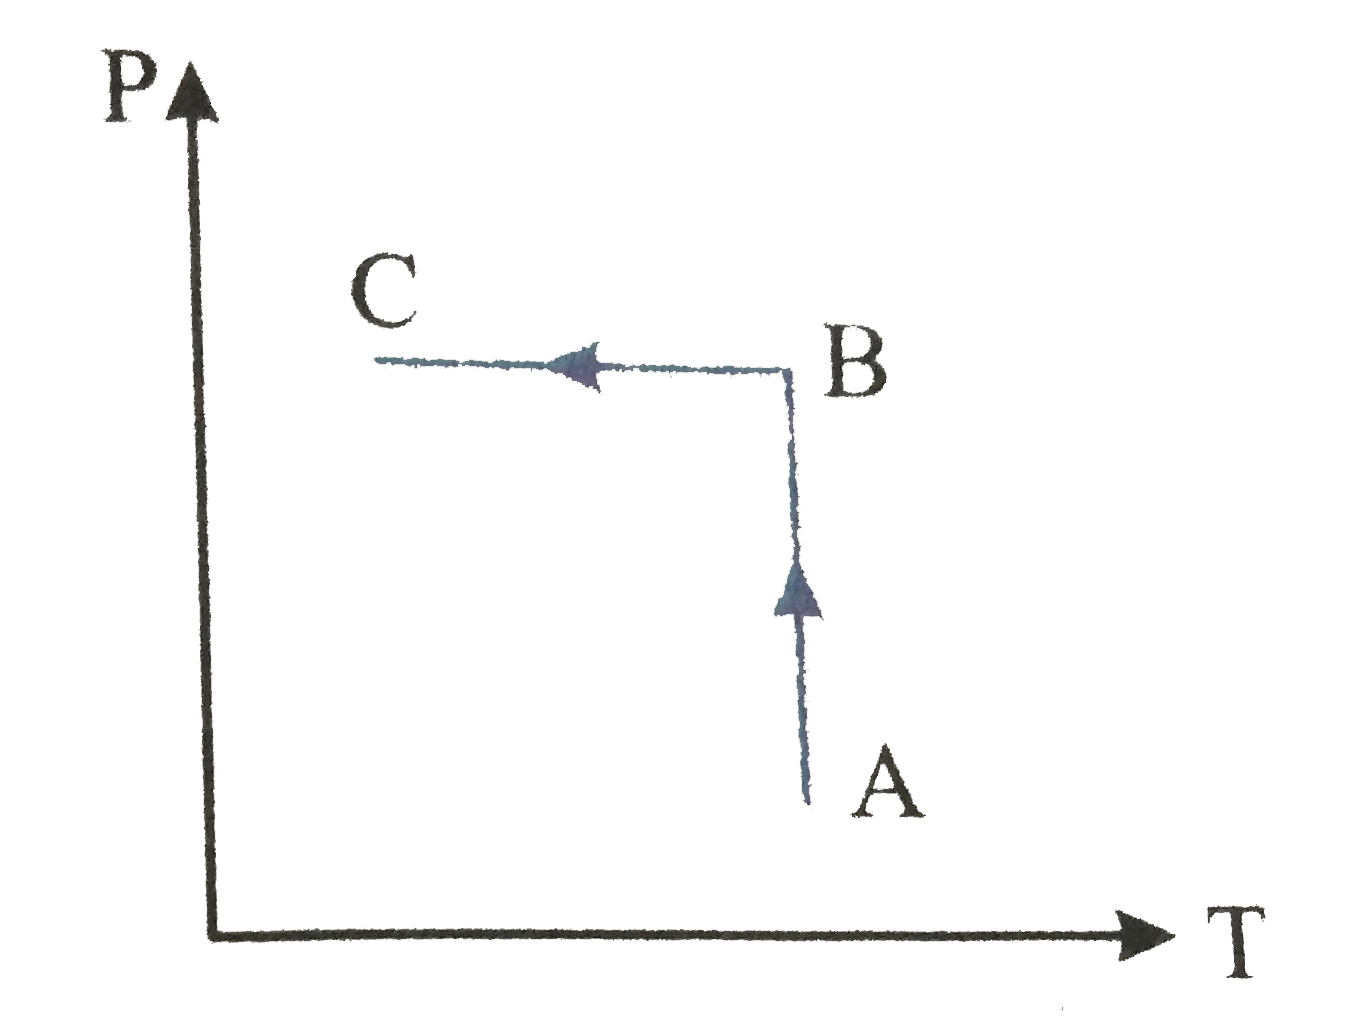 Ain process AB, work done by system is positiveBin process AB, heat is rejectedCin process AB, internal energy increasesDin process AB internal energy decreases and in process BC, internal energy increases.
Find the work done by gas going through a cyclic process shown in figure?

View SolutionIdeal gas is taken through process shown in figure :
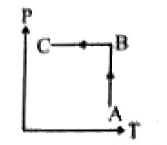
View SolutionIdeal gas is taken through process shown in figure
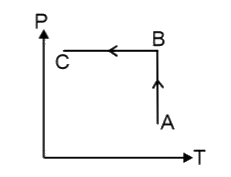
View SolutionAn ideal gas undergoes the cyclic process shown in a graph below :
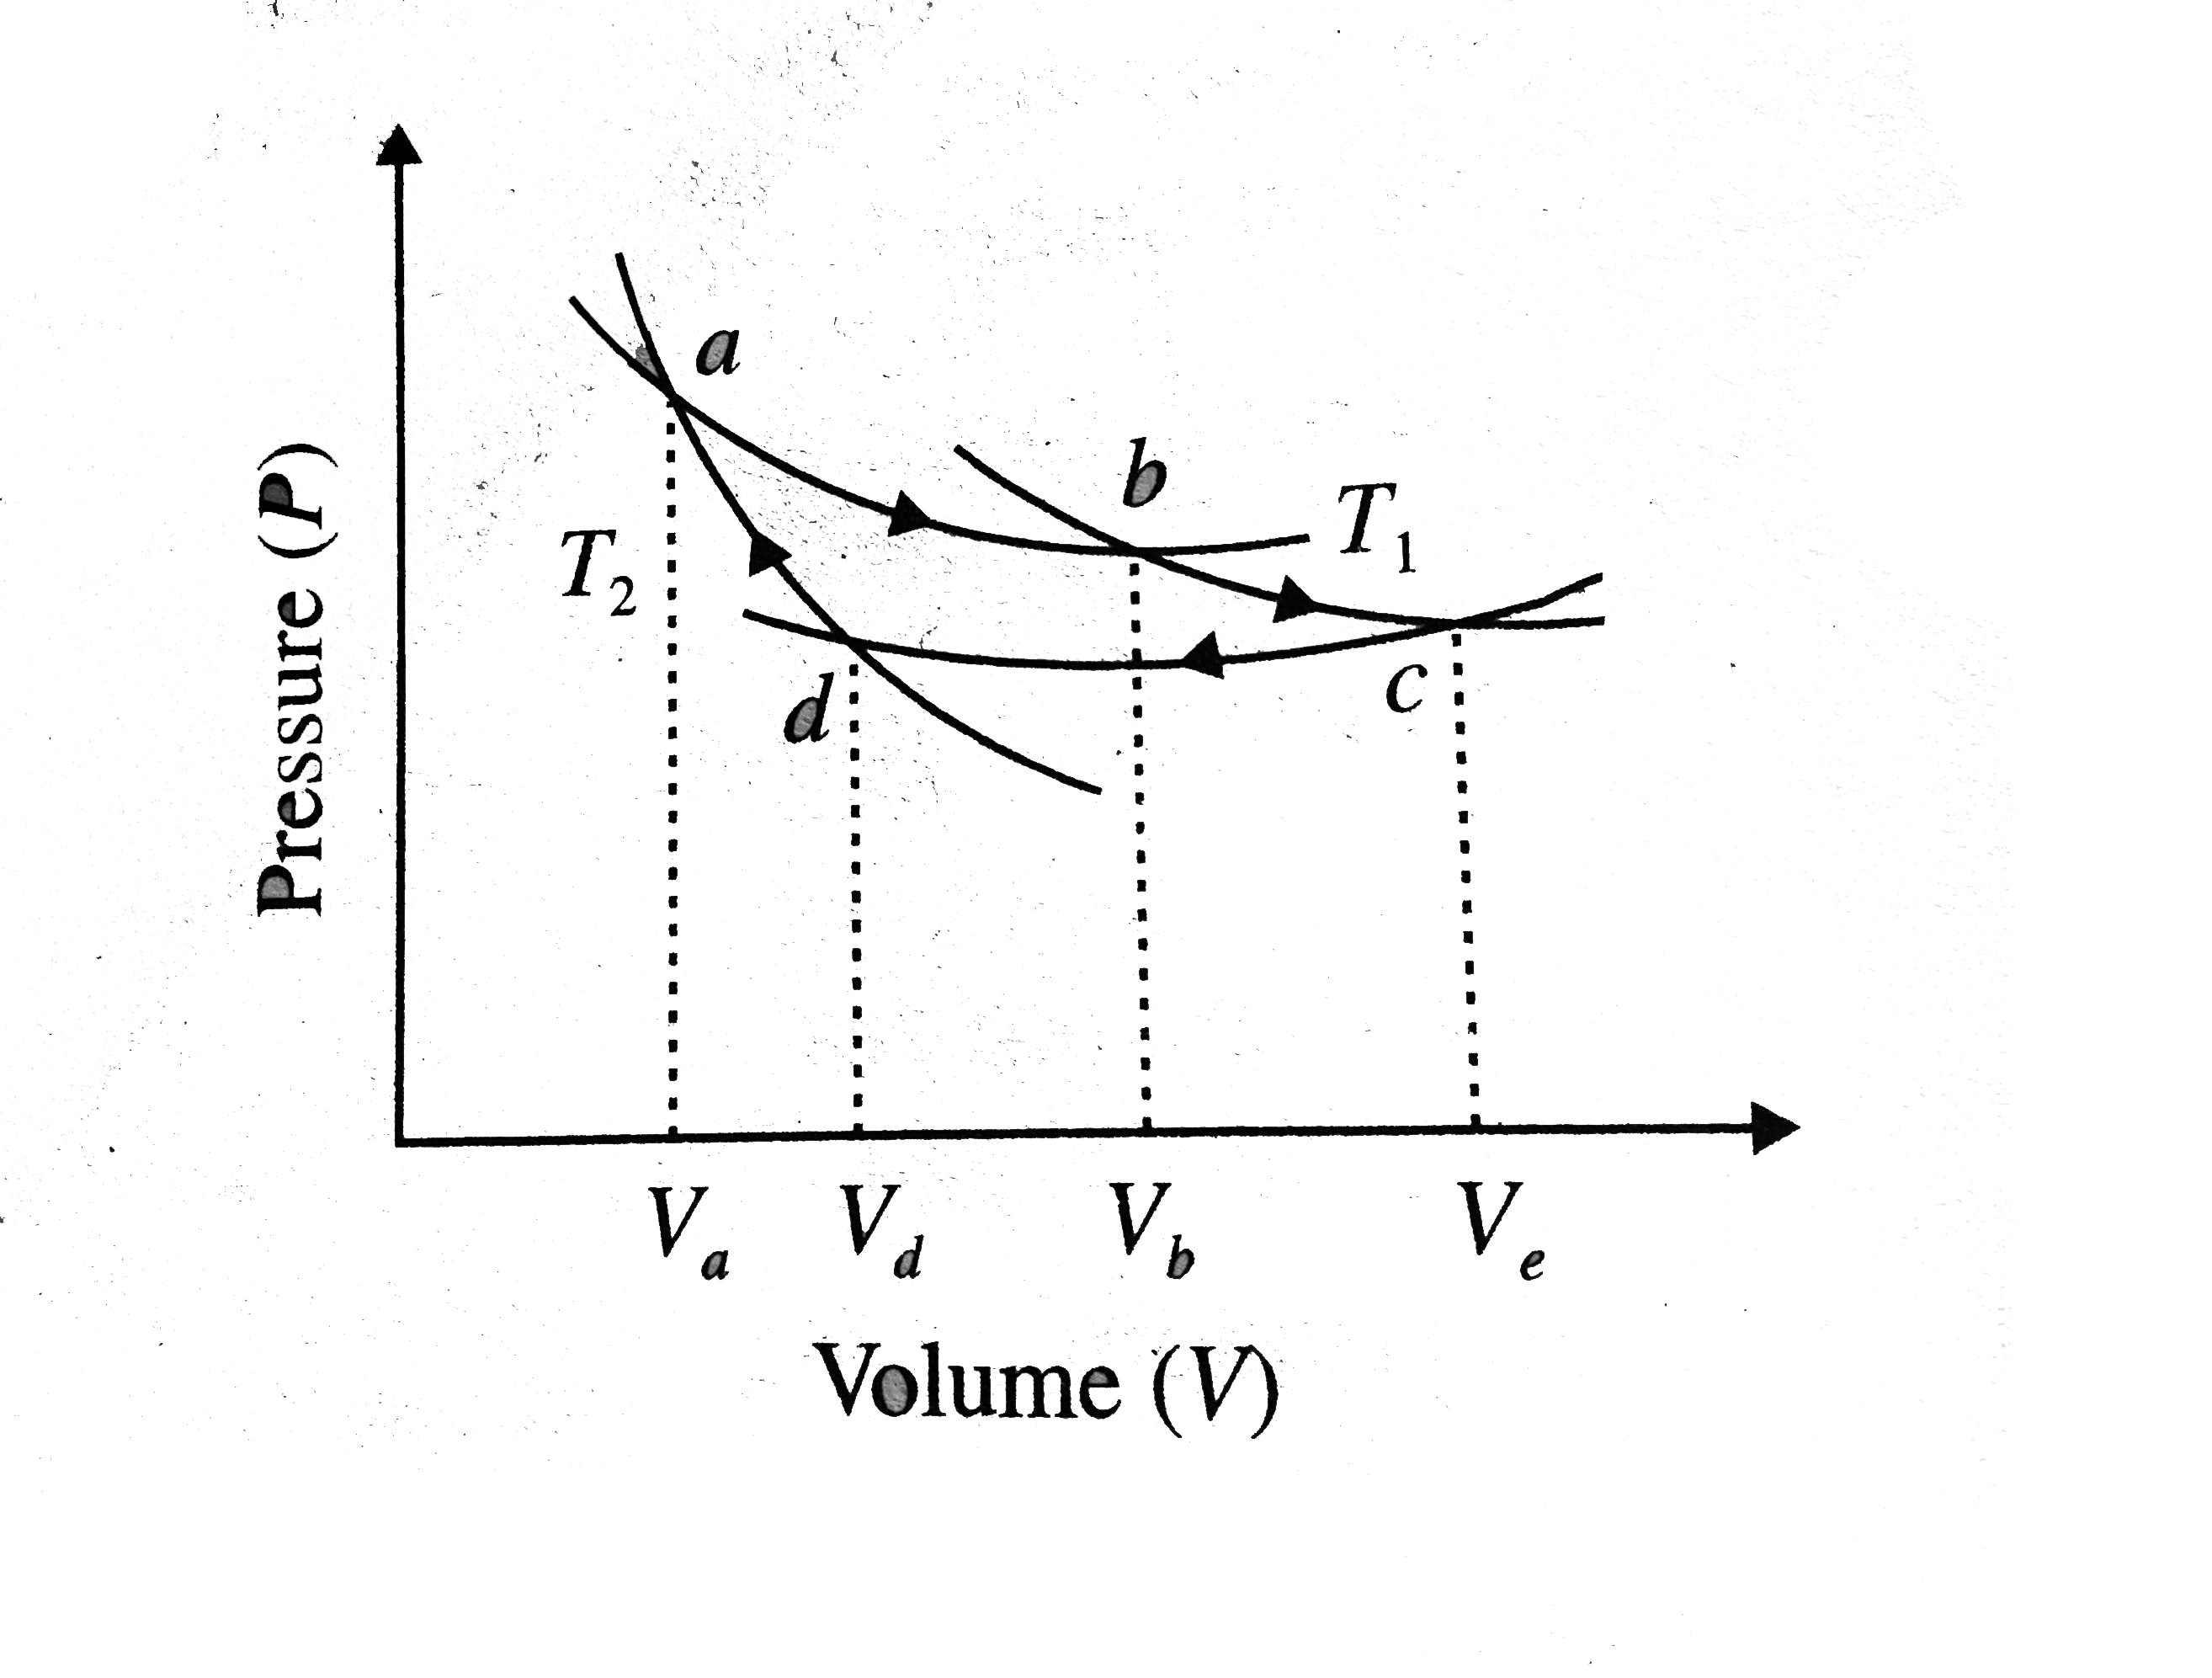
View SolutionOne mole of an ideal gas is taken through a cyclic process as shown in the V-T diagram. Which of the following statements is true ?
View Solution


