Ideal gas is taken through the process shown in the figure :
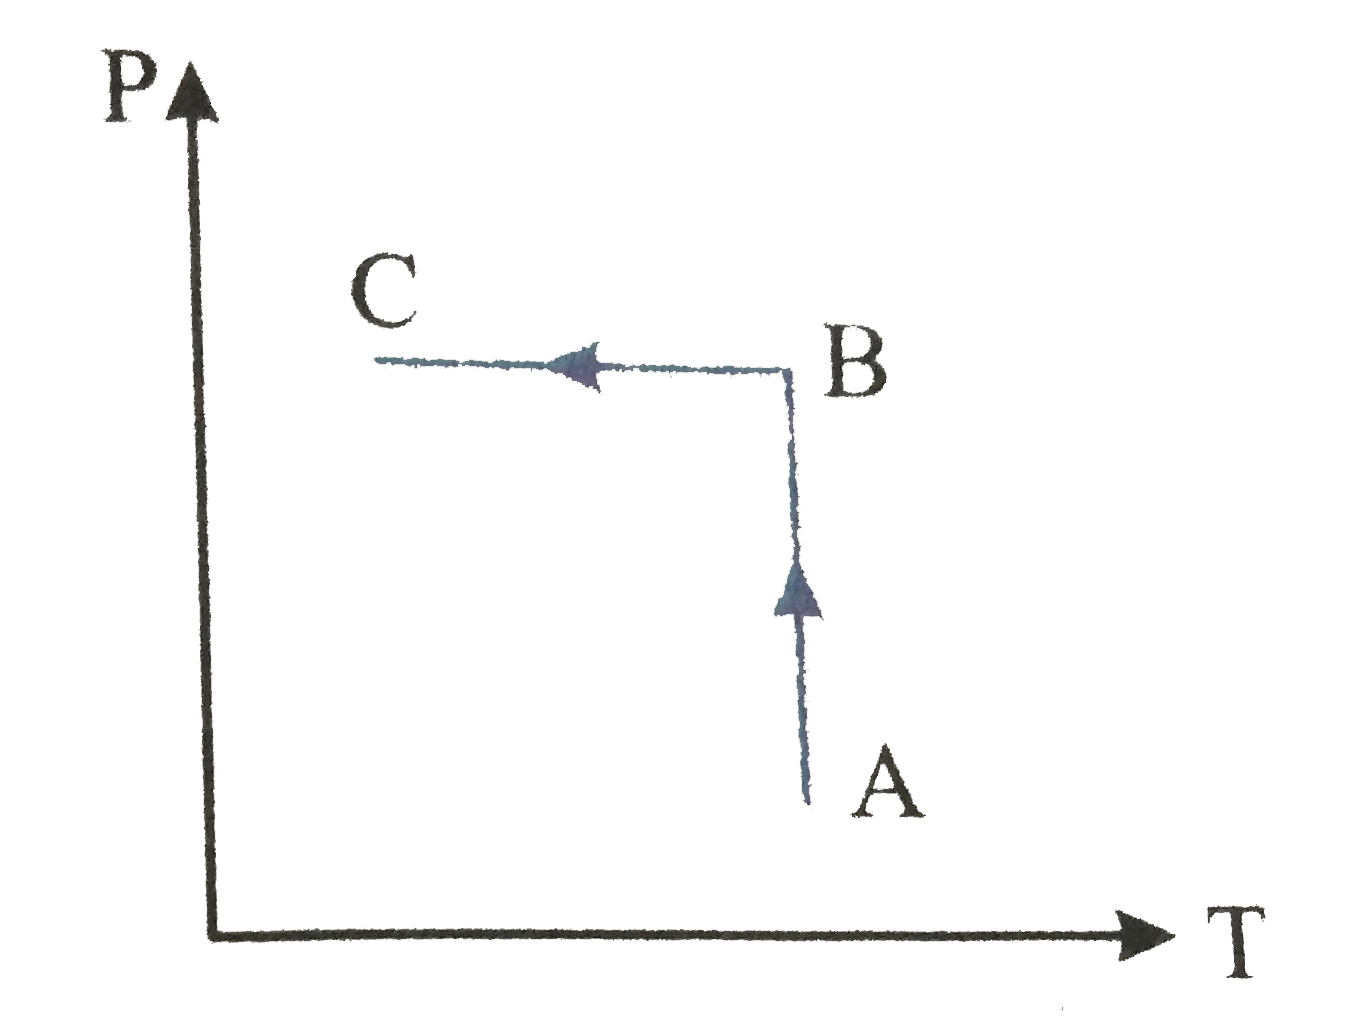
In process AB, work done by system is positive
In process AB, heat is rejected
In process AB, internal energy increases
In process AB internal energy decreases and in process BC, internal energy increases
The correct Answer is:B
Step by step video, text & image solution for Ideal gas is taken through the process shown in the figure : by Physics experts to help you in doubts & scoring excellent marks in Class 11 exams.
Updated on:21/07/2023Topper's Solved these Questions
Similar Questions
Ideal gas is taken through a process as shown in figure
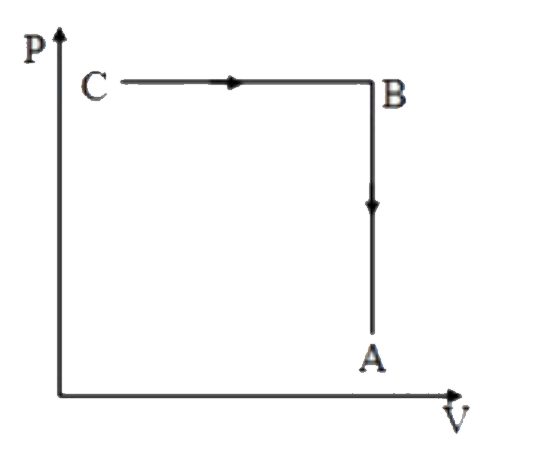
View SolutionA diatomic ideal gas is taken through the cyclic process shown in the figure in state 1 the pressure of the gas is 100 kPa and its temperature is 350 K in state 2 the pressure is 300 kPa What is the efficiency of the cycle in percent rounded to nearest integer[Takeln3=12/11]
View Solution
Knowledge Check
Ideal gas is taken through process shown in figure
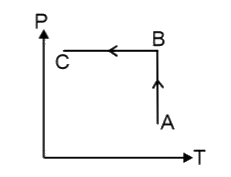 Aln process AB, work done by system is positiveBIn process AB, heat is rejected out of the system.CIn process AB, internal energy increasesDIn process AB internal energy decreases and
in process BC internal energy increasesIdeal gas is taken through process shown in figure :
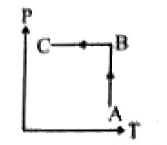 AIn process AB. work done by system is positiveBIn process AB, heat is reacted out of the system.Cprocess AB, internal exergy increasesDIn process AB internal energy decreases and in process BC Internal energy increases.
A sample of ideal gas is taken through the cyclic process shown in the figure. The temerauture of the gas in state A is TA =200 K. In states B and C the temperature of the gas is the same.
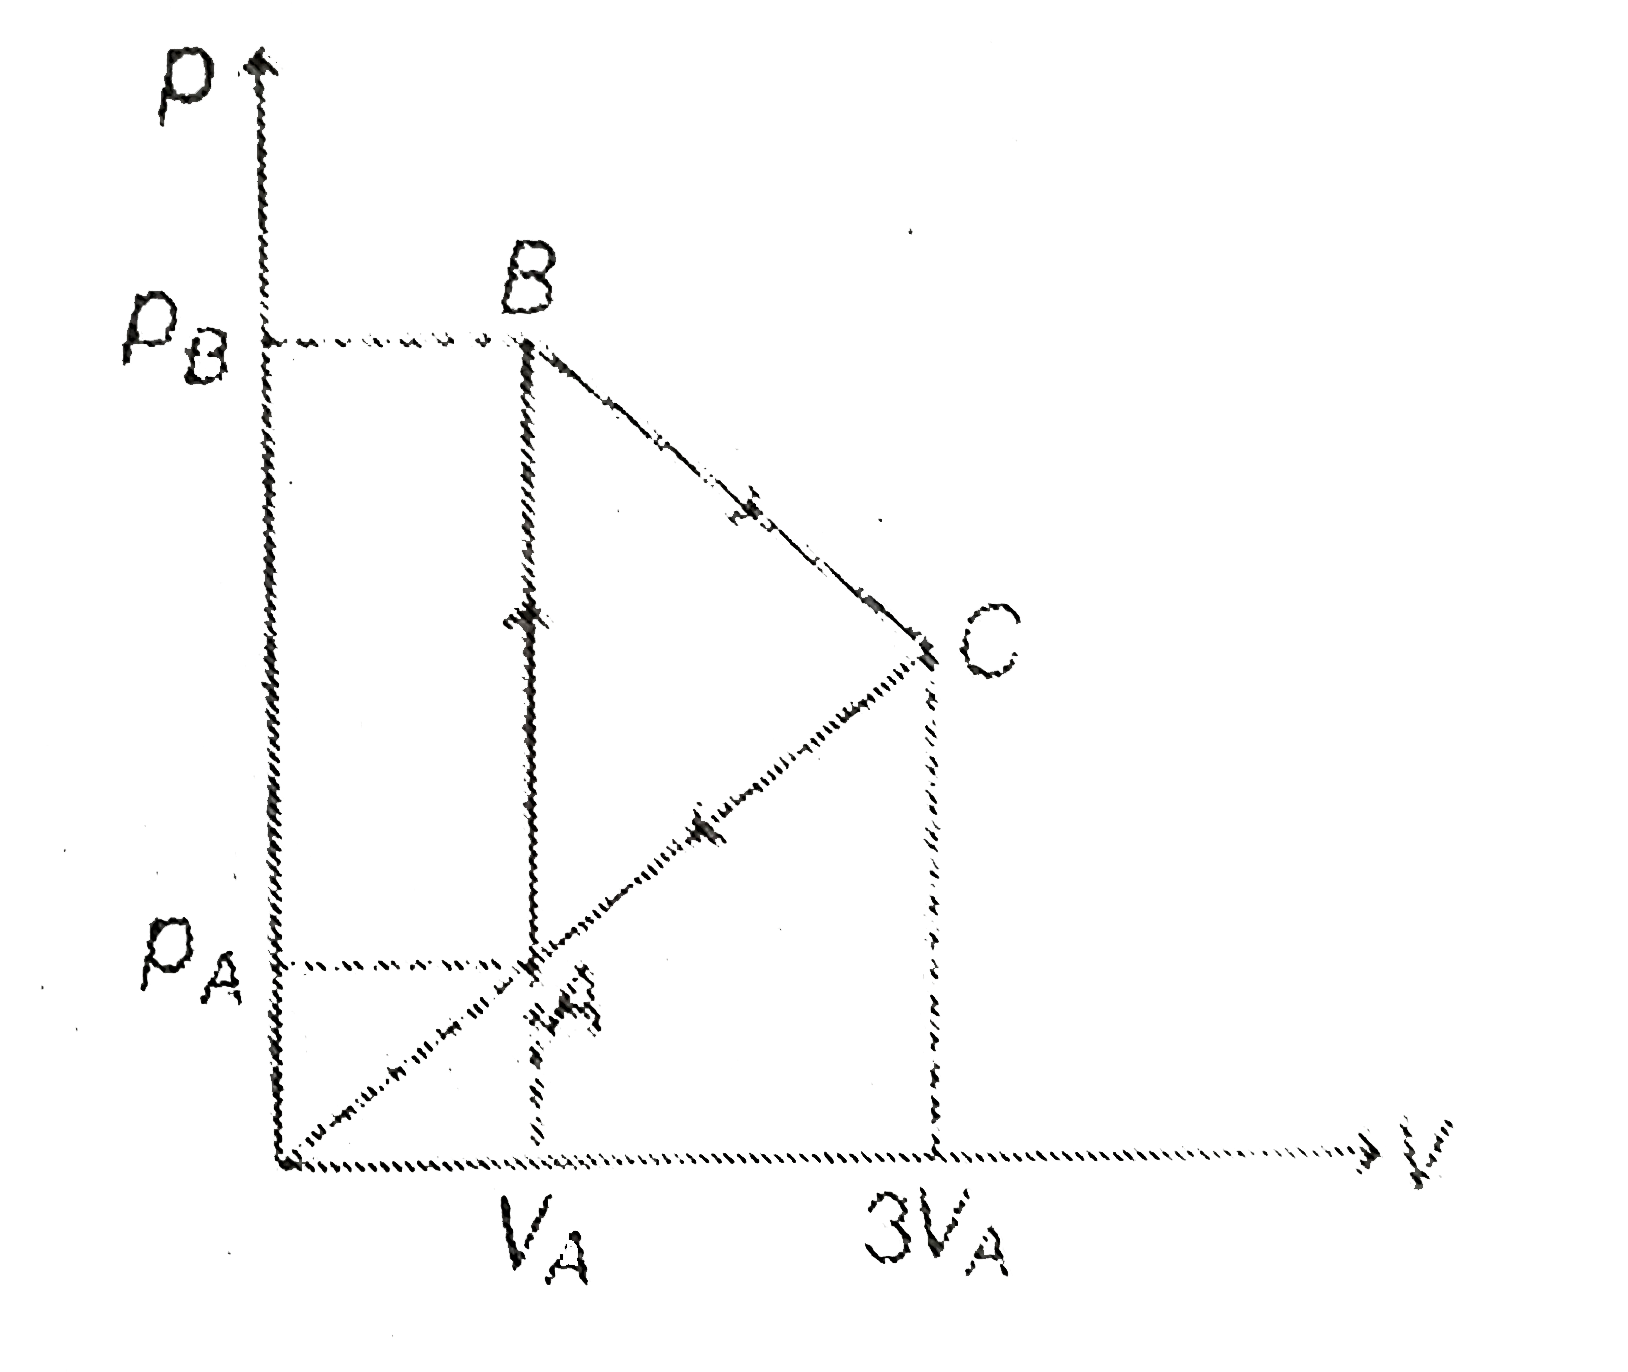
Net work done by the gas in the process isA2pAVAB4pAVAC6pAVAD8pAVA
An ideal gas is taken through the process ABC as shown in figure. If the internal energy of the substance decreases by 10000J and a heat of 7159 cal is released by the system, calculate the value of meachanical equivalent of heat (J).
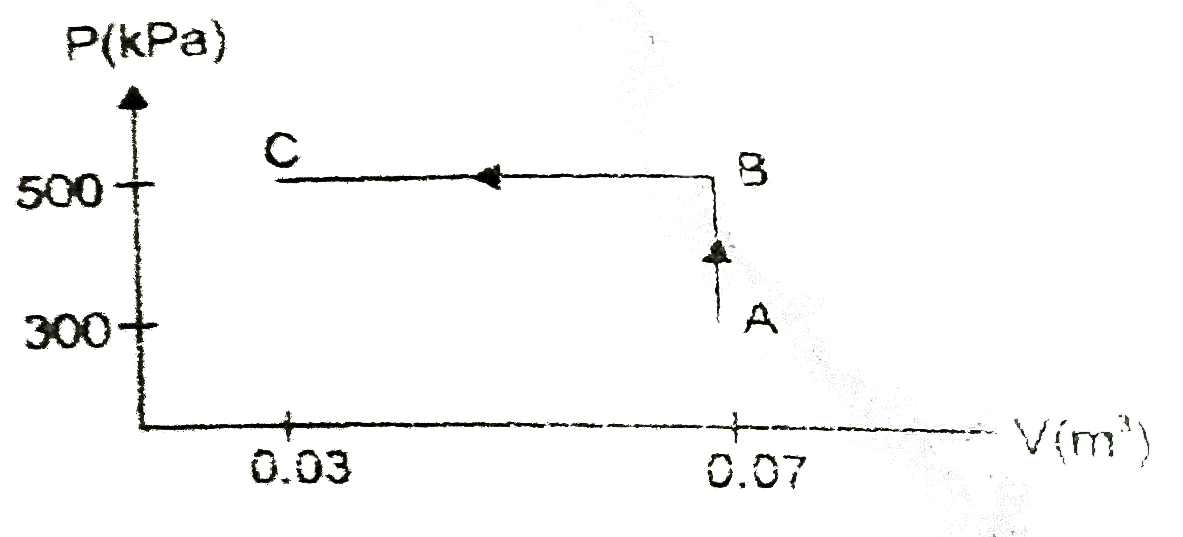
View SolutionOne mole of an ideal diatomic gas is taken through the cycle as shown in the figure.
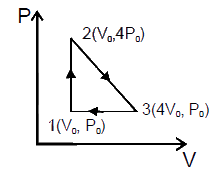
1→2: isochoric process
2→3 : straight line on P - V diagram
3→1: isobaric process
The average of molecular speed of the gas in the states 1, 2 and 3 are in the ratio
View SolutionA sample of ideal gas is taken through the cyclic process shown in the figure. The temerauture of the gas in state A is TA =200 K. In states B and C the temperature of the gas is the same.

What is the greastes temperature of the gas during the cyclic process ?
View SolutionA sample of ideal gas is taken through the cyclic process shown in the figure. The temerauture of the gas in state A is TA =200 K. In states B and C the temperature of the gas is the same.
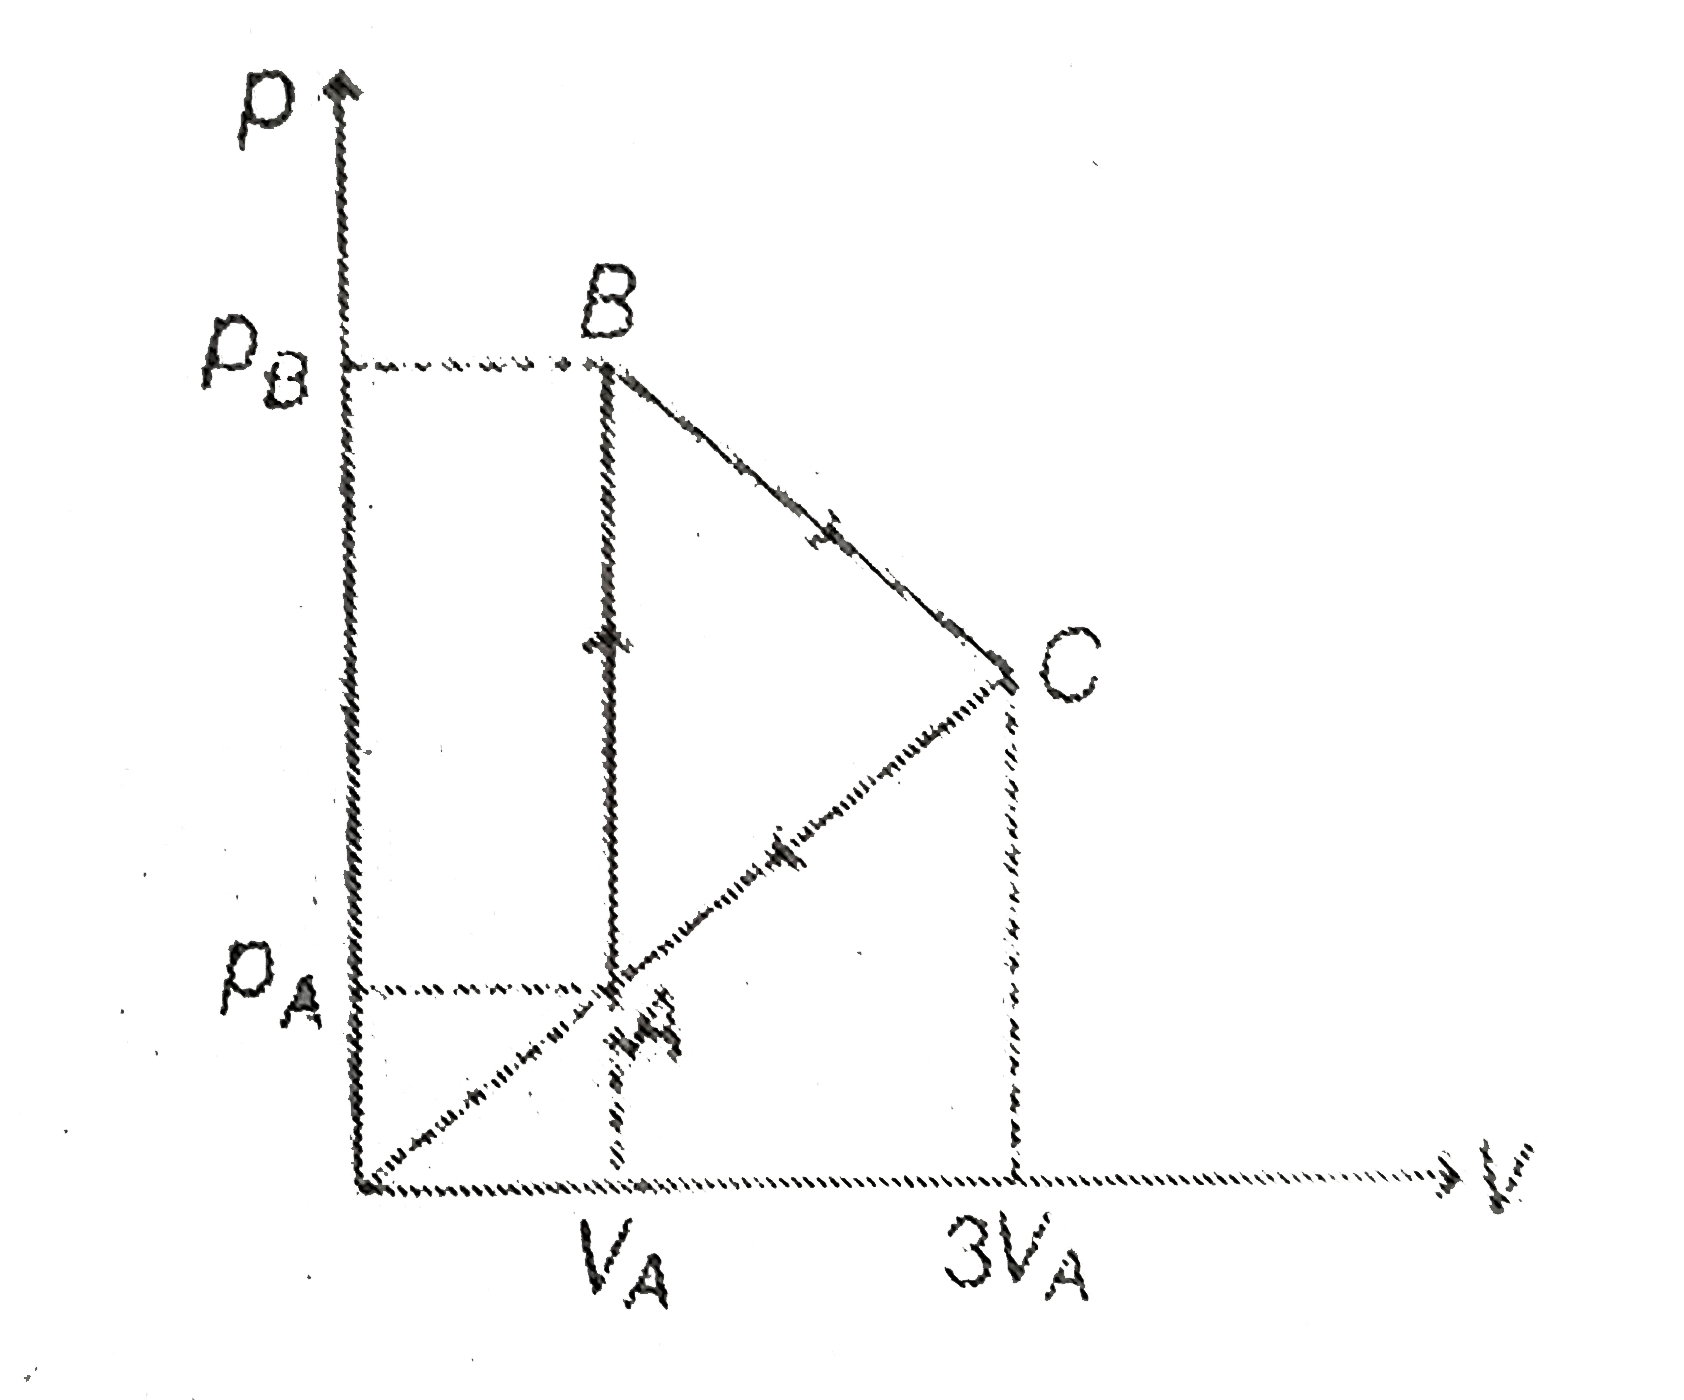
Which of the following graphs best reprsent the cyclic process in T-V diagram
View SolutionAn enclosed ideal gas is taken through a cycle as shown in the figure. Then

View Solution

