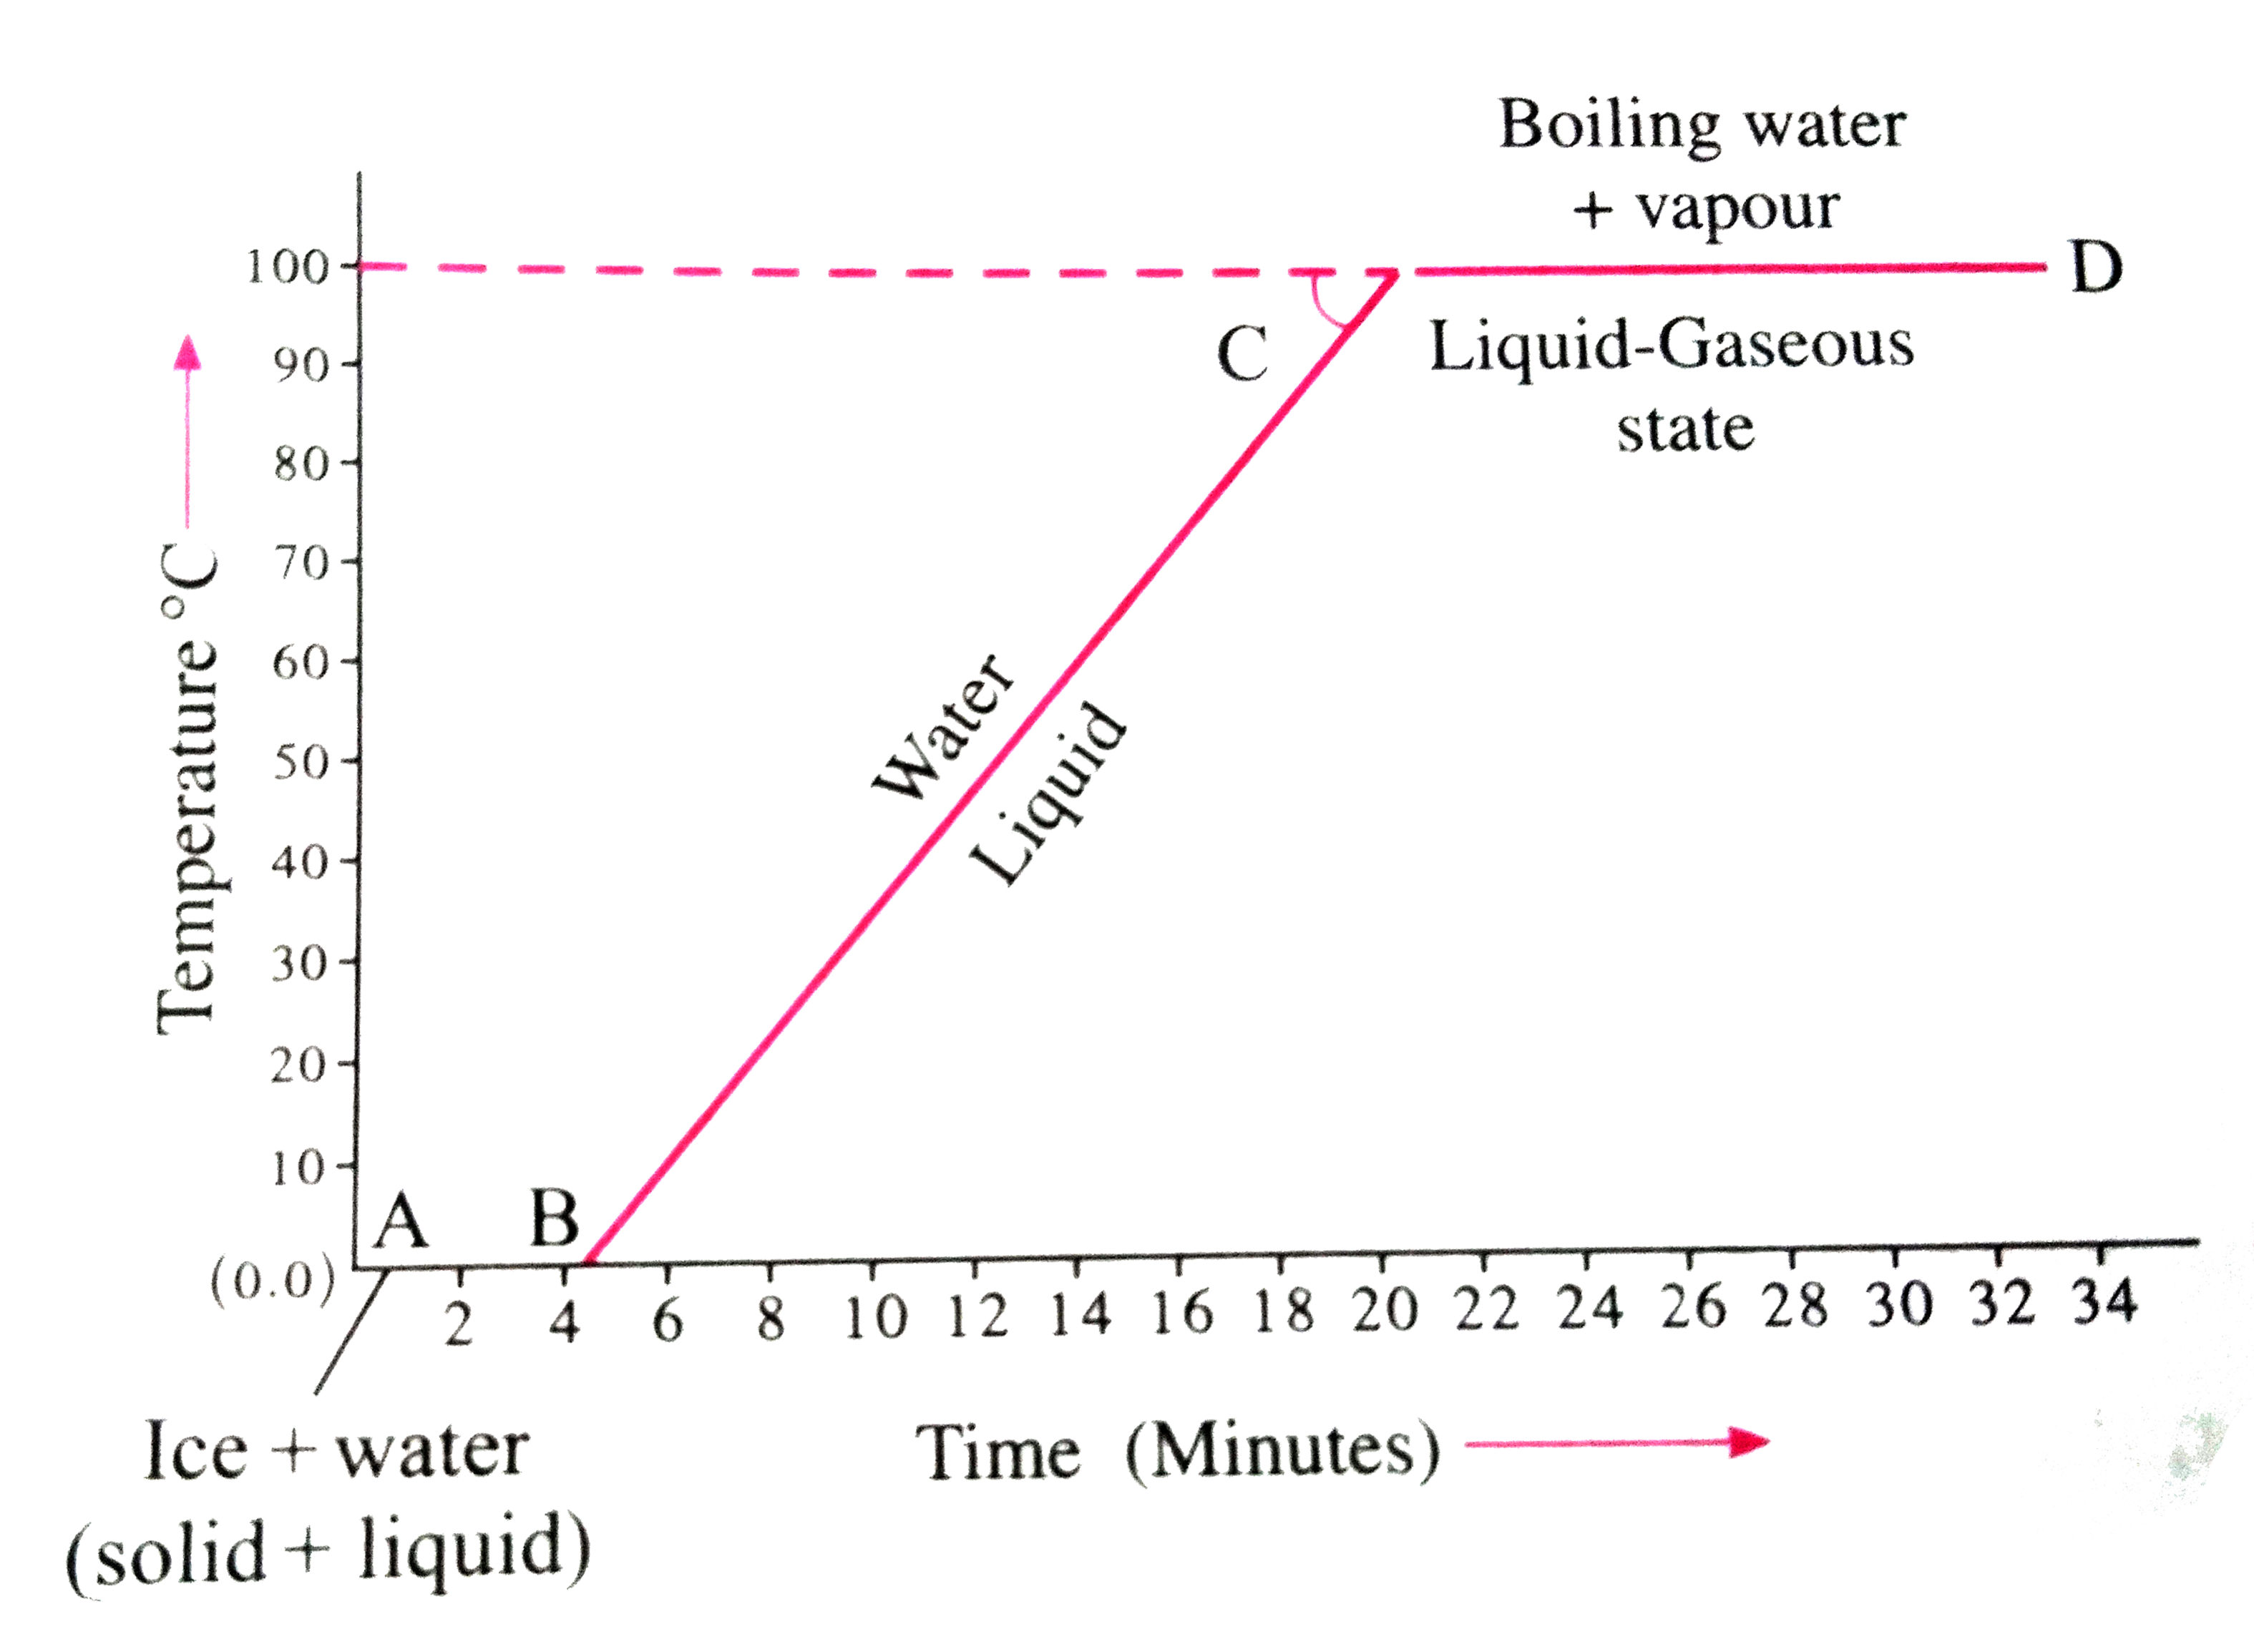
What could be explained from the straight horizontal line observed at the beginning and end of the temperature v/s time graph of water when heated continuously and uniformly?
Step by step video & image solution for What could be explained from the straight horizontal line observed at the beginning and end of the temperature v/s time graph of water when heated continuously and uniformly? by Physics experts to help you in doubts & scoring excellent marks in Class 10 exams.
Updated on:21/07/2023Topper's Solved these Questions
- HEATBook:TARGET PUBLICATIONChapter:HEATExercise:Given reasons
Explore 8 Videos
- HEATBook:TARGET PUBLICATIONChapter:HEATExercise:Complete the given chart
Explore 2 Videos
- HEATBook:TARGET PUBLICATIONChapter:HEATExercise:Match the following
Explore 6 Videos
- GRAVITATIONBook:TARGET PUBLICATIONChapter:GRAVITATIONExercise:ASSESSMENT
Explore 19 Videos
- LENSES Book:TARGET PUBLICATIONChapter:LENSES Exercise:Chapter Assessment
Explore 21 Videos
Similar Questions
How could latent heat be explained from temperature vis time graph of water when heated continuously and uniformly? Explain in detail.
View Solution(1) Take a few pieces of ice in a glass beaker as shown in figure.
(2) Insert the bulb of a thermometer in ice and measure its temperature.
(3) Put the beaker on a stand and heat the ice using a burner.
(4) Record the temperature using the thermometer after every minute.
(5) As the ice is heated,it starts melting. Stir the mixture of ice and water.
(6) Continue the heating even after ice starts melting.
(7) Draw a graph of temperature versus time.
Explain the role of latent heat in the change of state of a substance.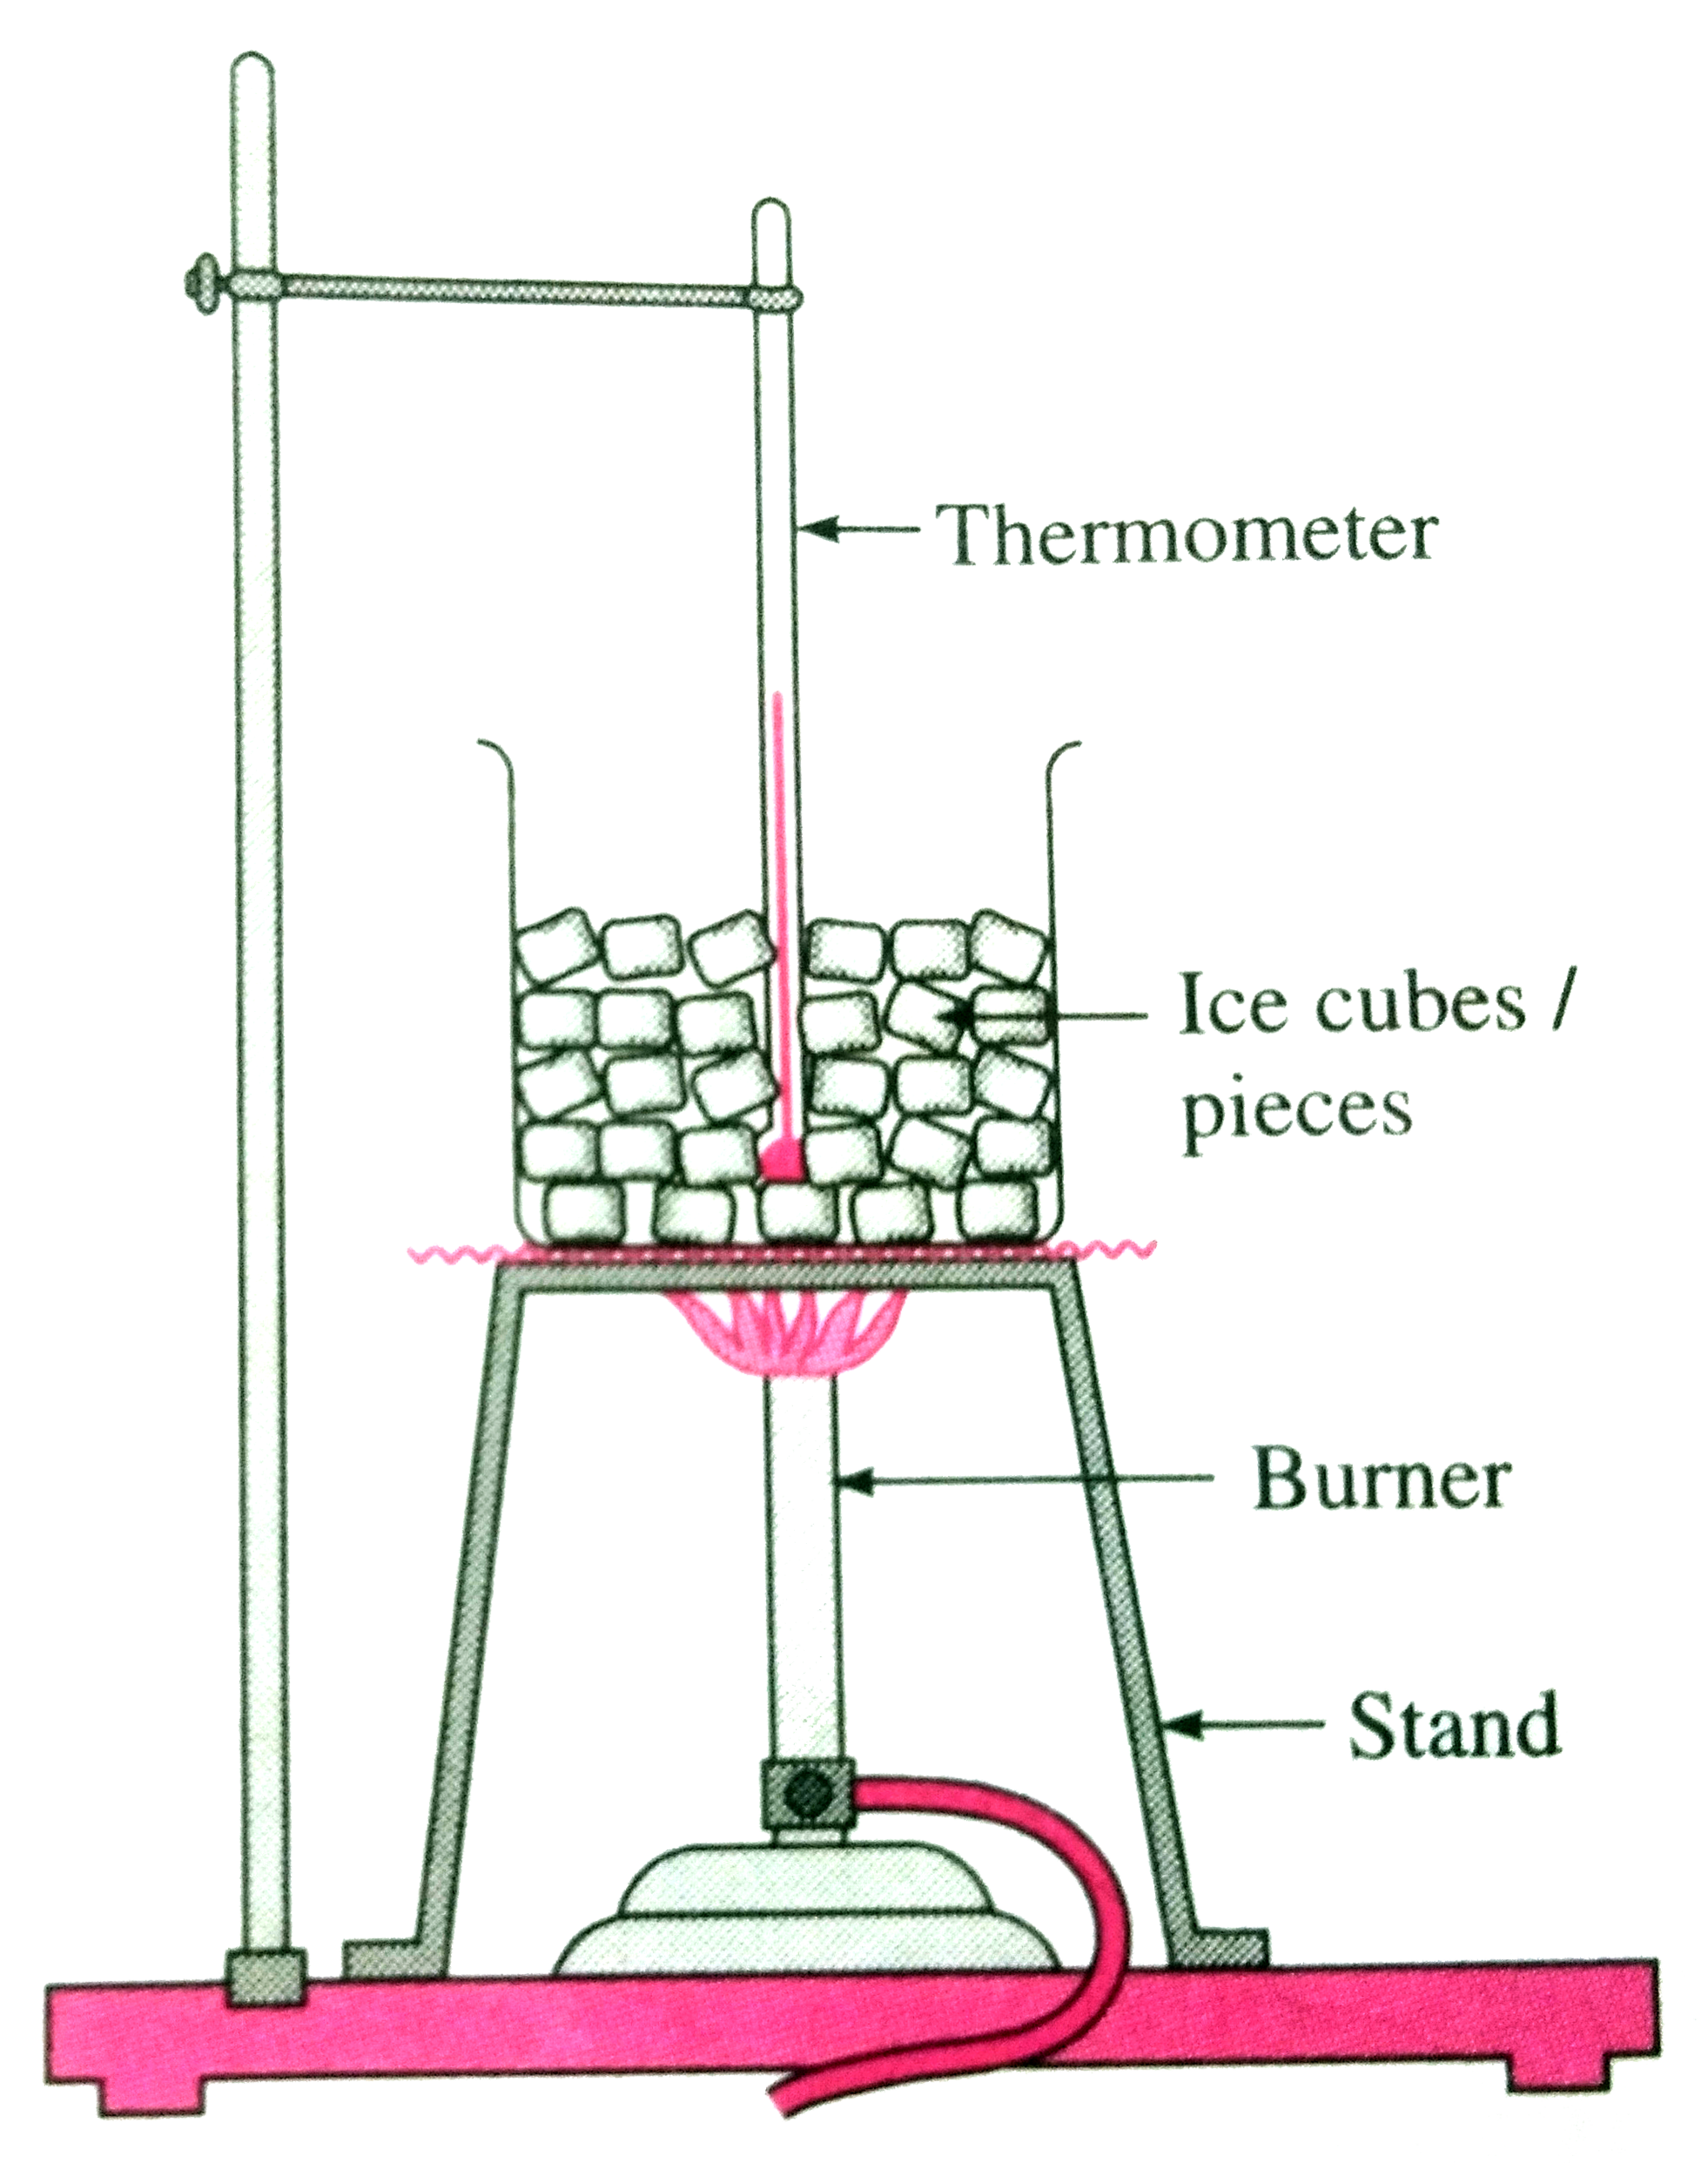
View Solution
Knowledge Check
A rod of unifrom cross section is heated at temperature t0 at a point which is at n1 times if its length (n1<1) from its one end in stready state The temperature at this end is t1 and at other end is t2 Rate of vapourisation of water at either end of the rod is same. The end at which temperature is t2 is how much more far away that the other end from the point at which the rod is heated .
An1(t0−t2)t0−t1Bn1(t0−t2)t0−t1C2n1t0t0−t2D2n1(t1−t2)t0−t1The angle of elevation of a certain peak when observed from each end of a horizontal base line of length 2a is found to be θ. When observed from the mid-point of the base the angle of elevation is ϕ. The height of the peak is
Aa√(cosθ−cosΨ)Ba√(cot2θ−cot2Ψ)Ca√(cos2θ−cos2Ψ)DNoneA body is moved from rest along a straight line by a machine delivering constant power. The ratio of displacement and velocity (s/v) varies with time t as
A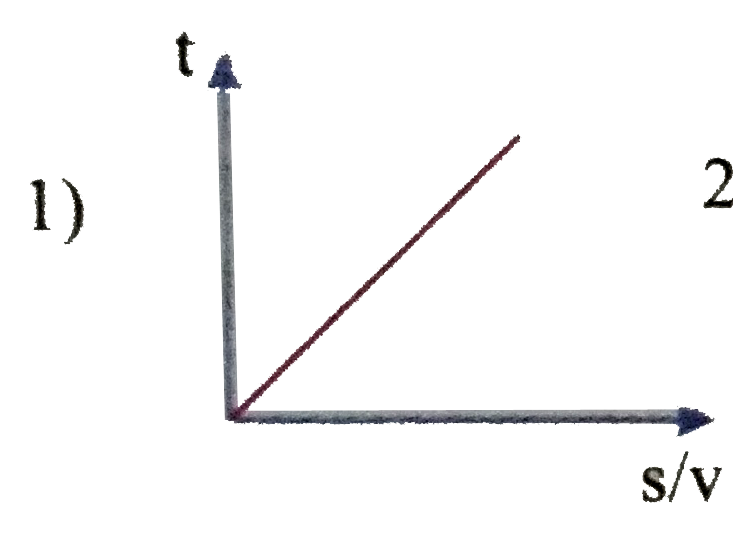 B
B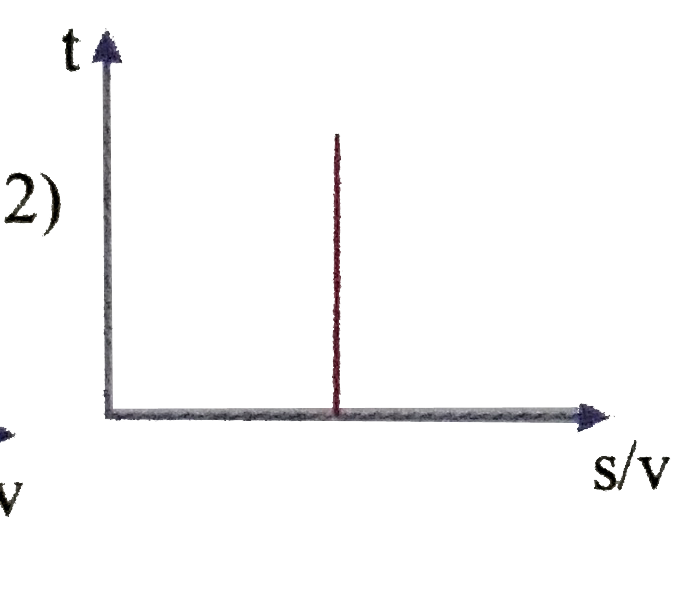 C
C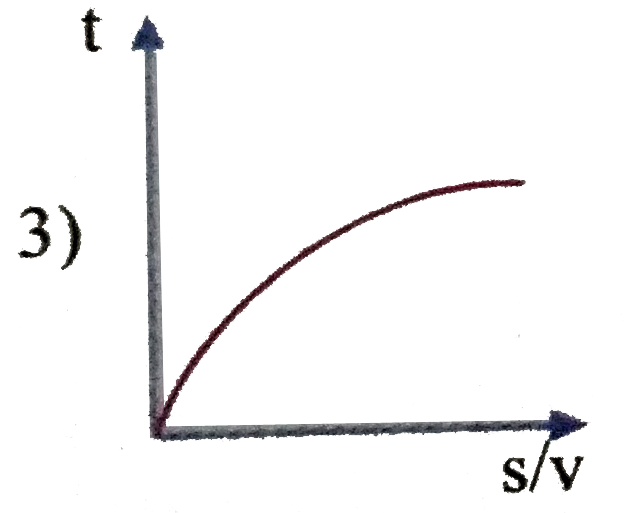 D
D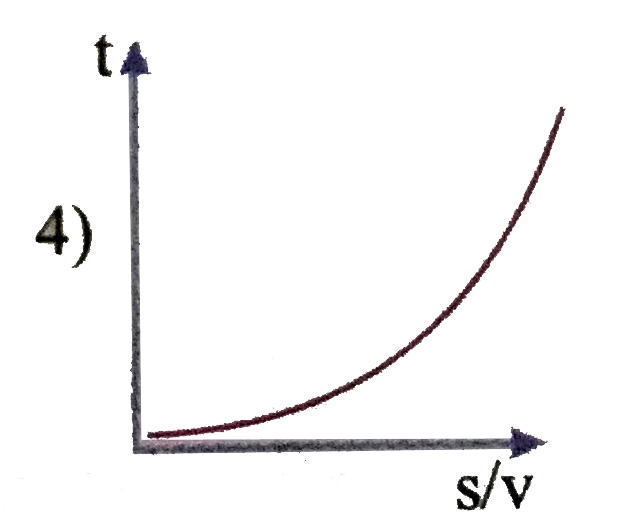
A body moves along a straight line. In every t-s the speed of the body decreases uniformly to half of the original speed. Draw the speed-time graph of the body.
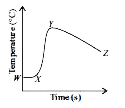
View SolutionExcess of sodium hydroxide pellets are added to dilute hydrochloric acid and the temperature change of the mixture was measured over a period of time. The given graph shows the temperature change Time (s) with time.
What can be inferred from the graph?
View Solution(1) Take a few pieces of ice in a glass beaker as shown in figure.
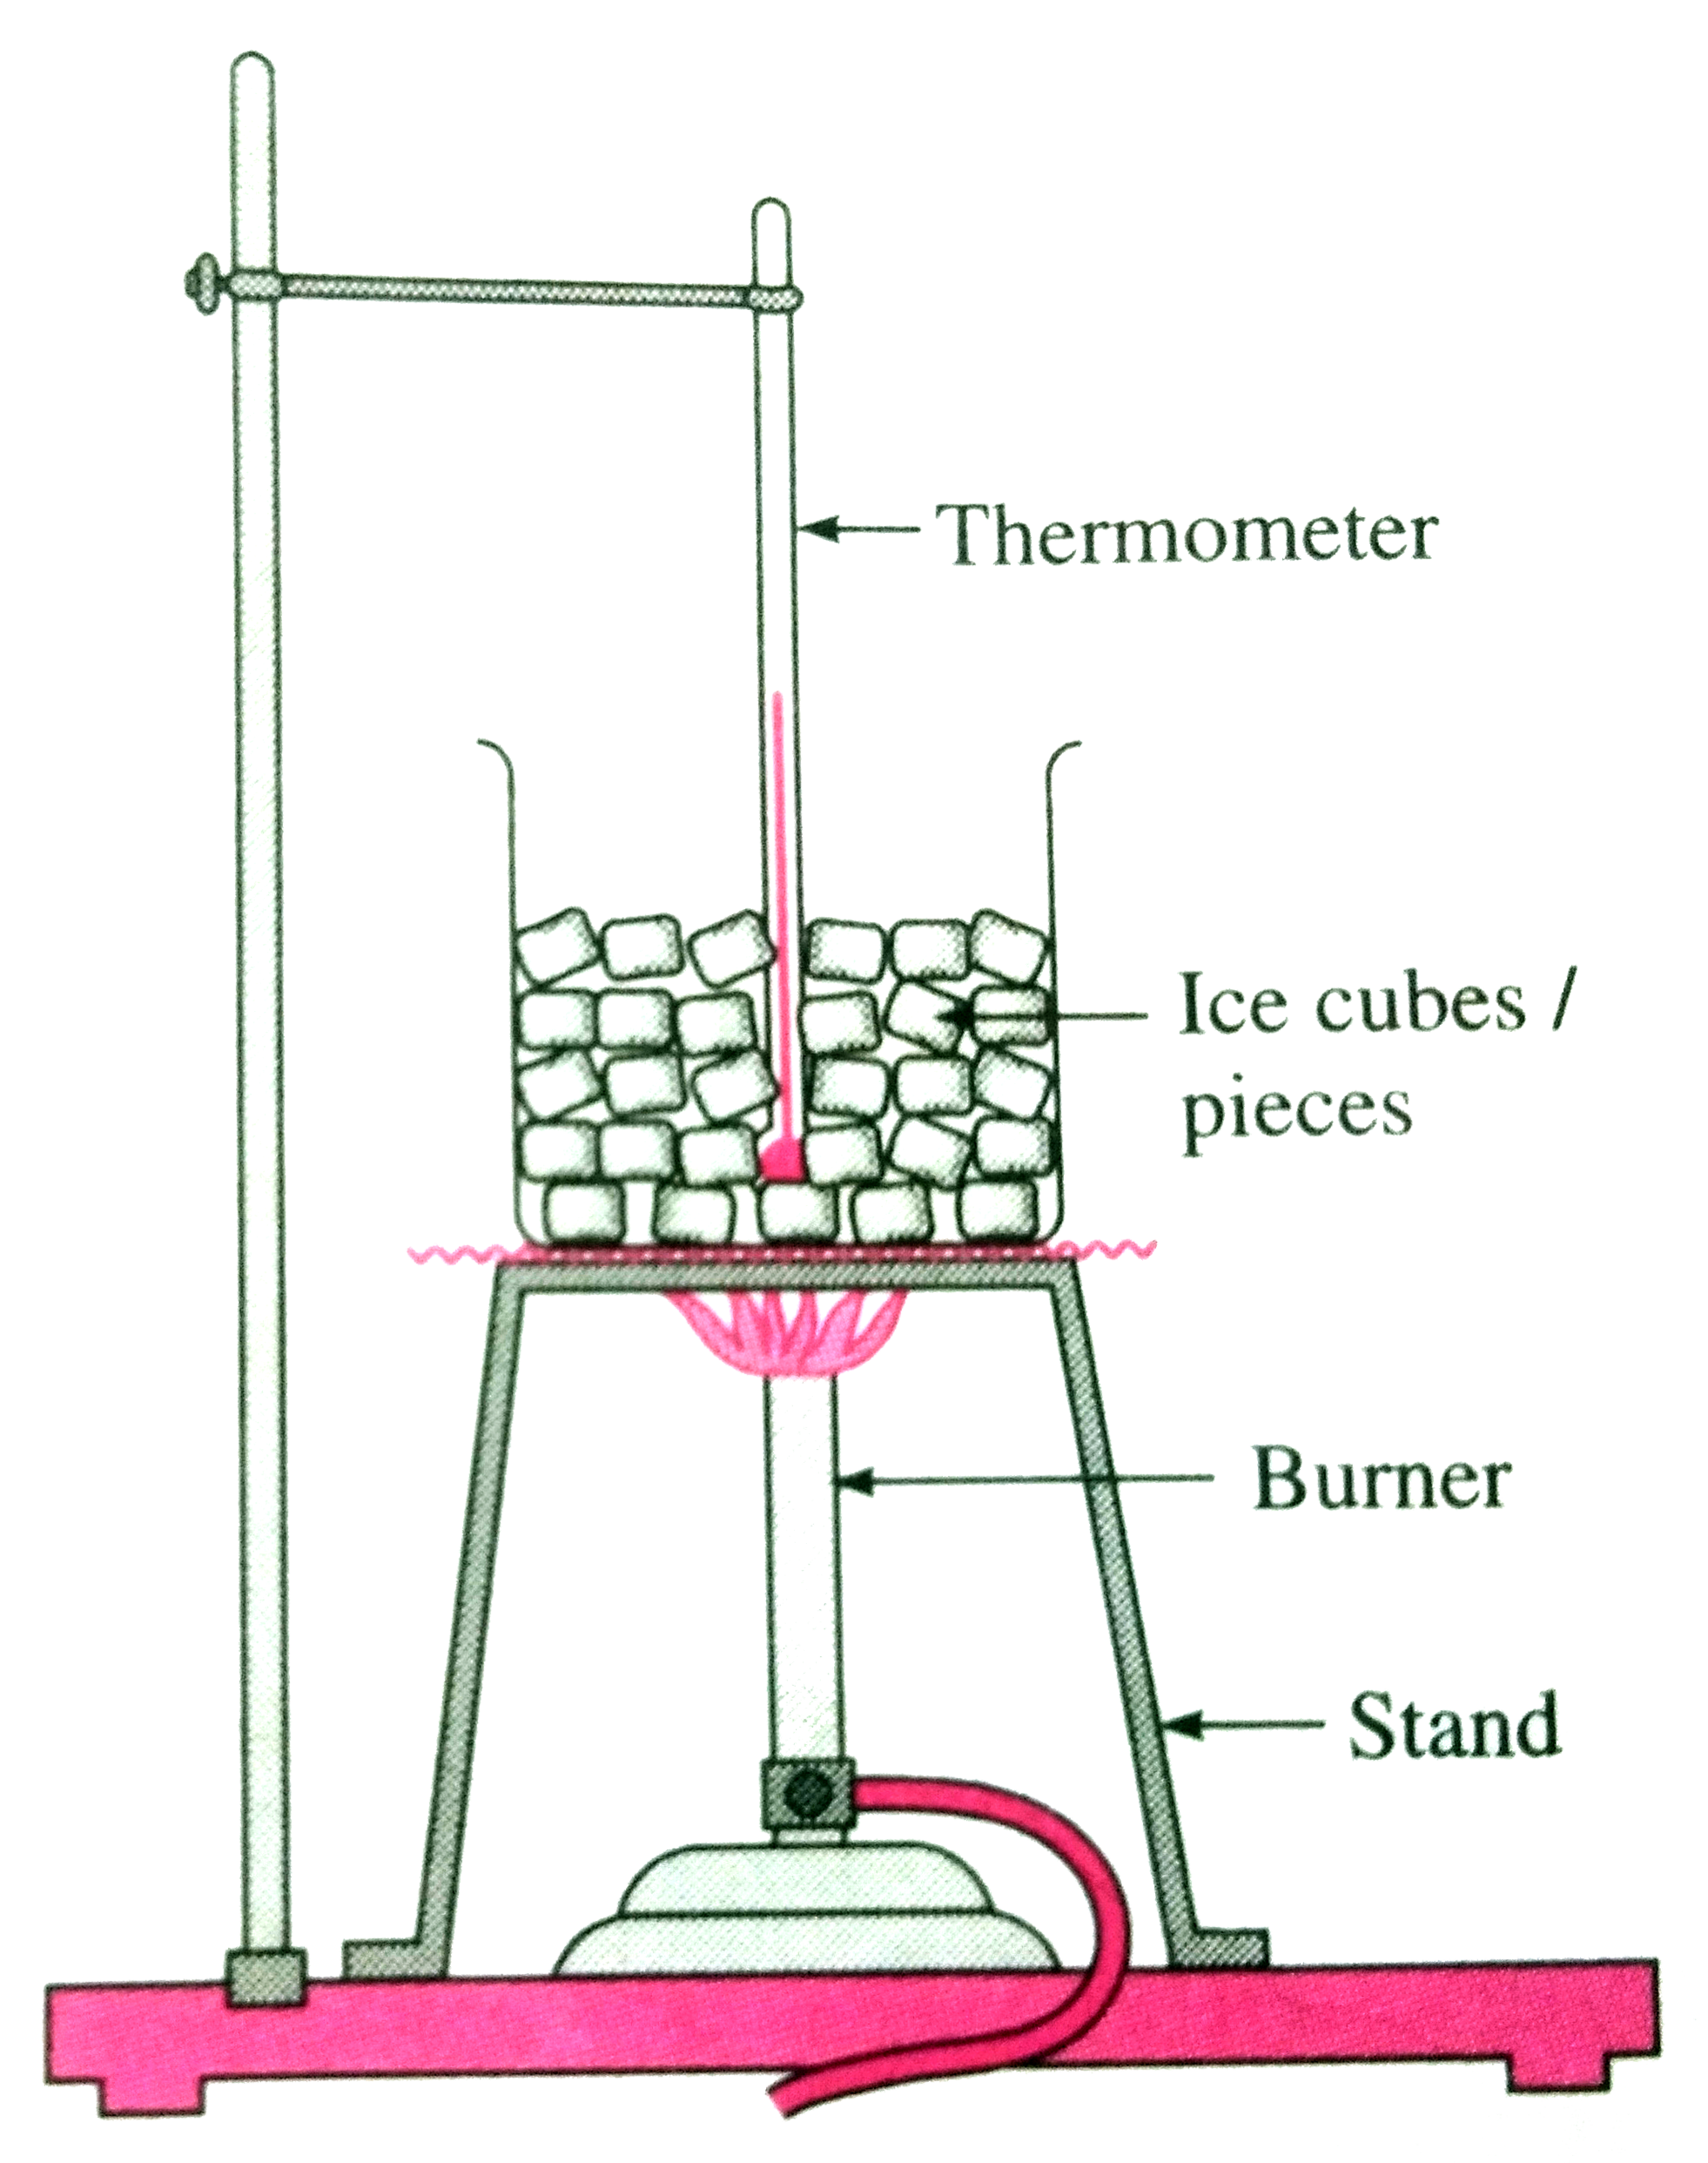
(2) Insert the bulb of a thermometer in ice and measure its temperature.
(3) Put the beaker on a stand and heat the ice using a burner.
(4) Record the temperature using the thermometer after every minute.
(5) As the ice is heated,it starts melting. Stir the mixture of ice and water.
(6) Continue the heating even after ice starts melting.
(7) Draw a graph of temperature versus time.
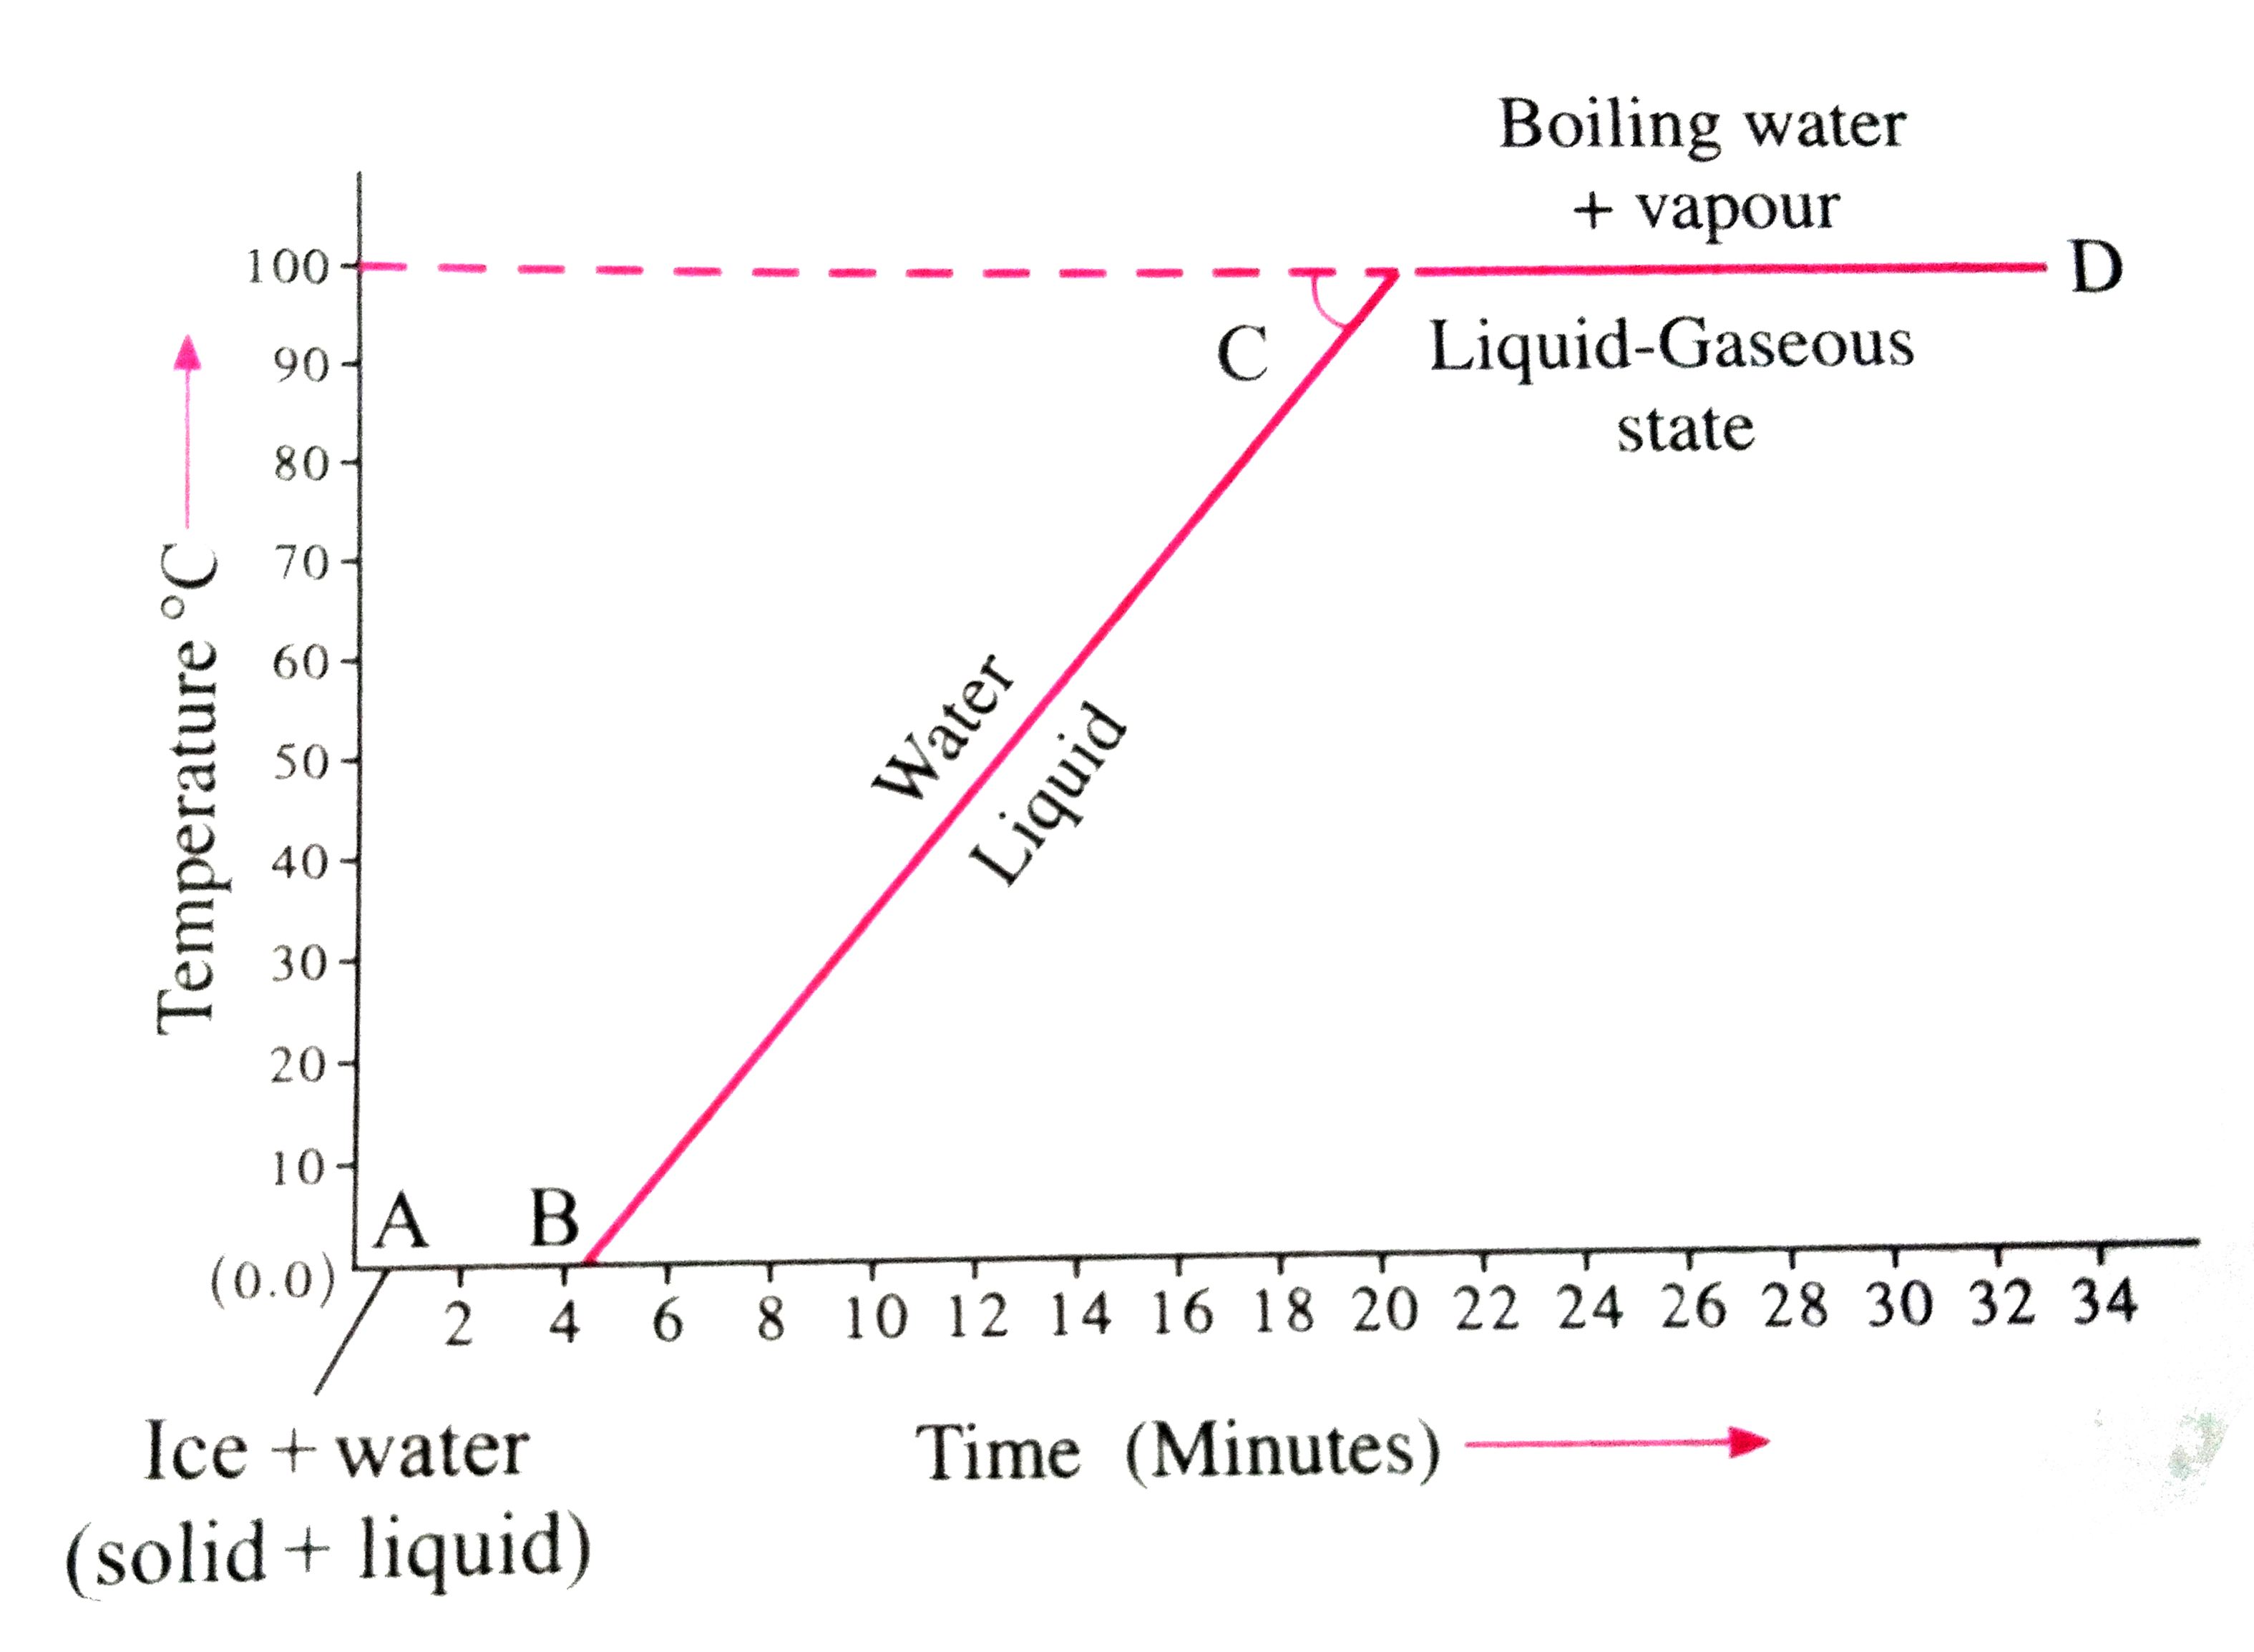
Explain the term latent heat of vaporization.
View Solution
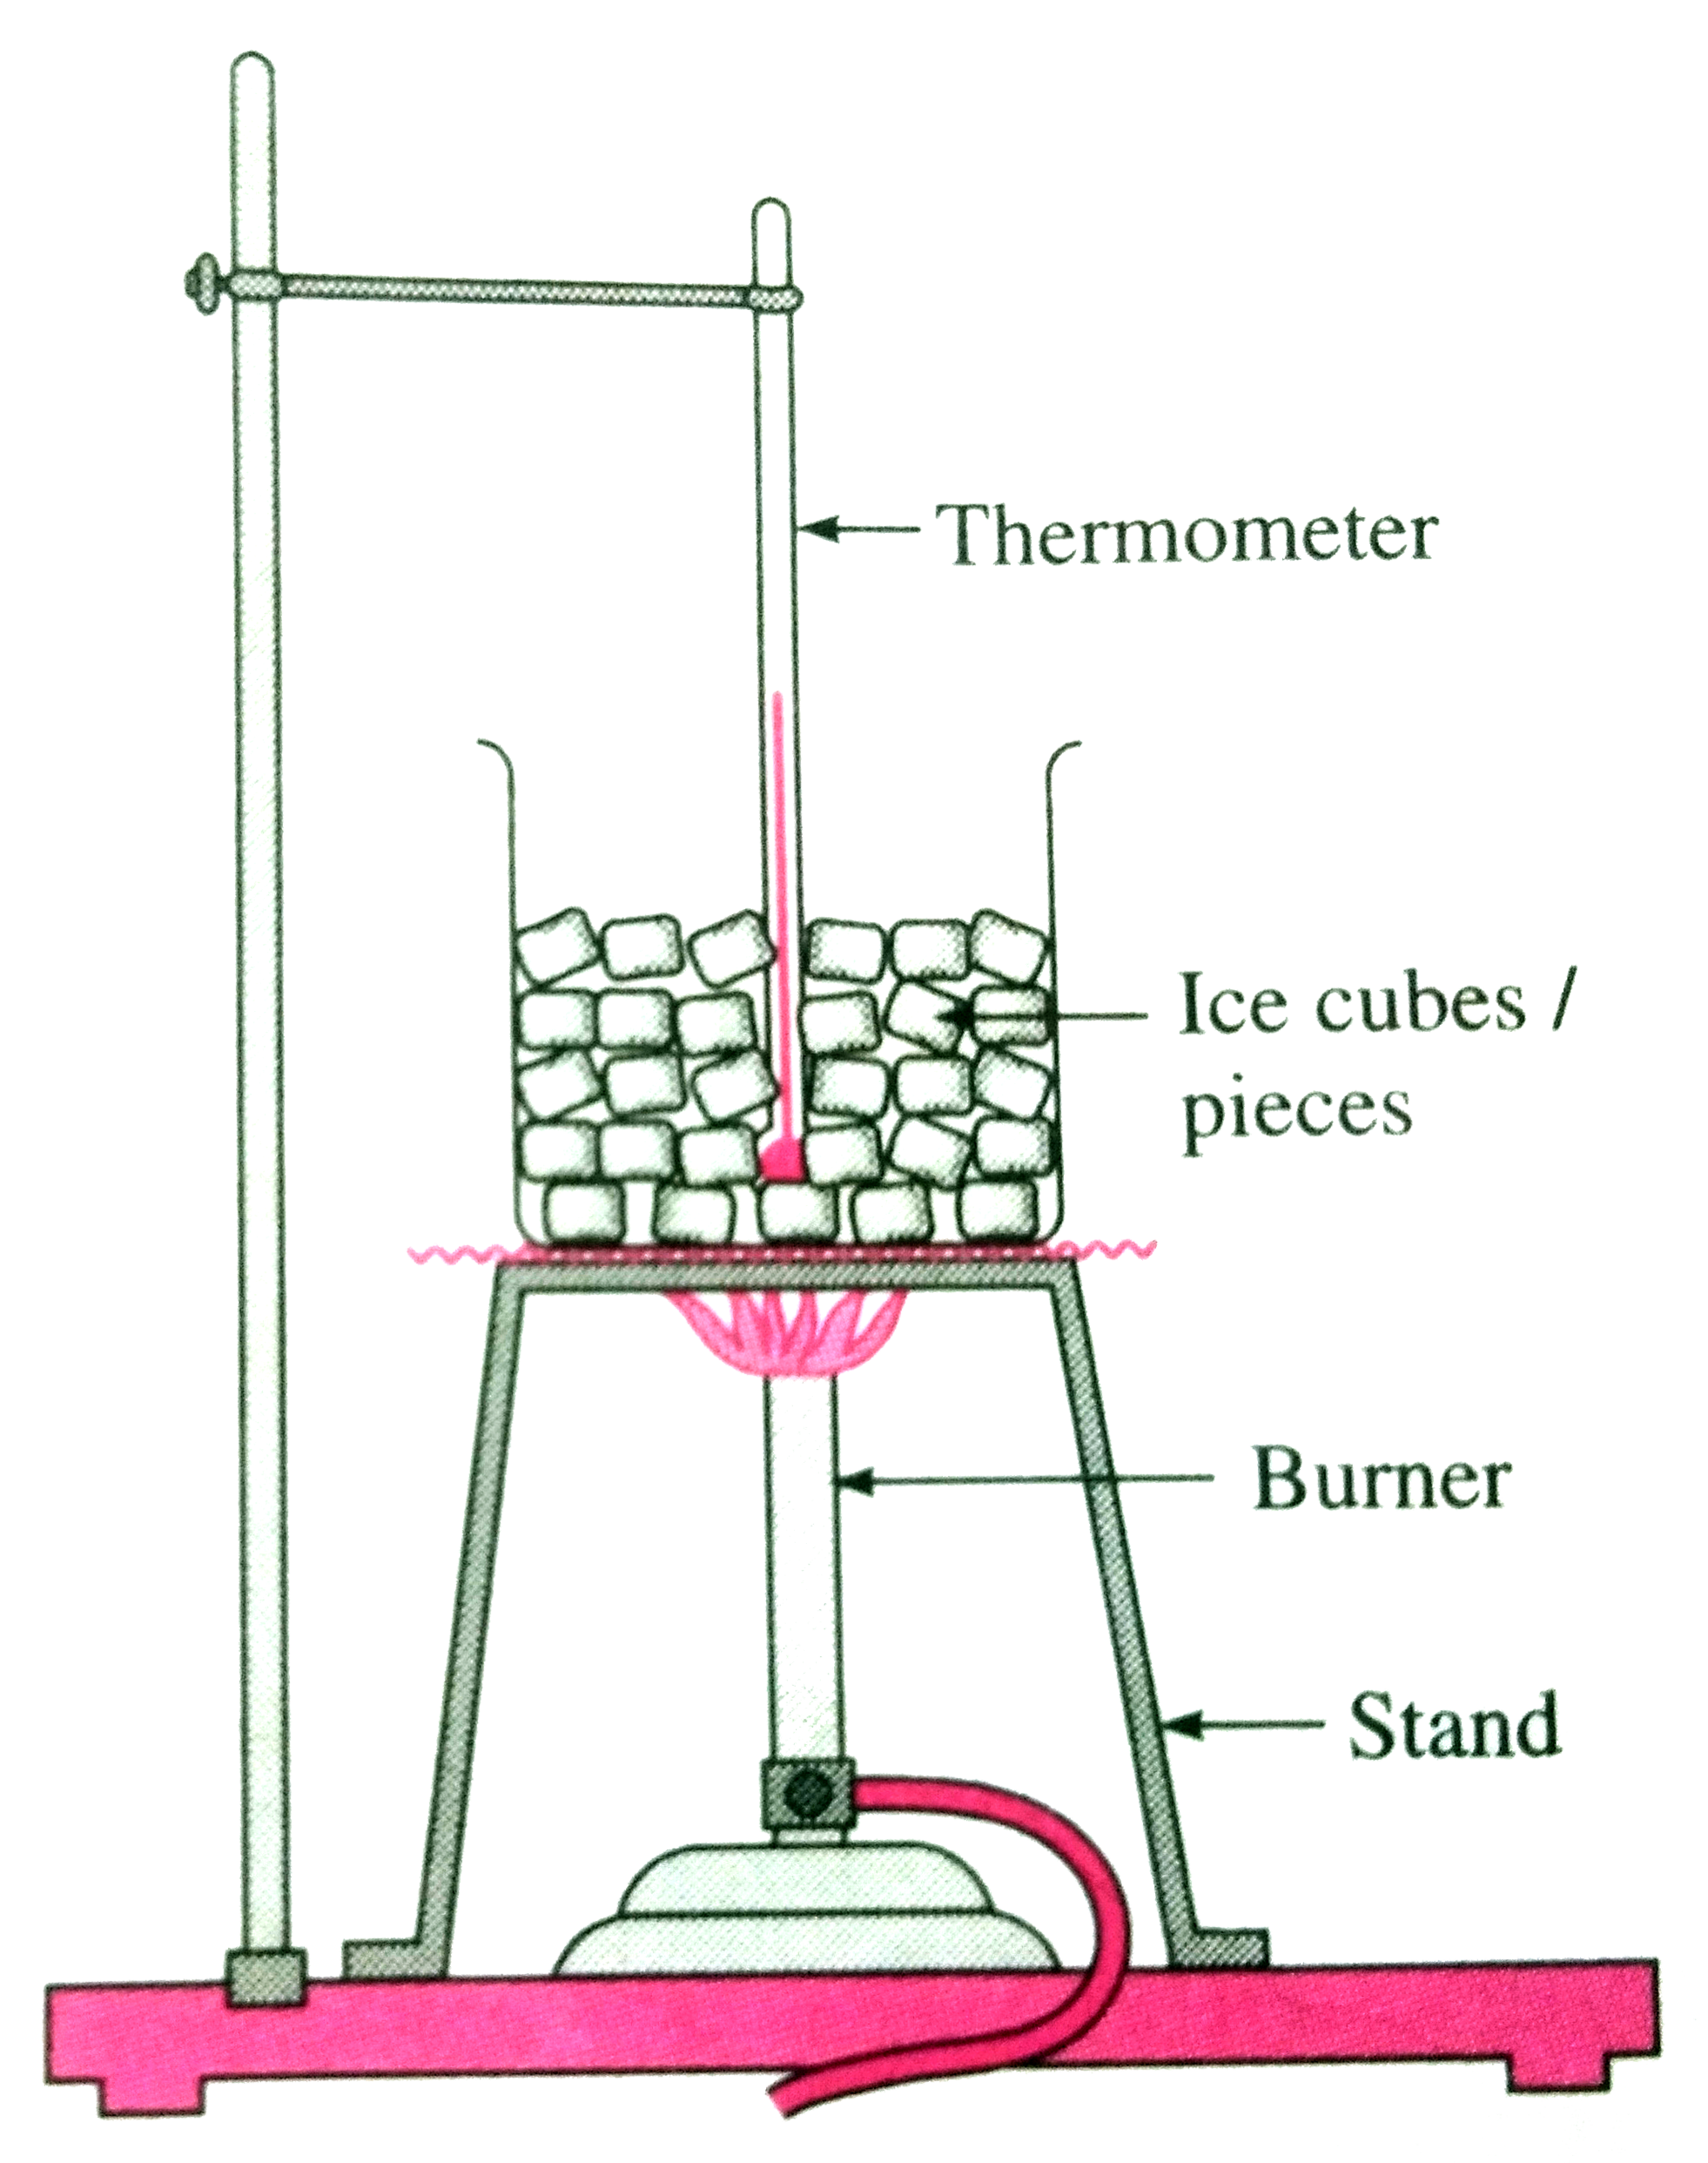
(1) Take a few pieces of ice in a glass beaker as shown in figure.
(2) Insert the bulb of a thermometer in ice and measure its temperature.
(3) Put the beaker on a stand and heat the ice usinga burner.
(4) Record the temperature using the thermometer after every minute.
(5) As the ice is heated,it starts melting. Stir the mixture of ice and water.
(6) Continue the heating even after ice starts melting.
(7) Draw a graph of temperature versus time.
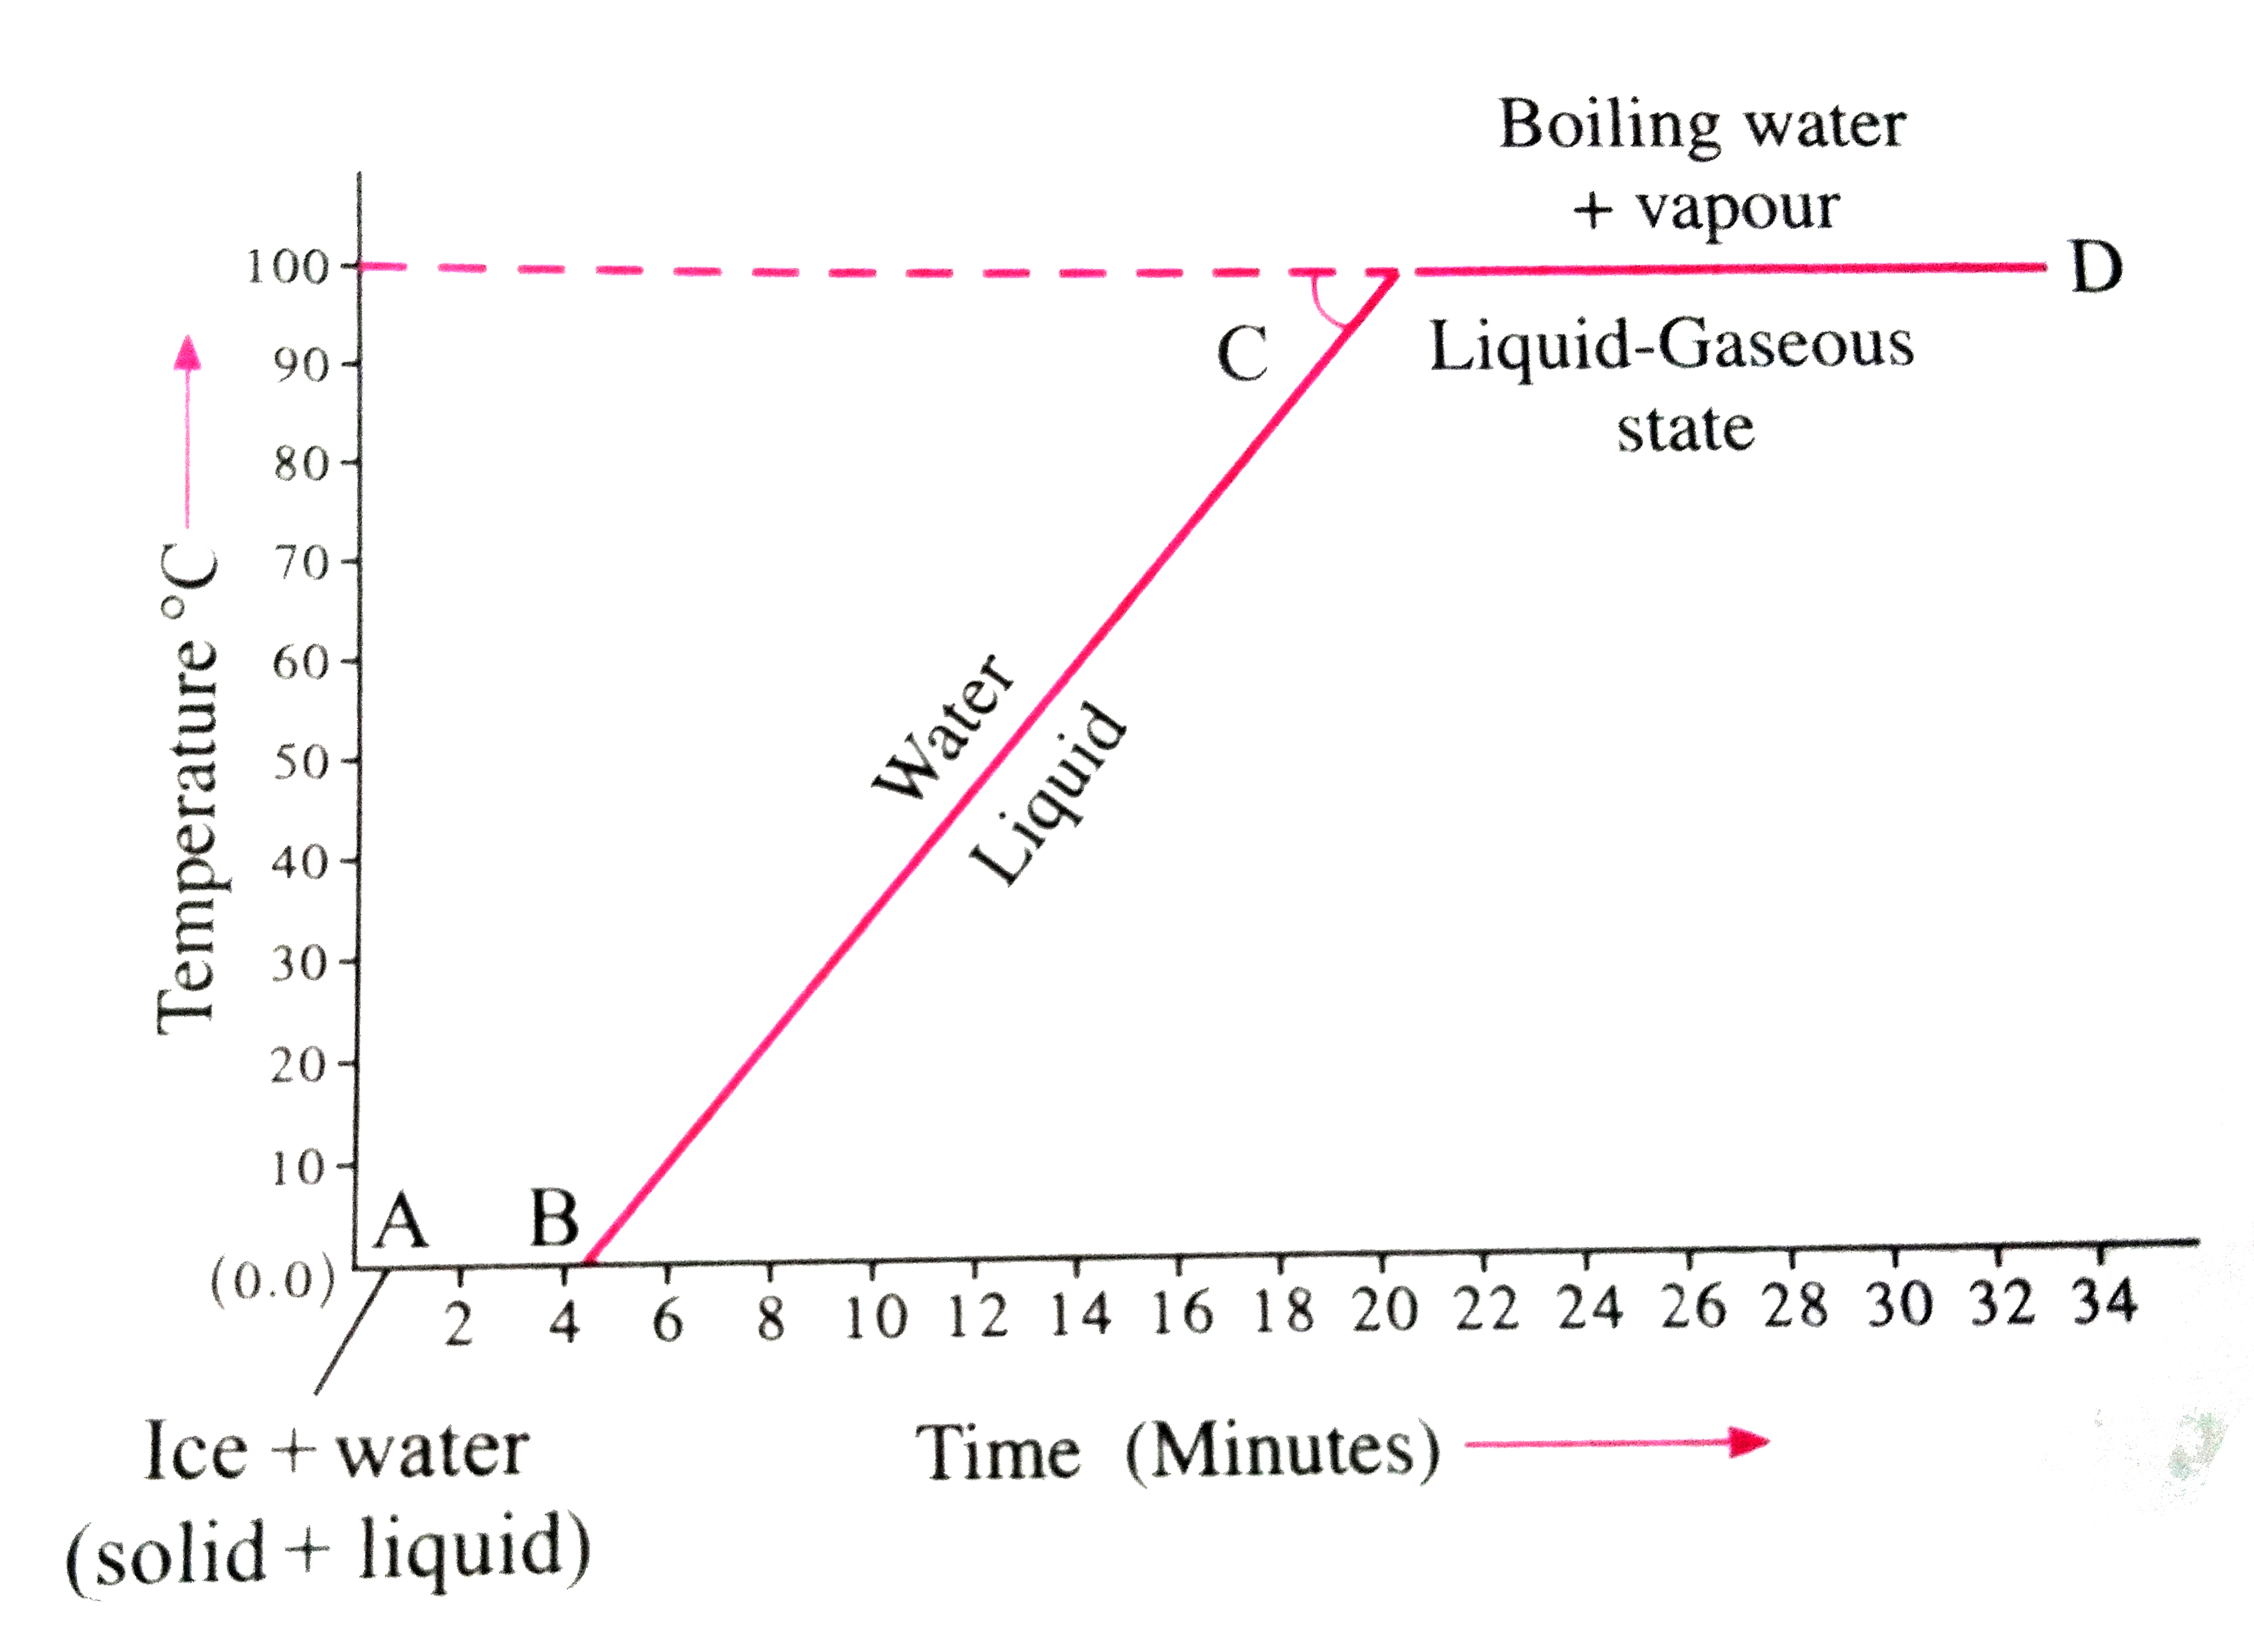
Explain the following temperature vs time graph.
View SolutionWhat is the nature of graph of PV versus P for a given mass of a gas at constant temperature?
View Solution

