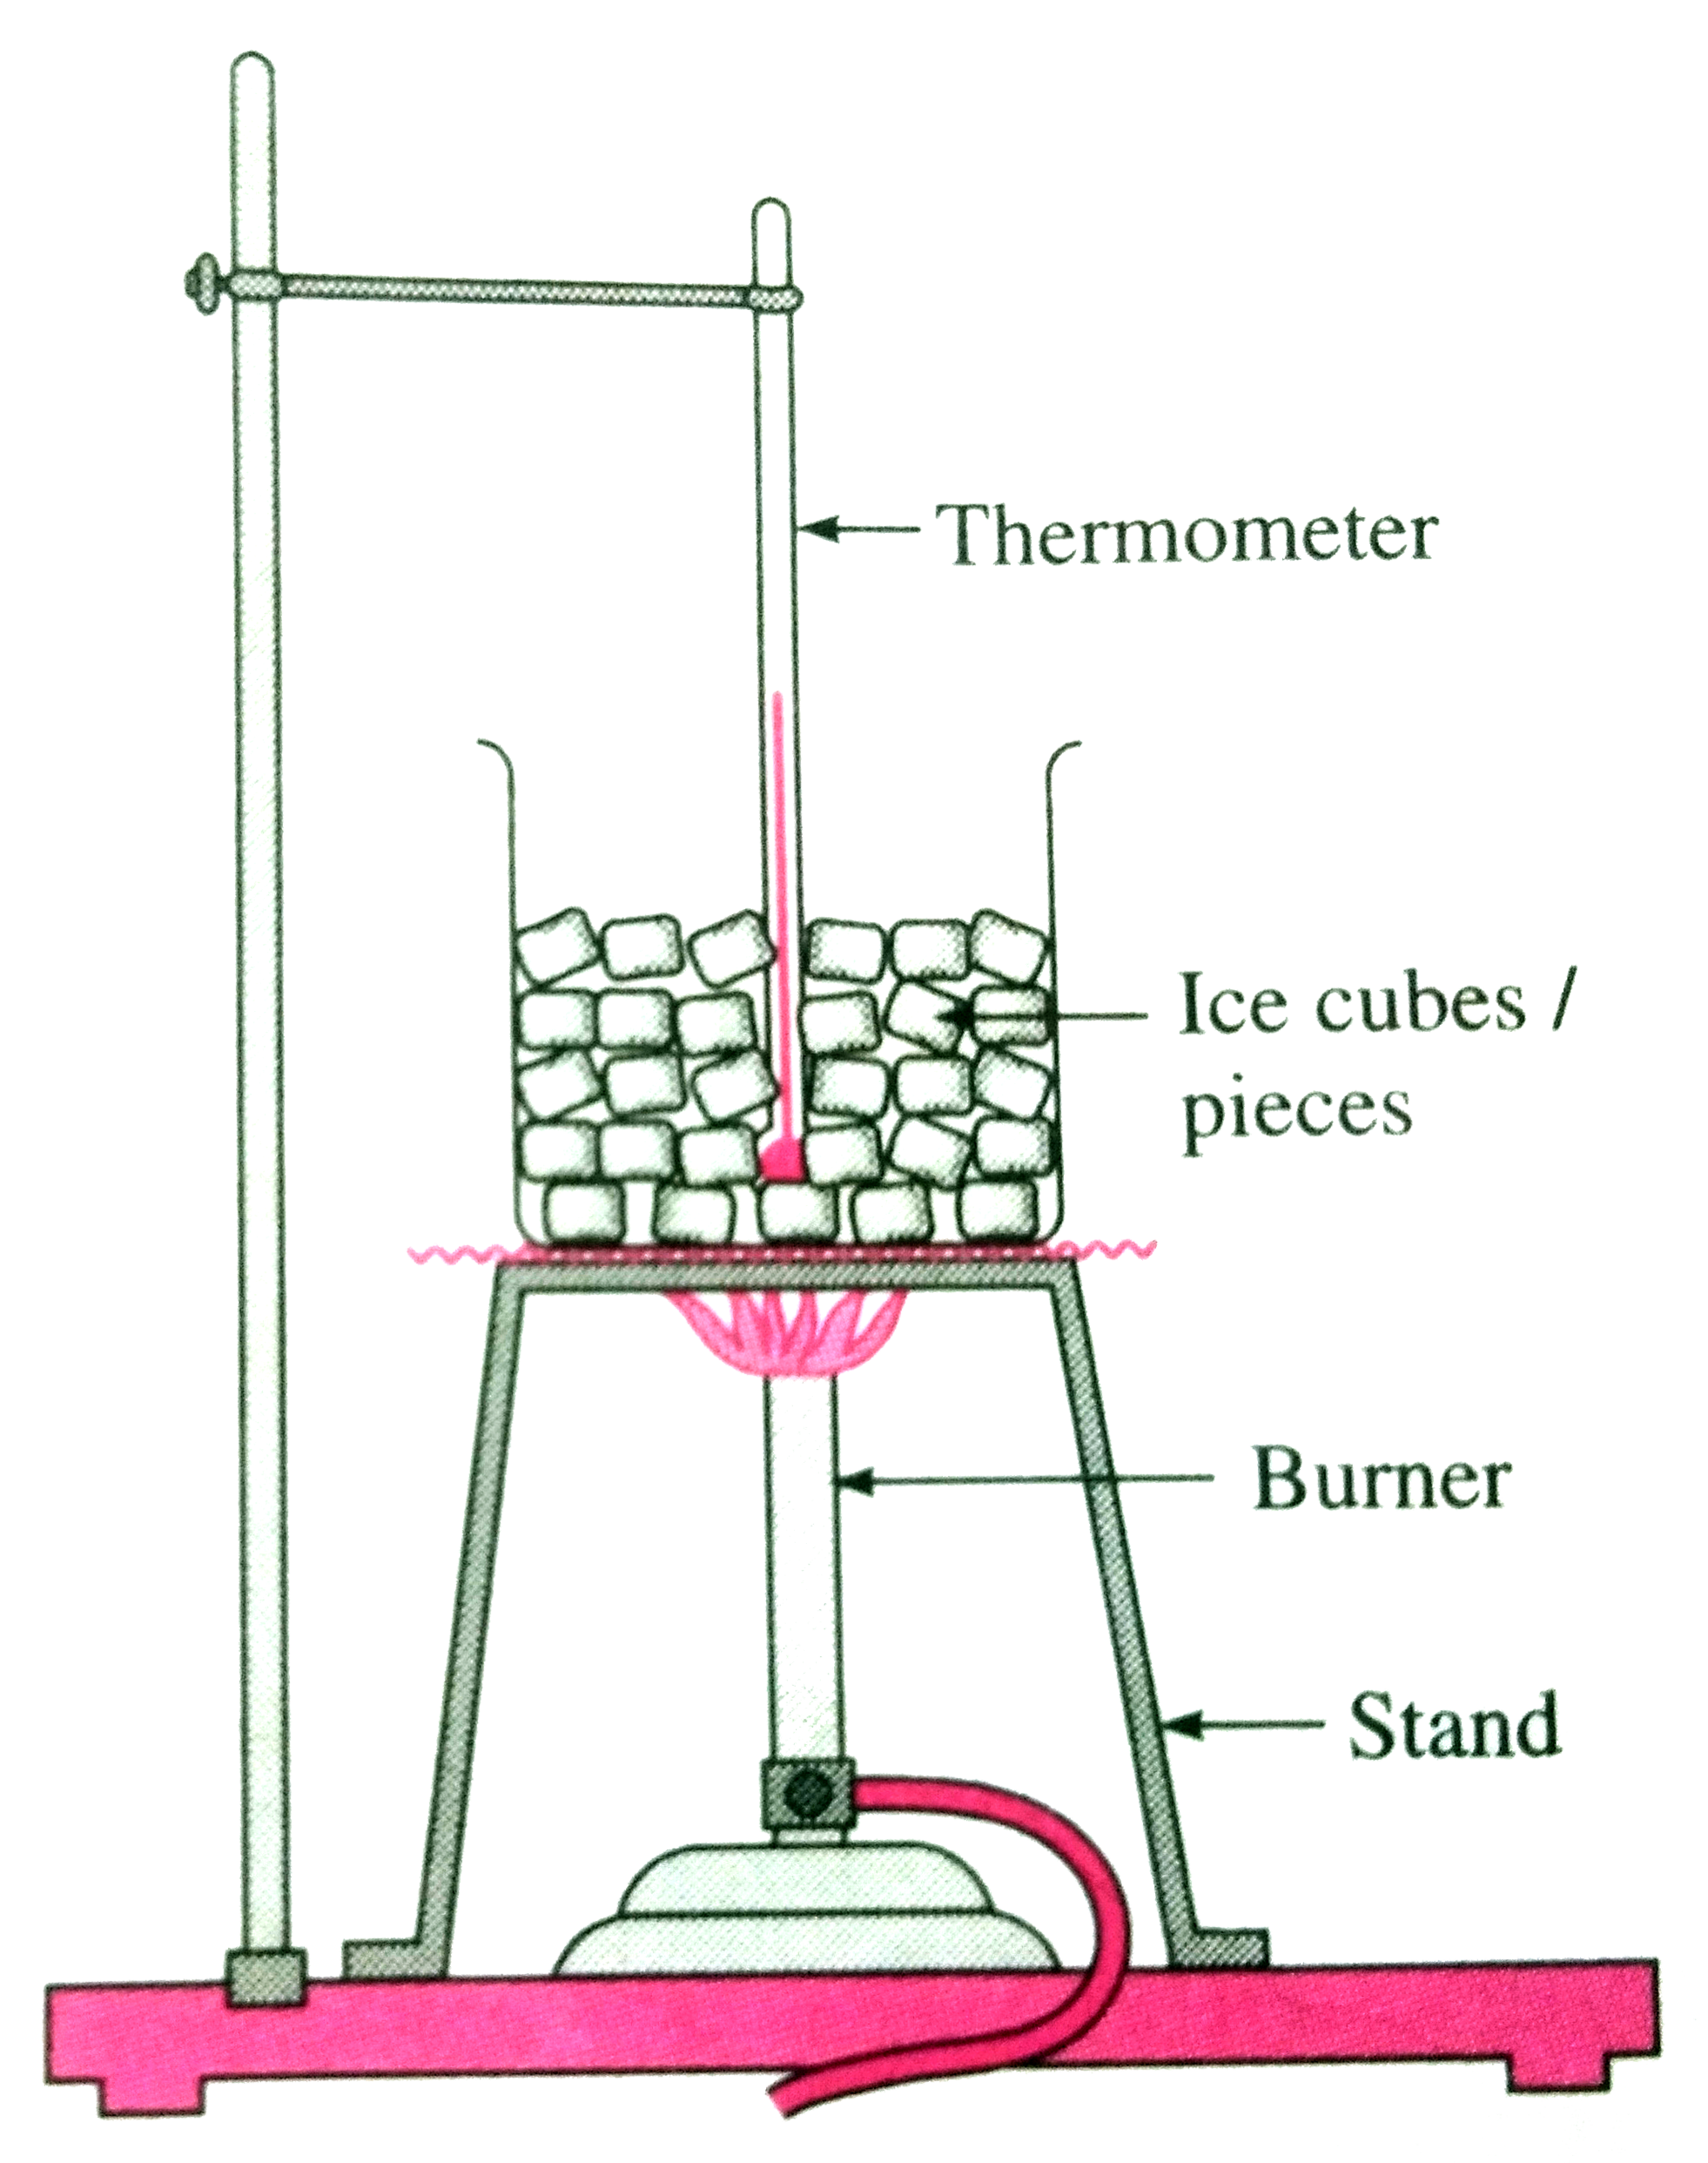
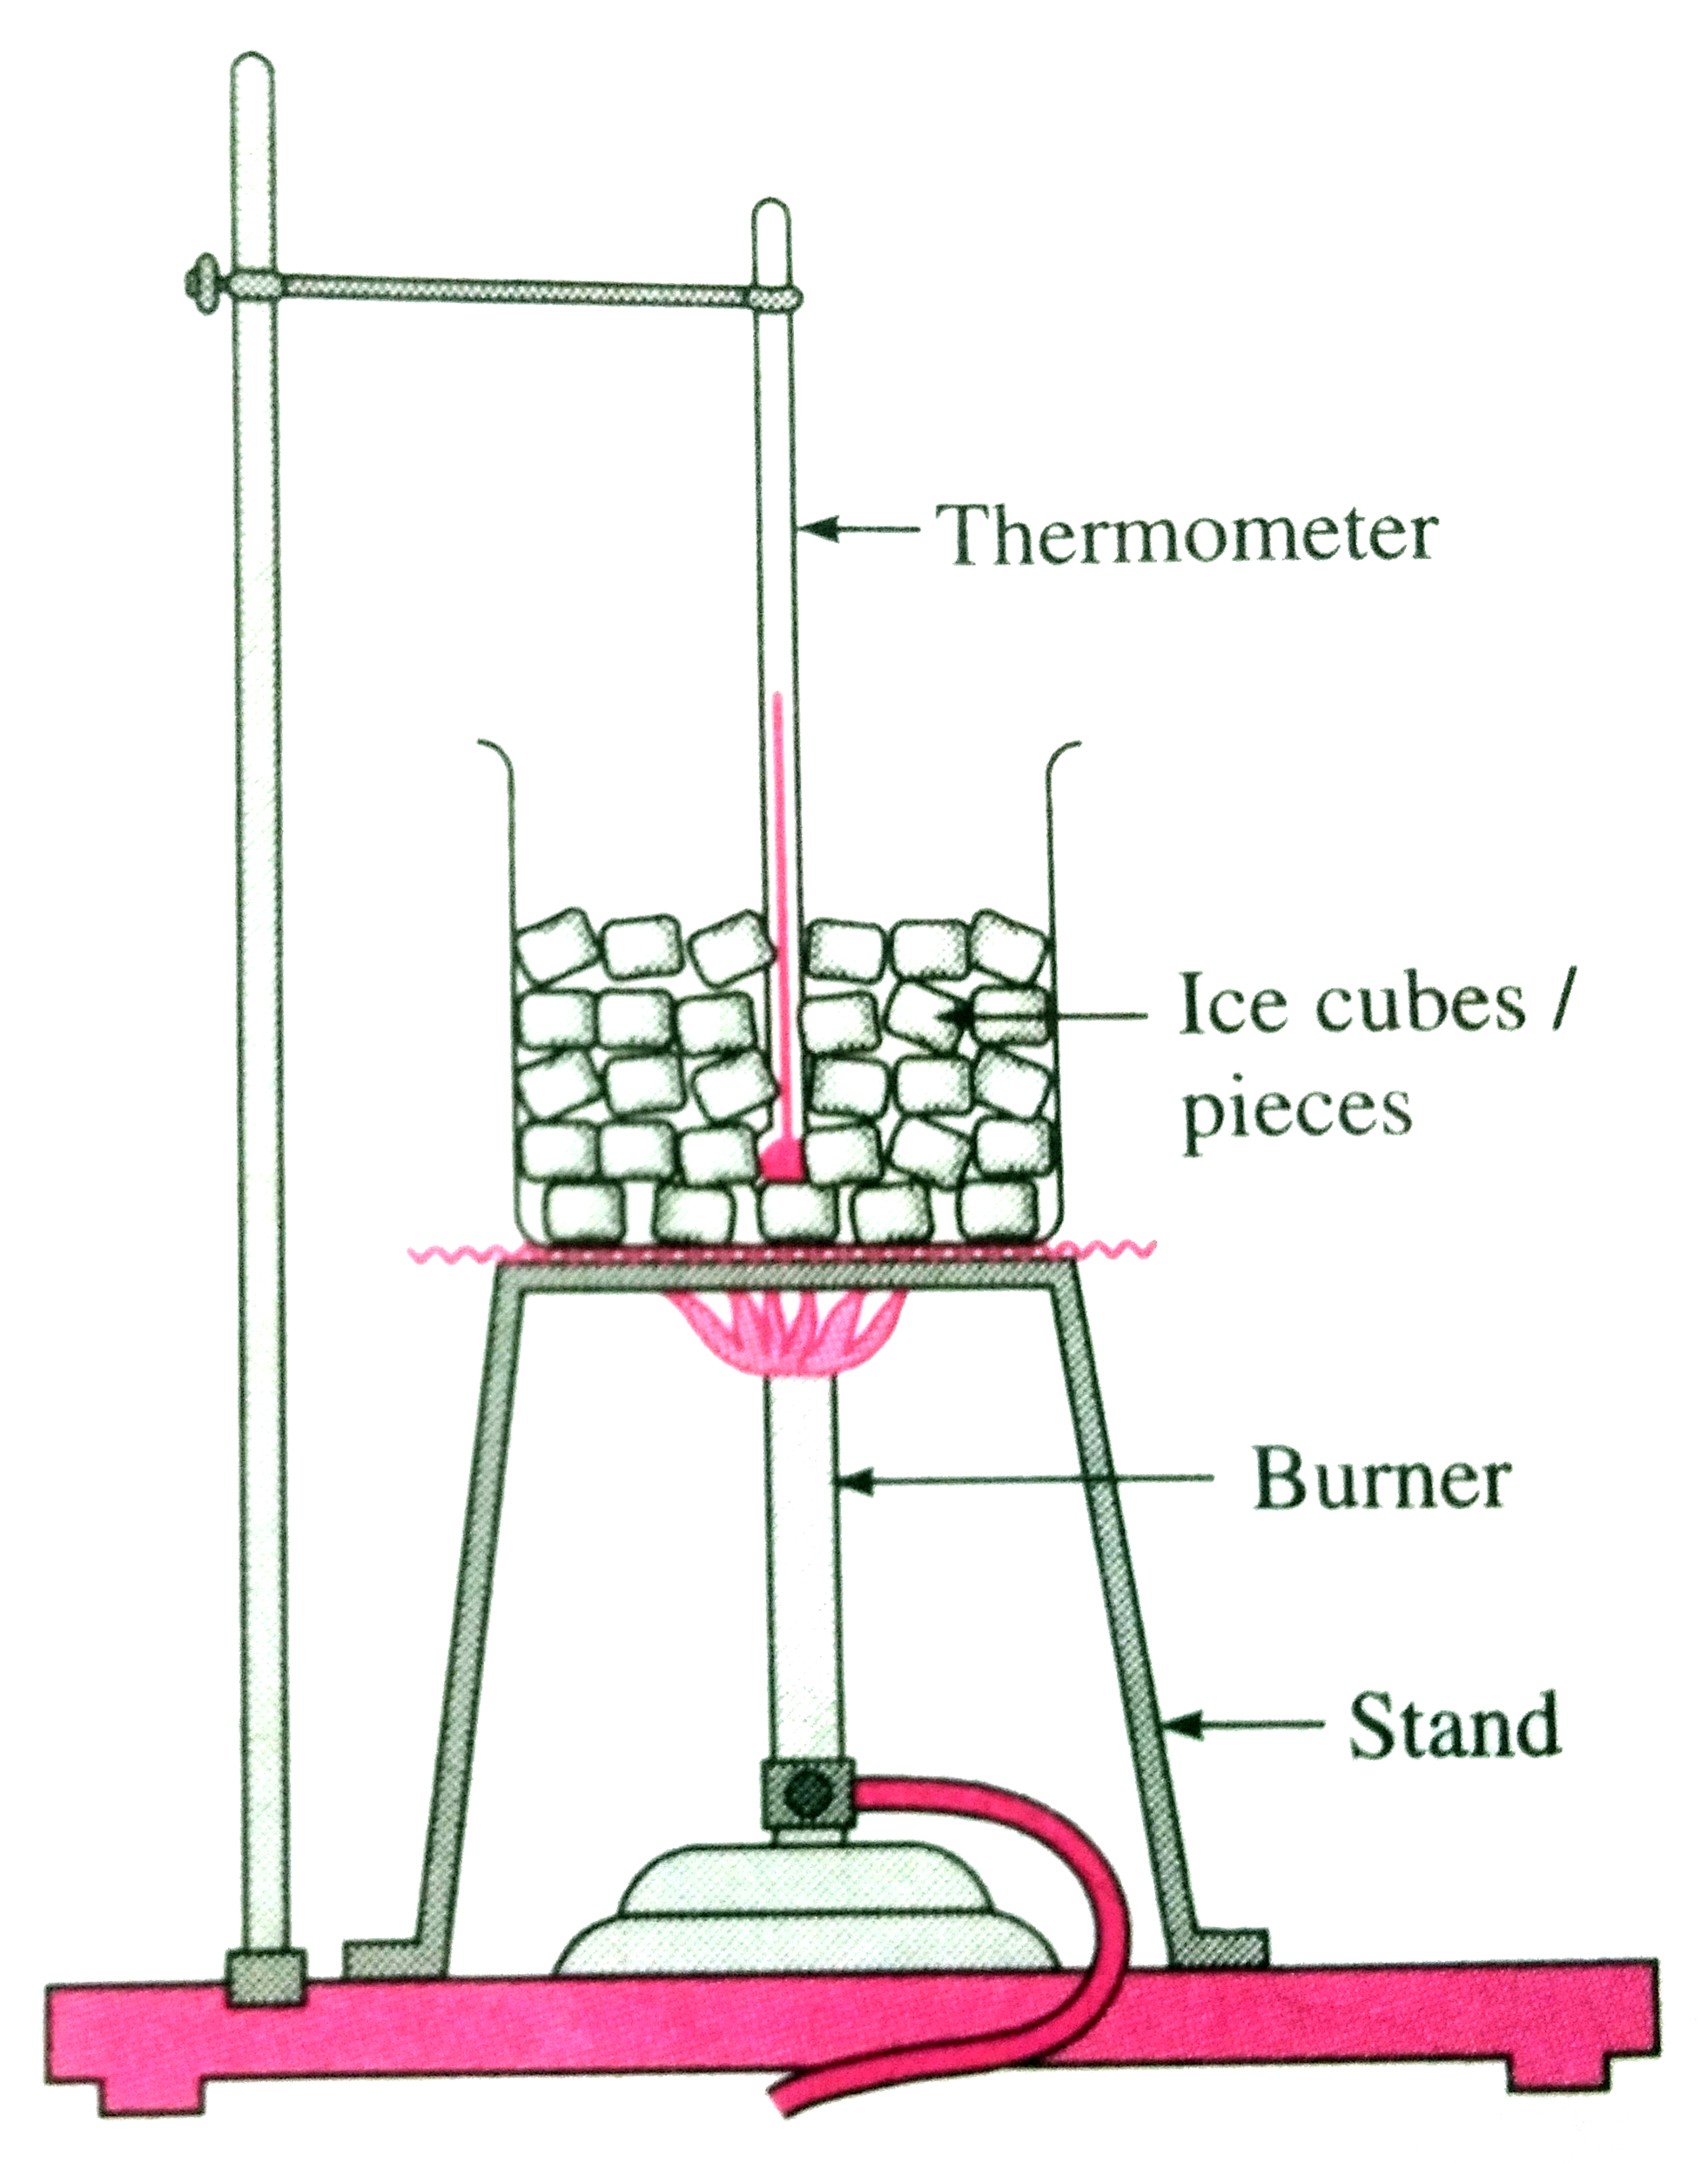
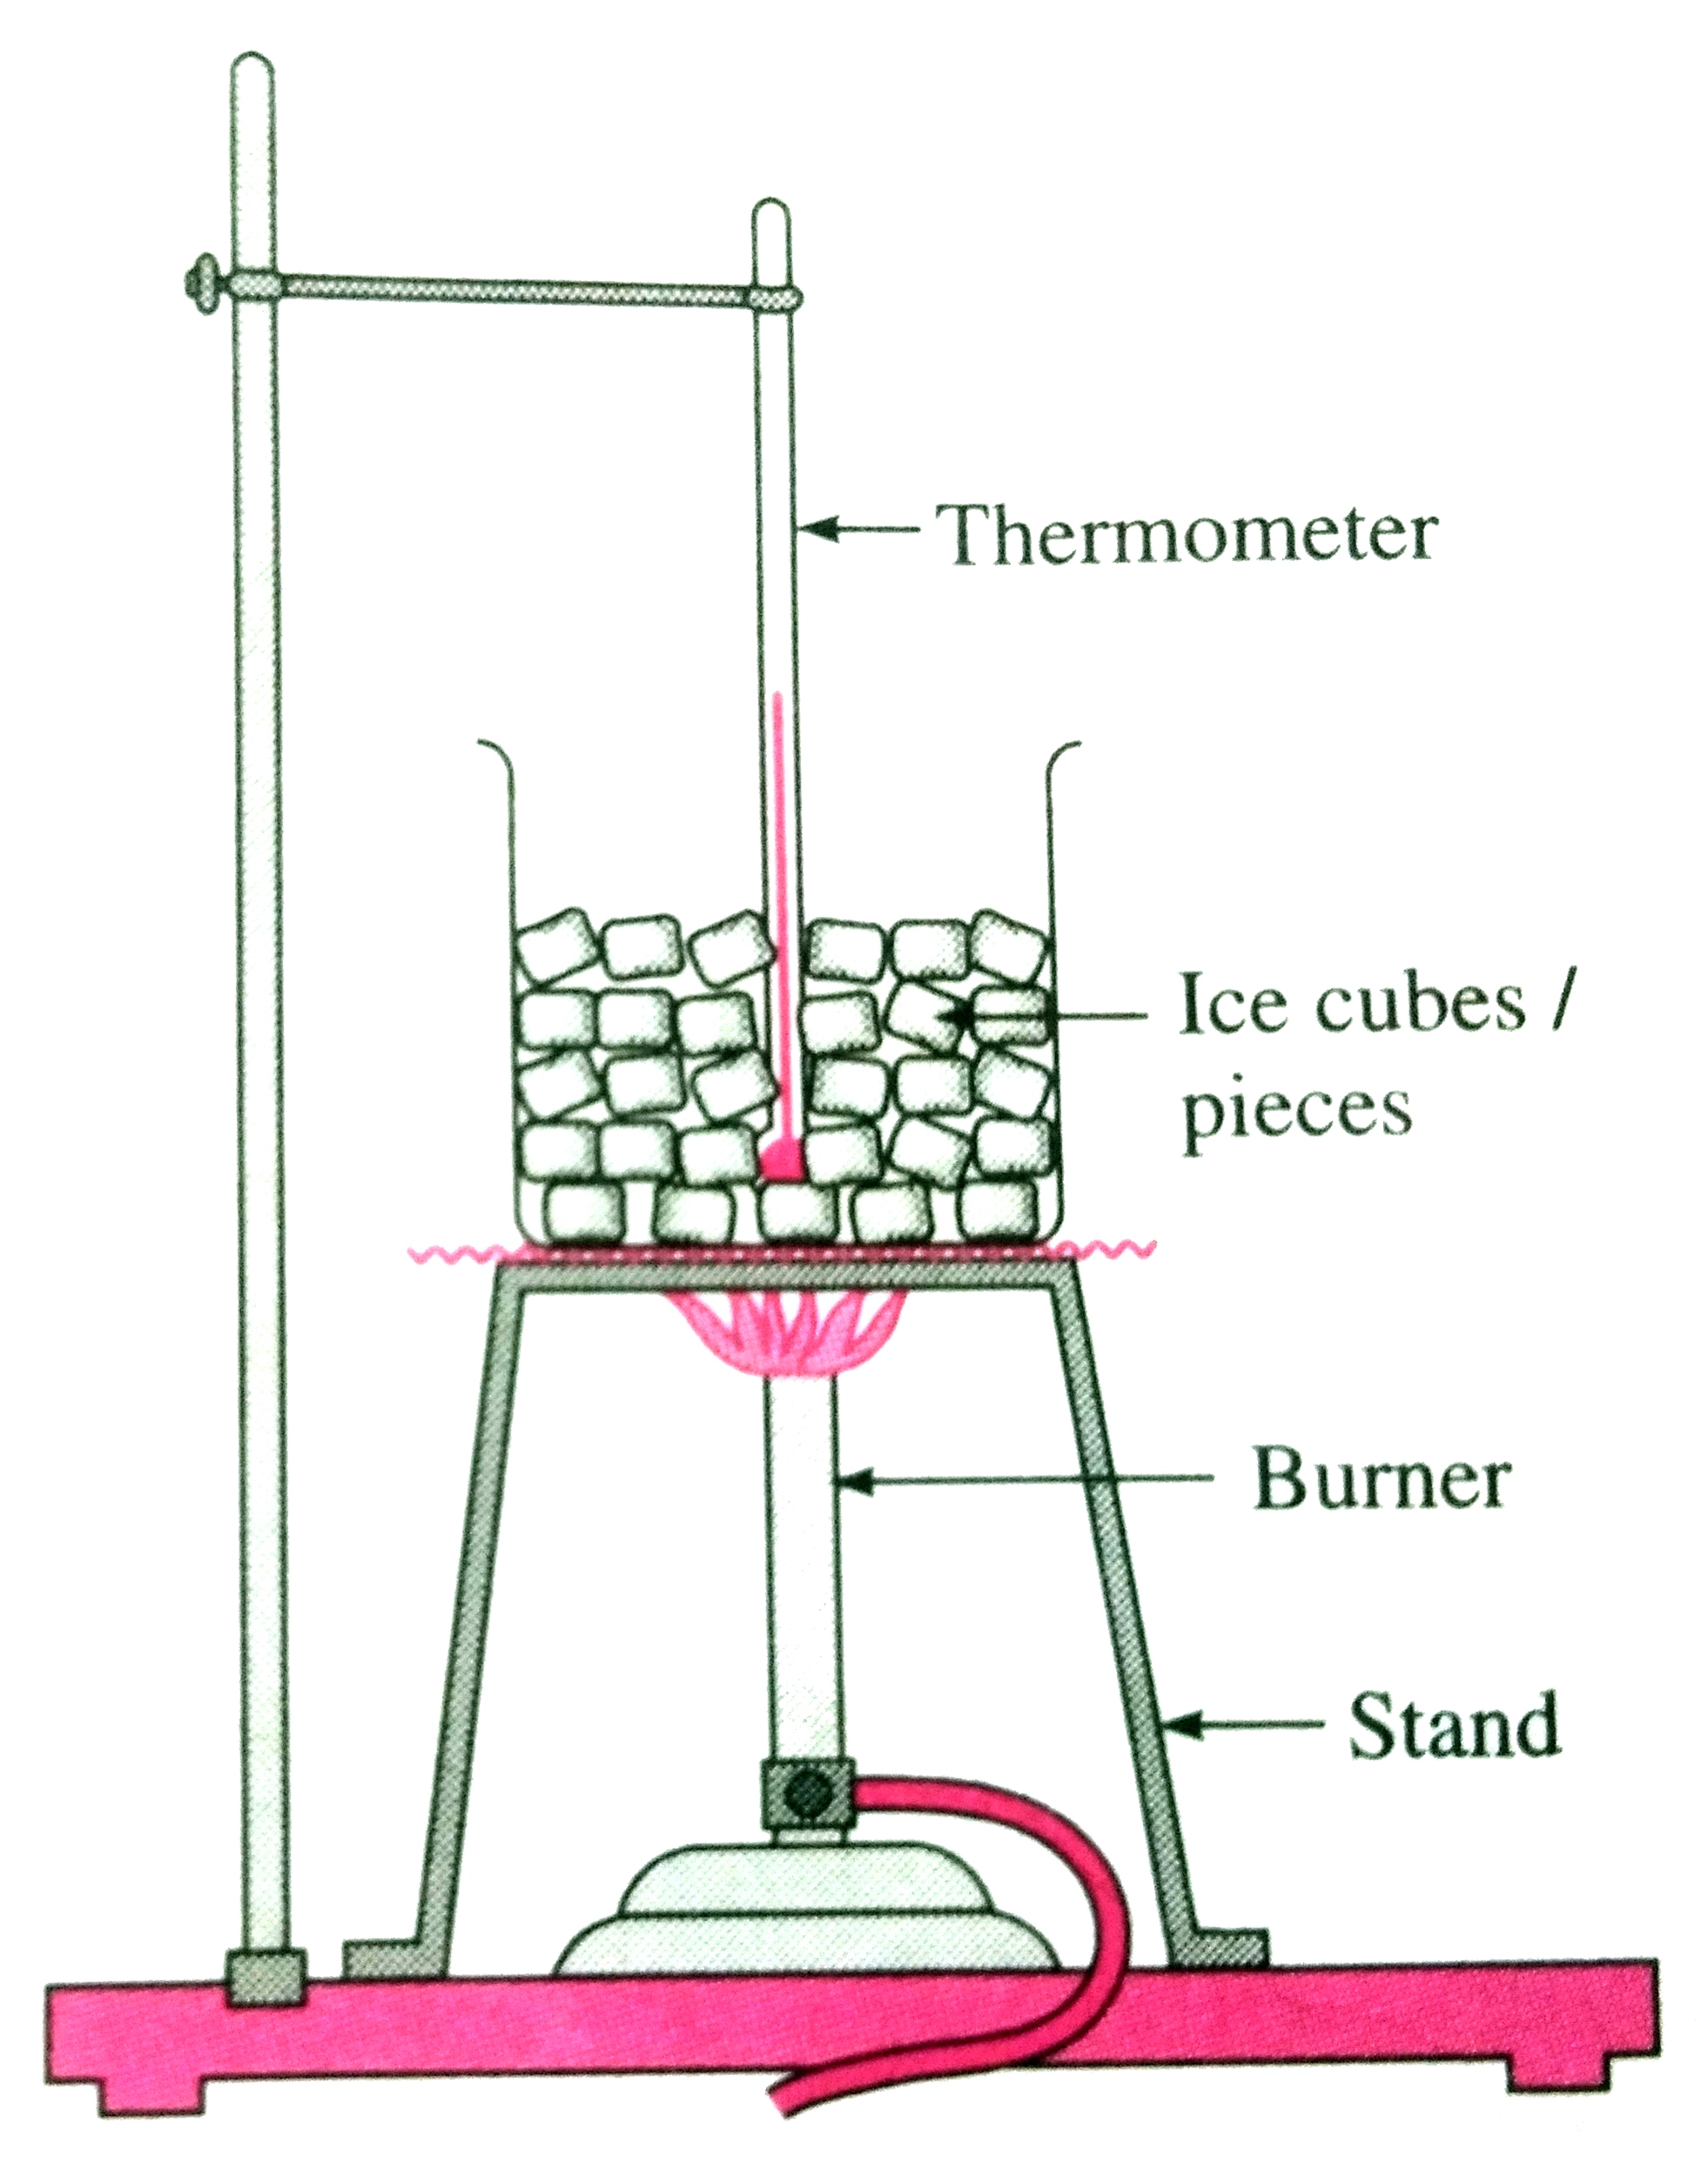
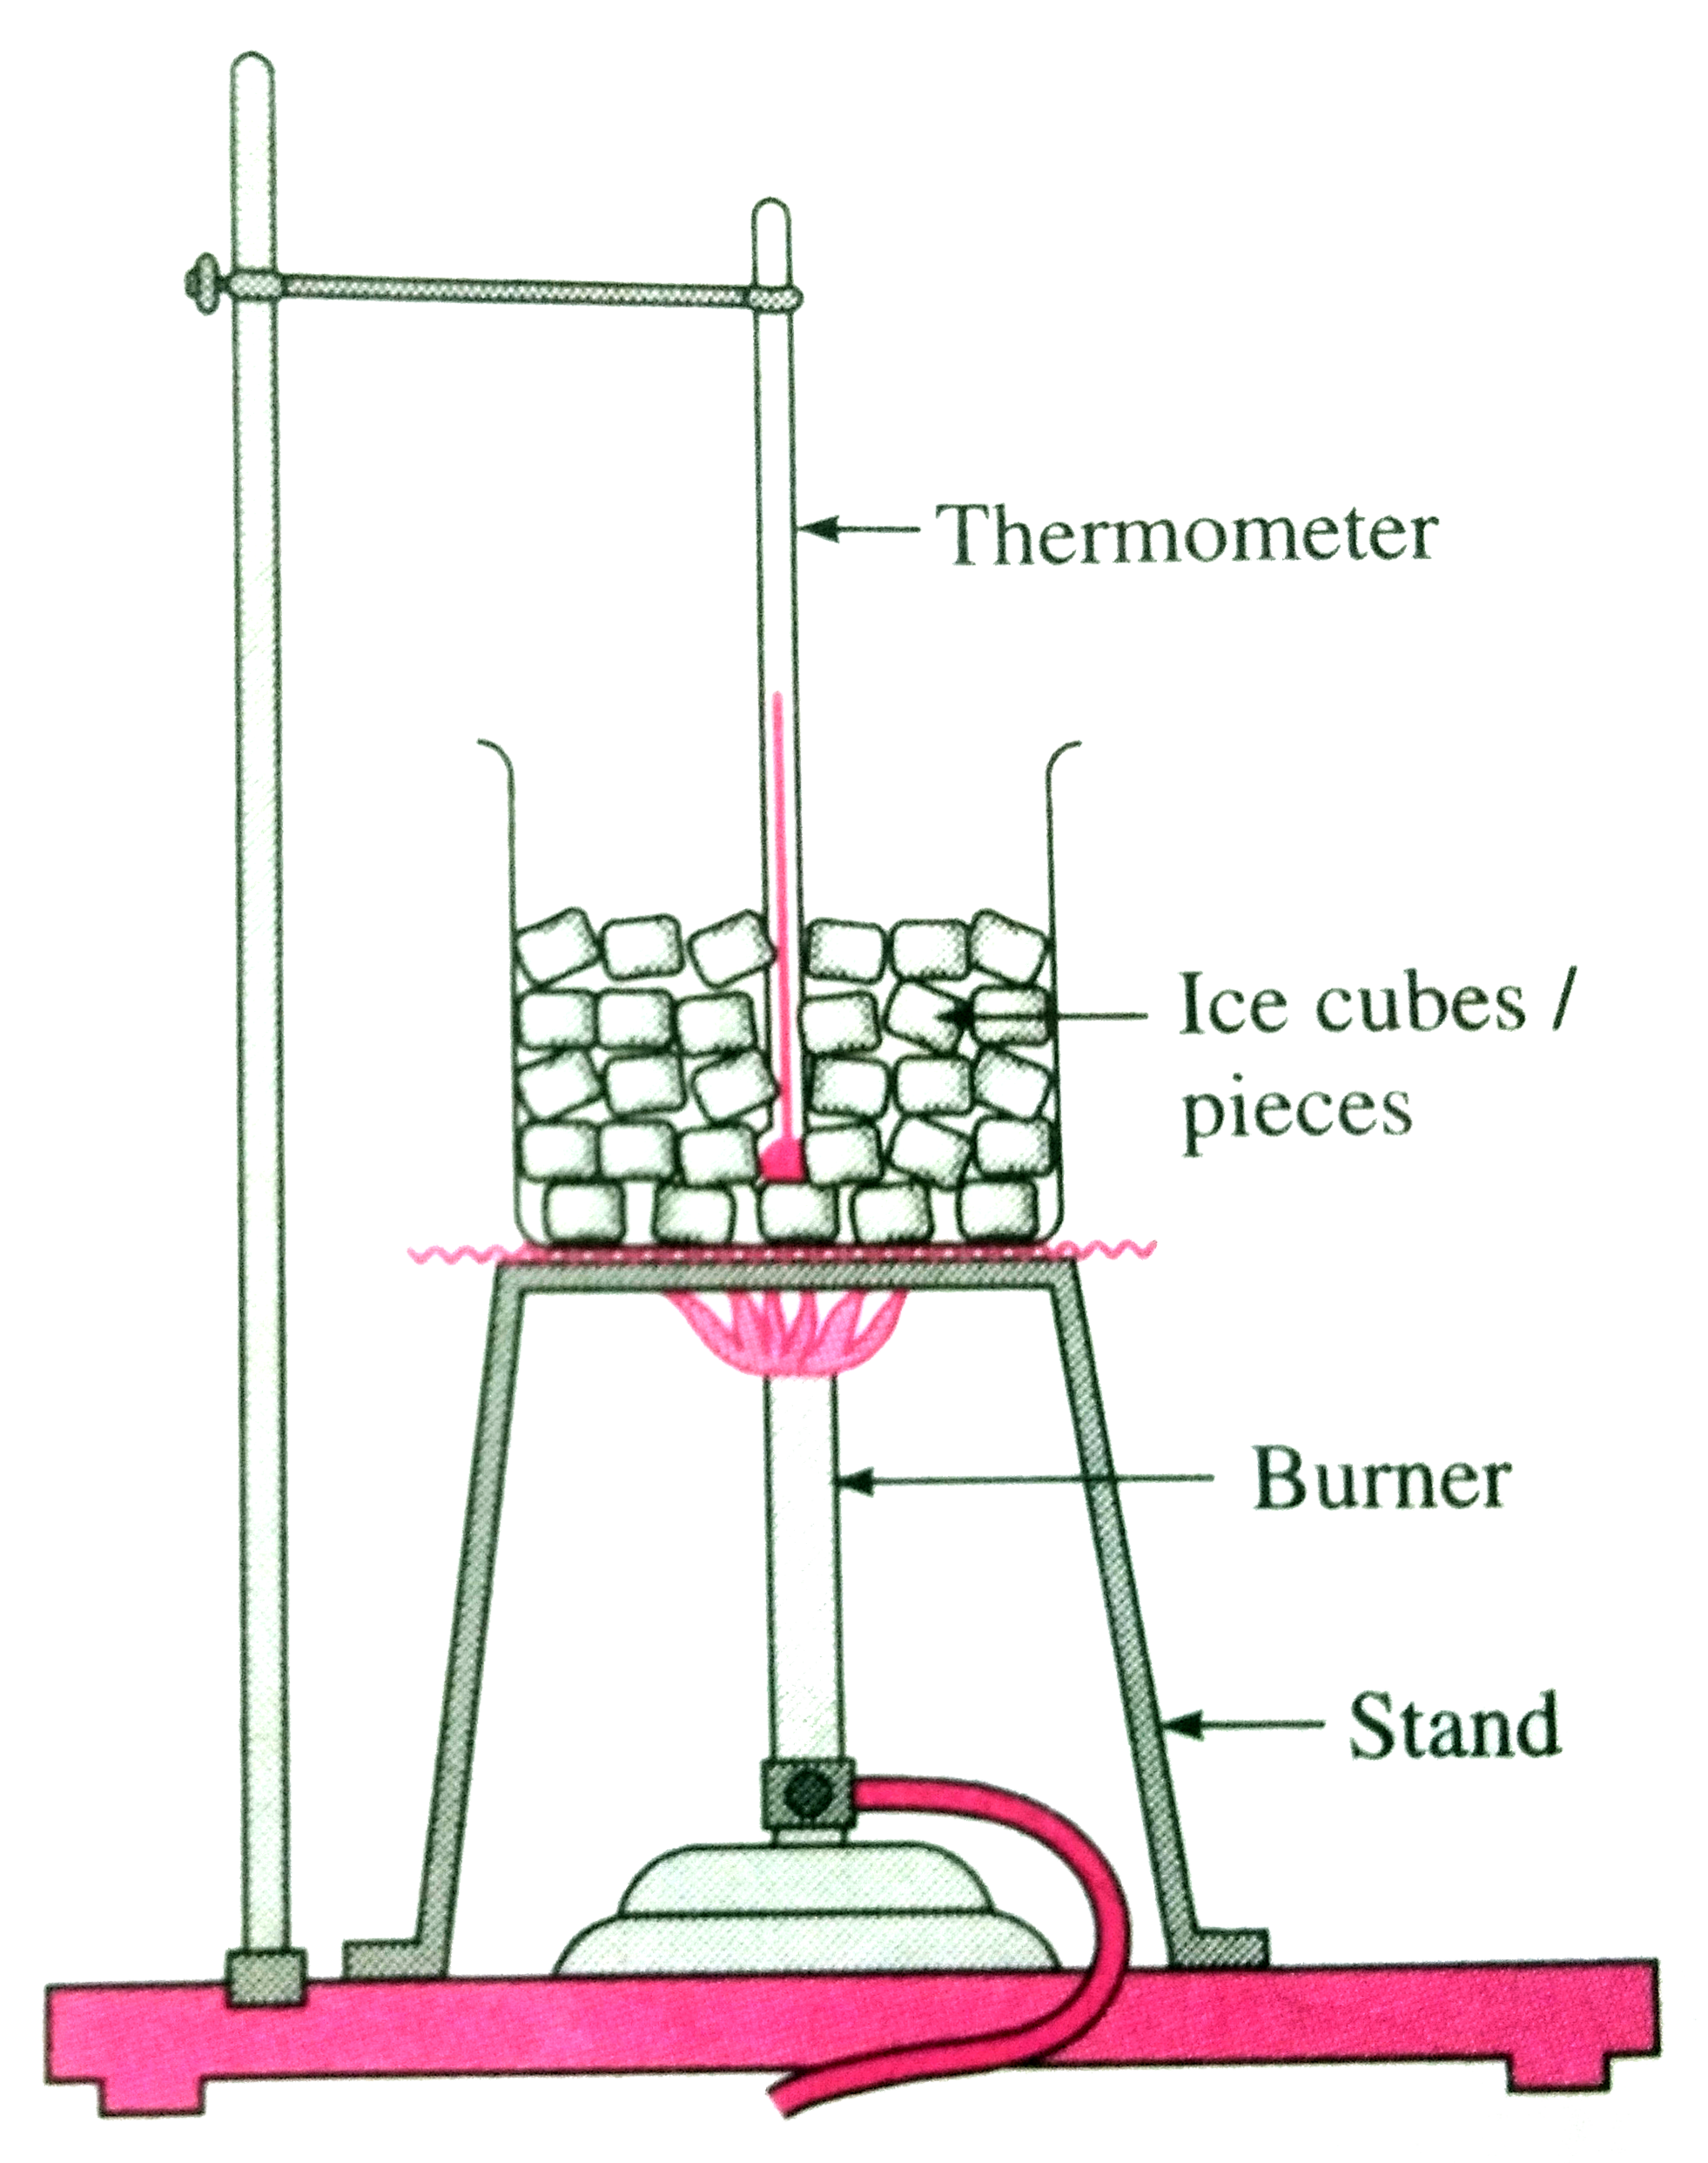
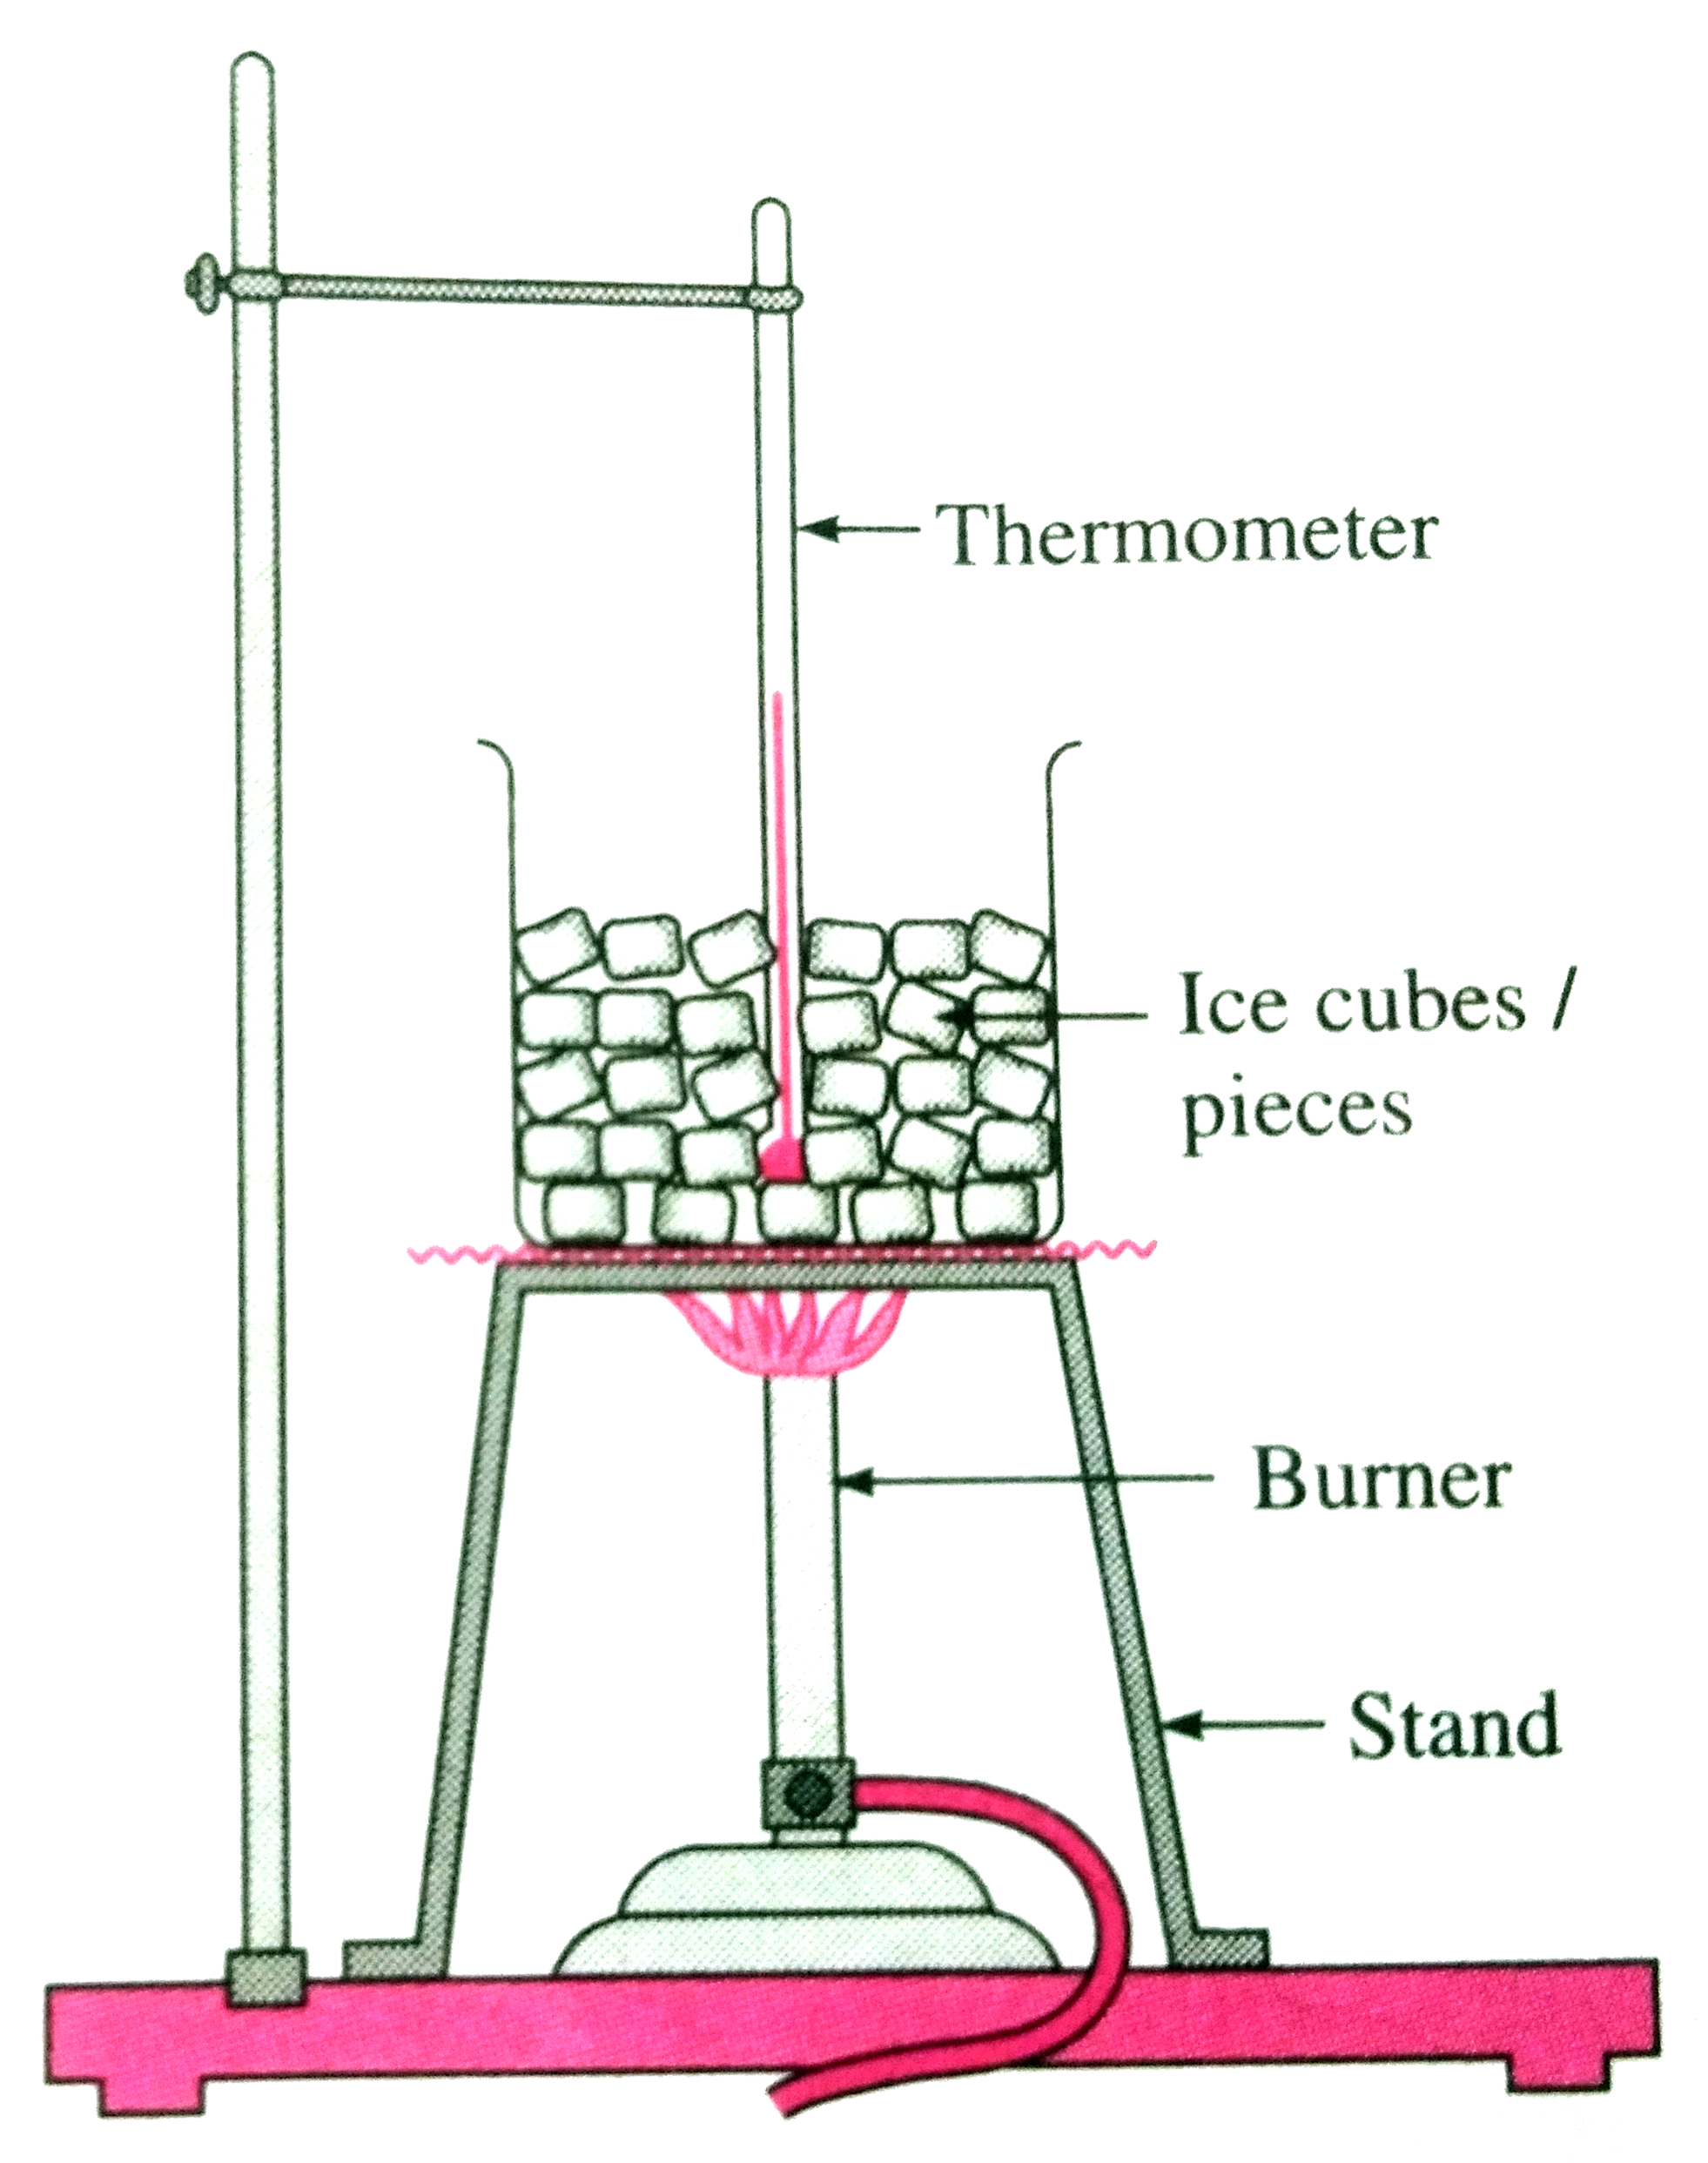
(1) Take a few pieces of ice in a glass beaker as shown in figure.
(2) Insert the bulb of a thermometer in ice and measure its temperature.
(3) Put the beaker on a stand and heat the ice usinga burner.
(4) Record the temperature using the thermometer after every minute.
(5) As the ice is heated,it starts melting. Stir the mixture of ice and water.
(6) Continue the heating even after ice starts melting.
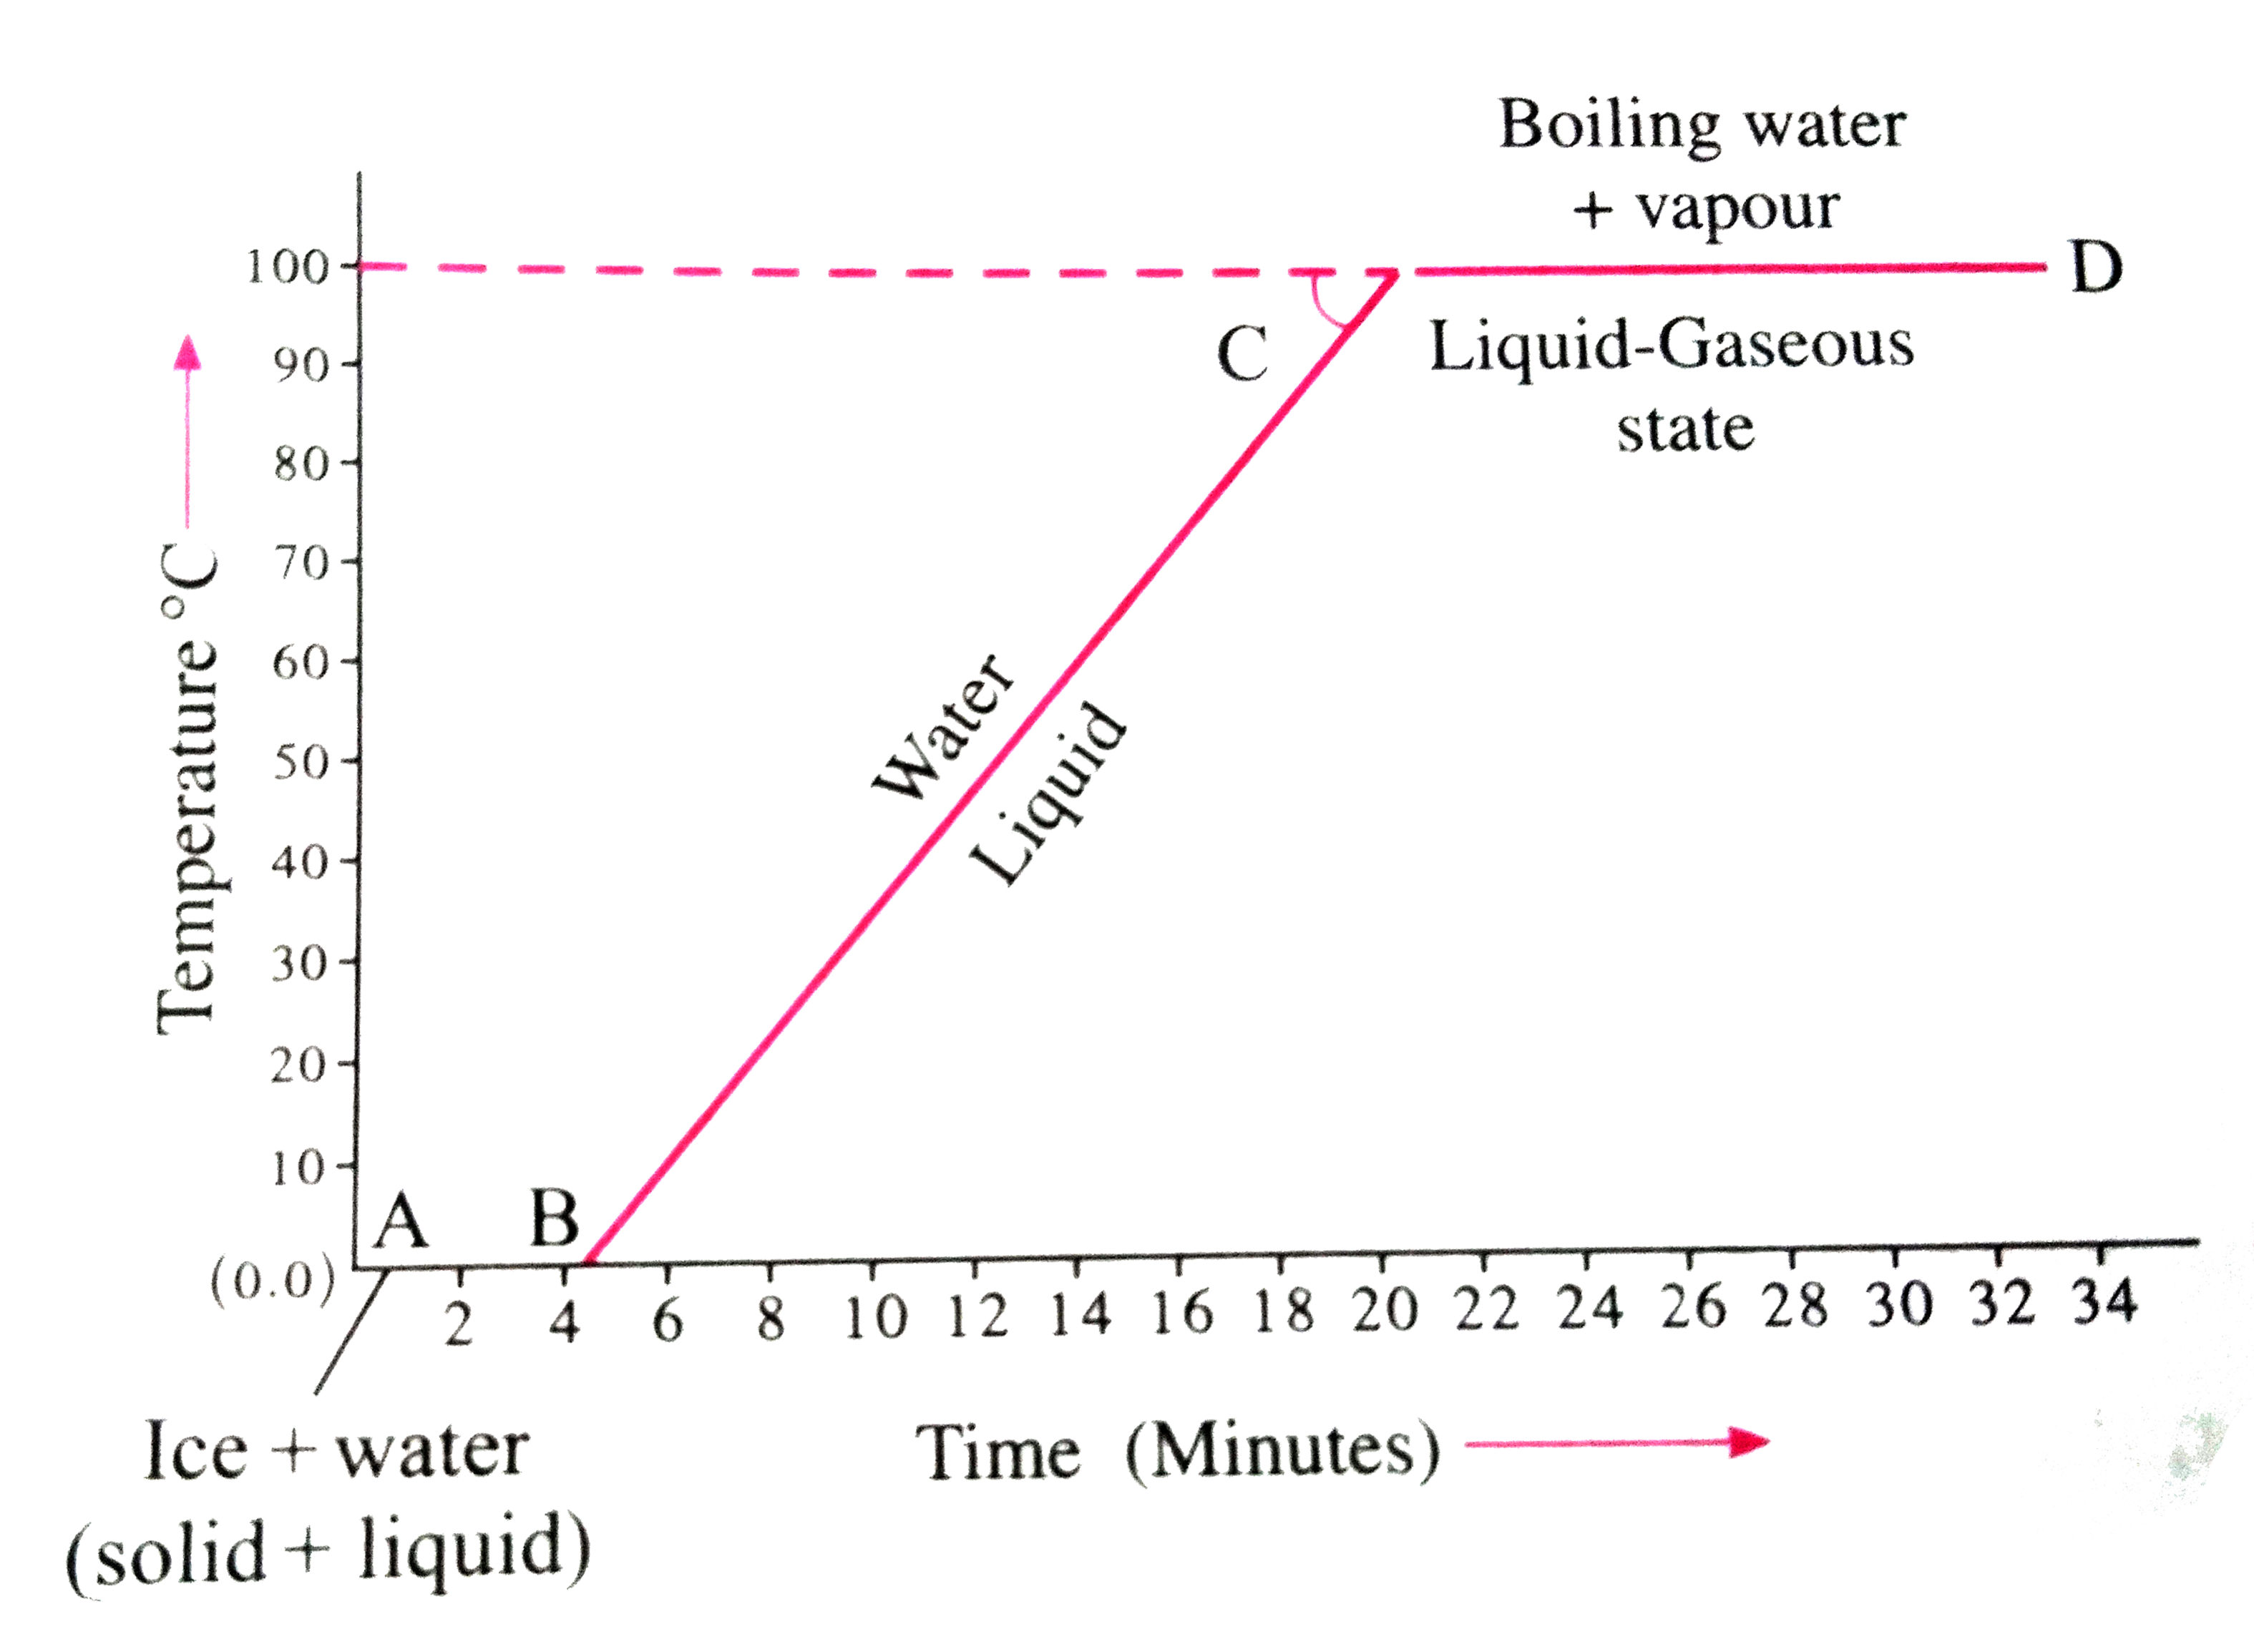
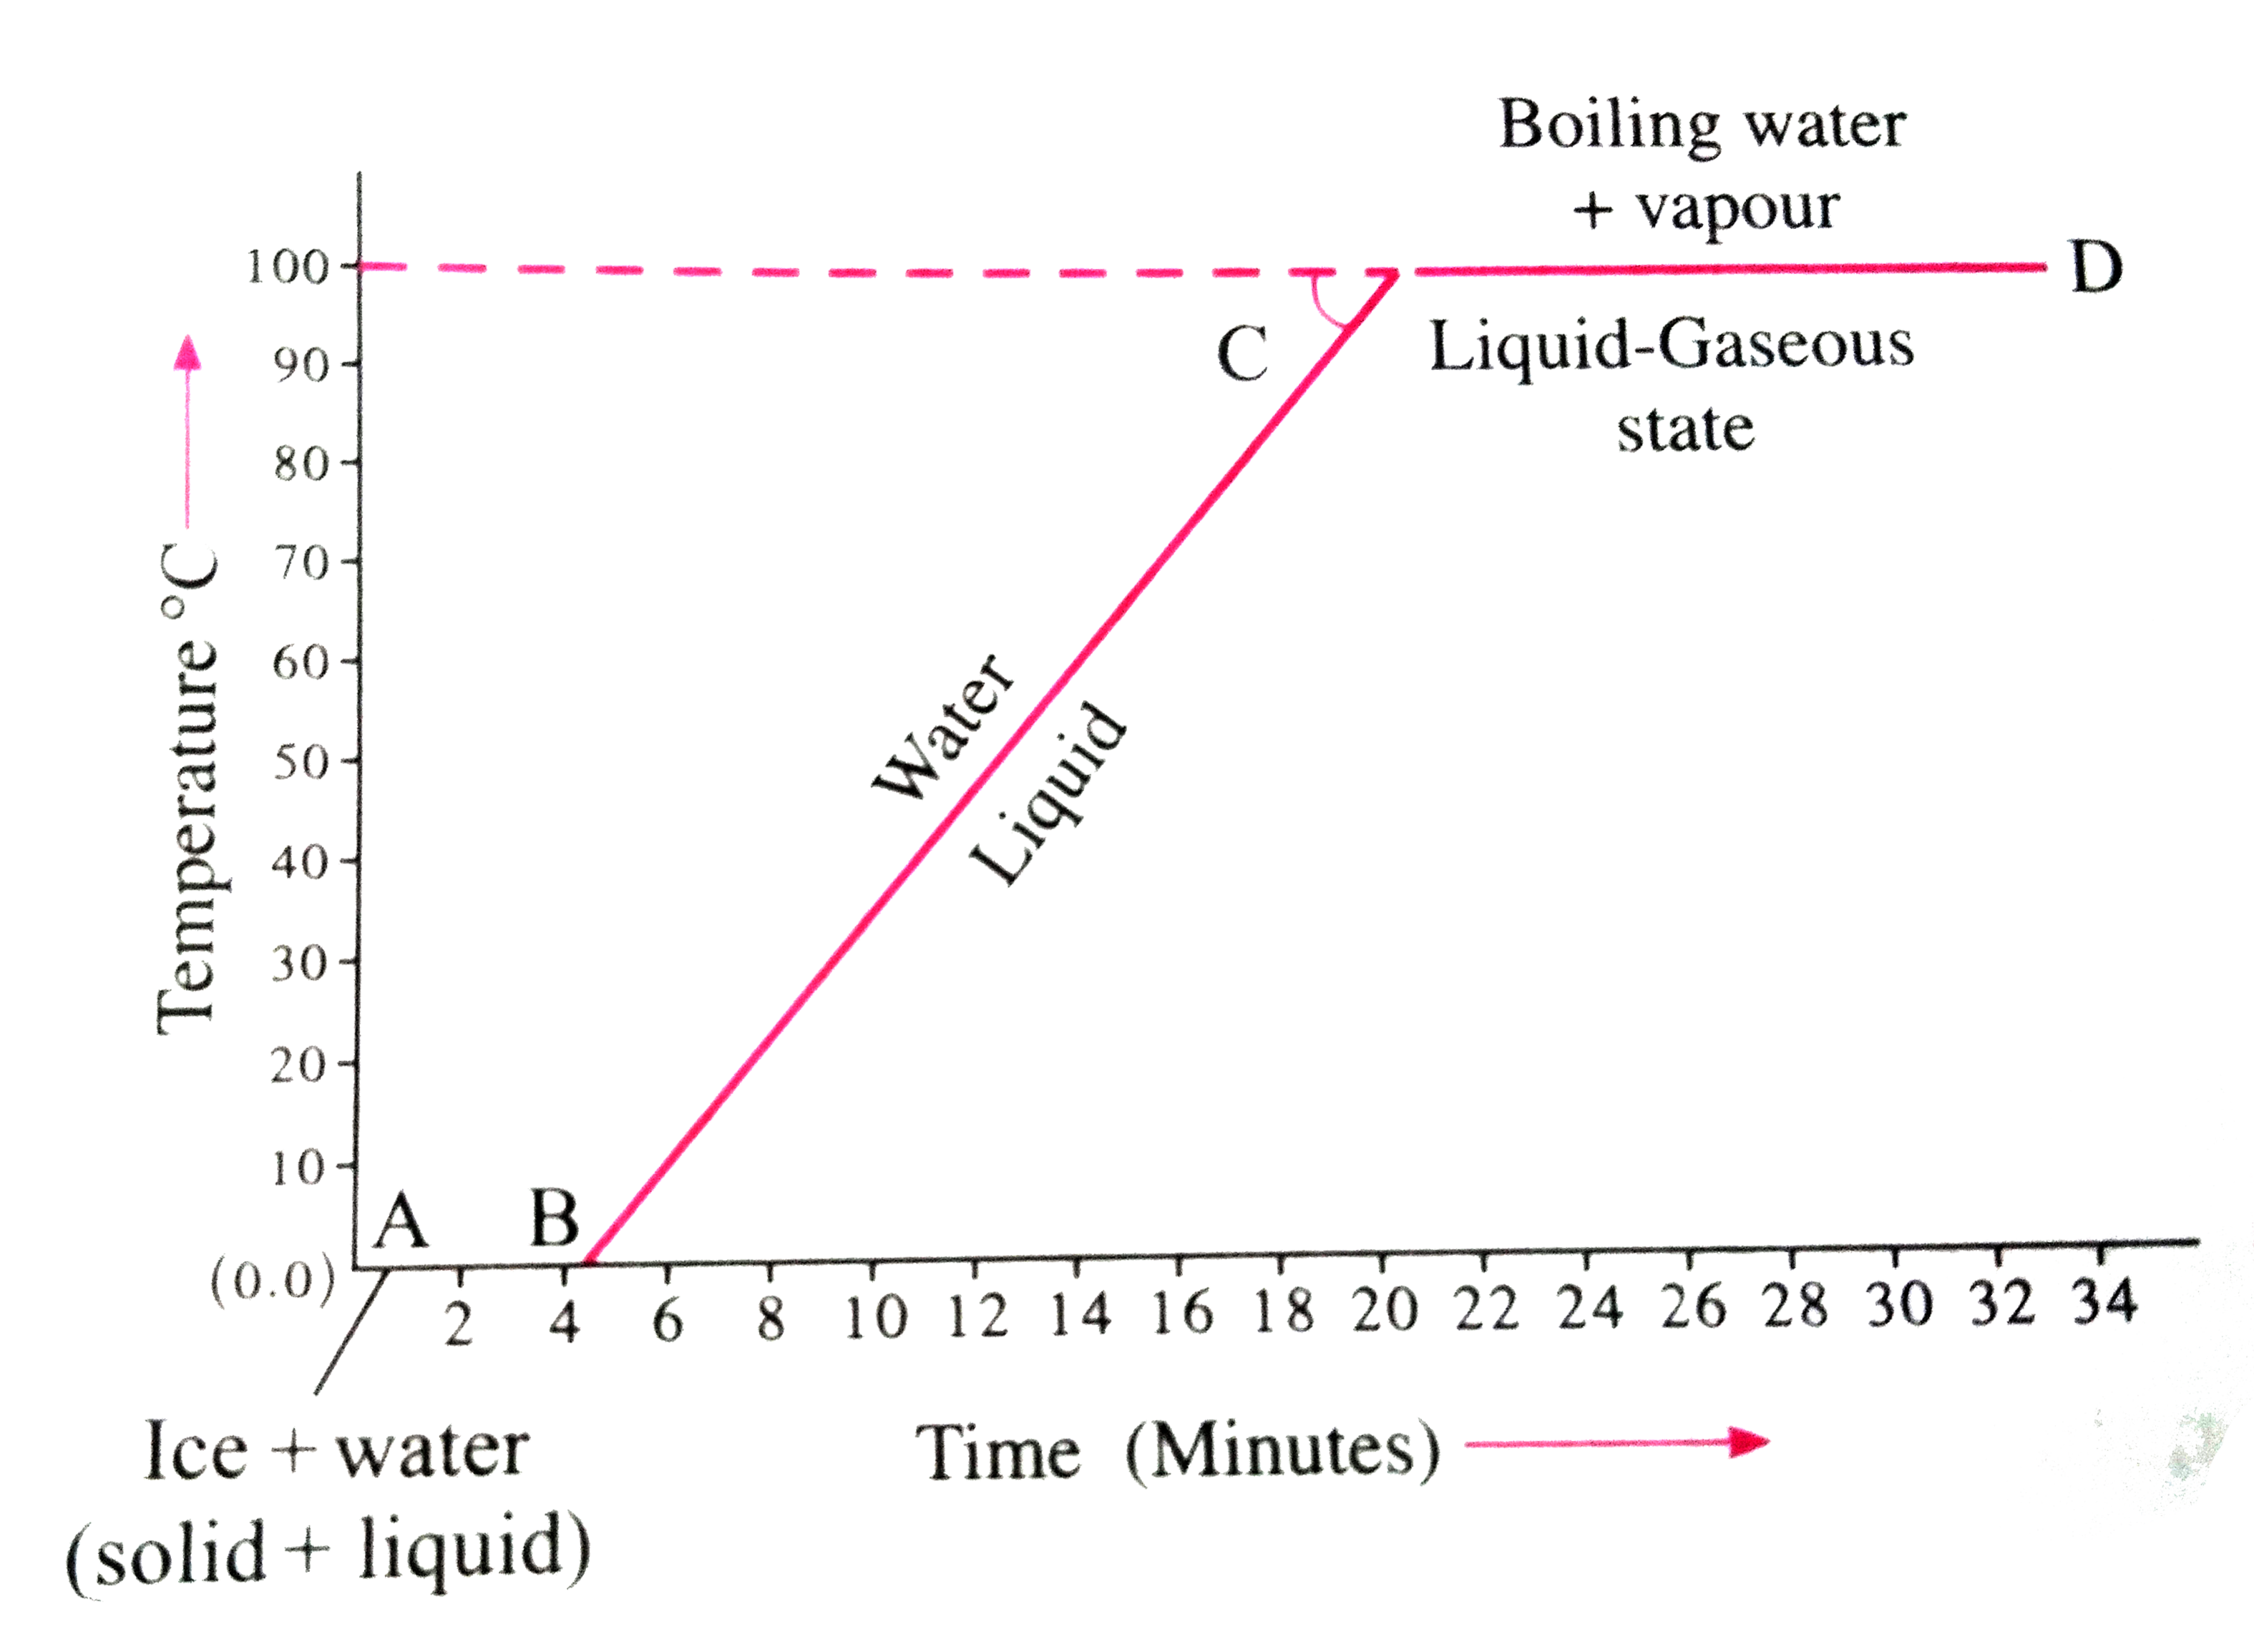
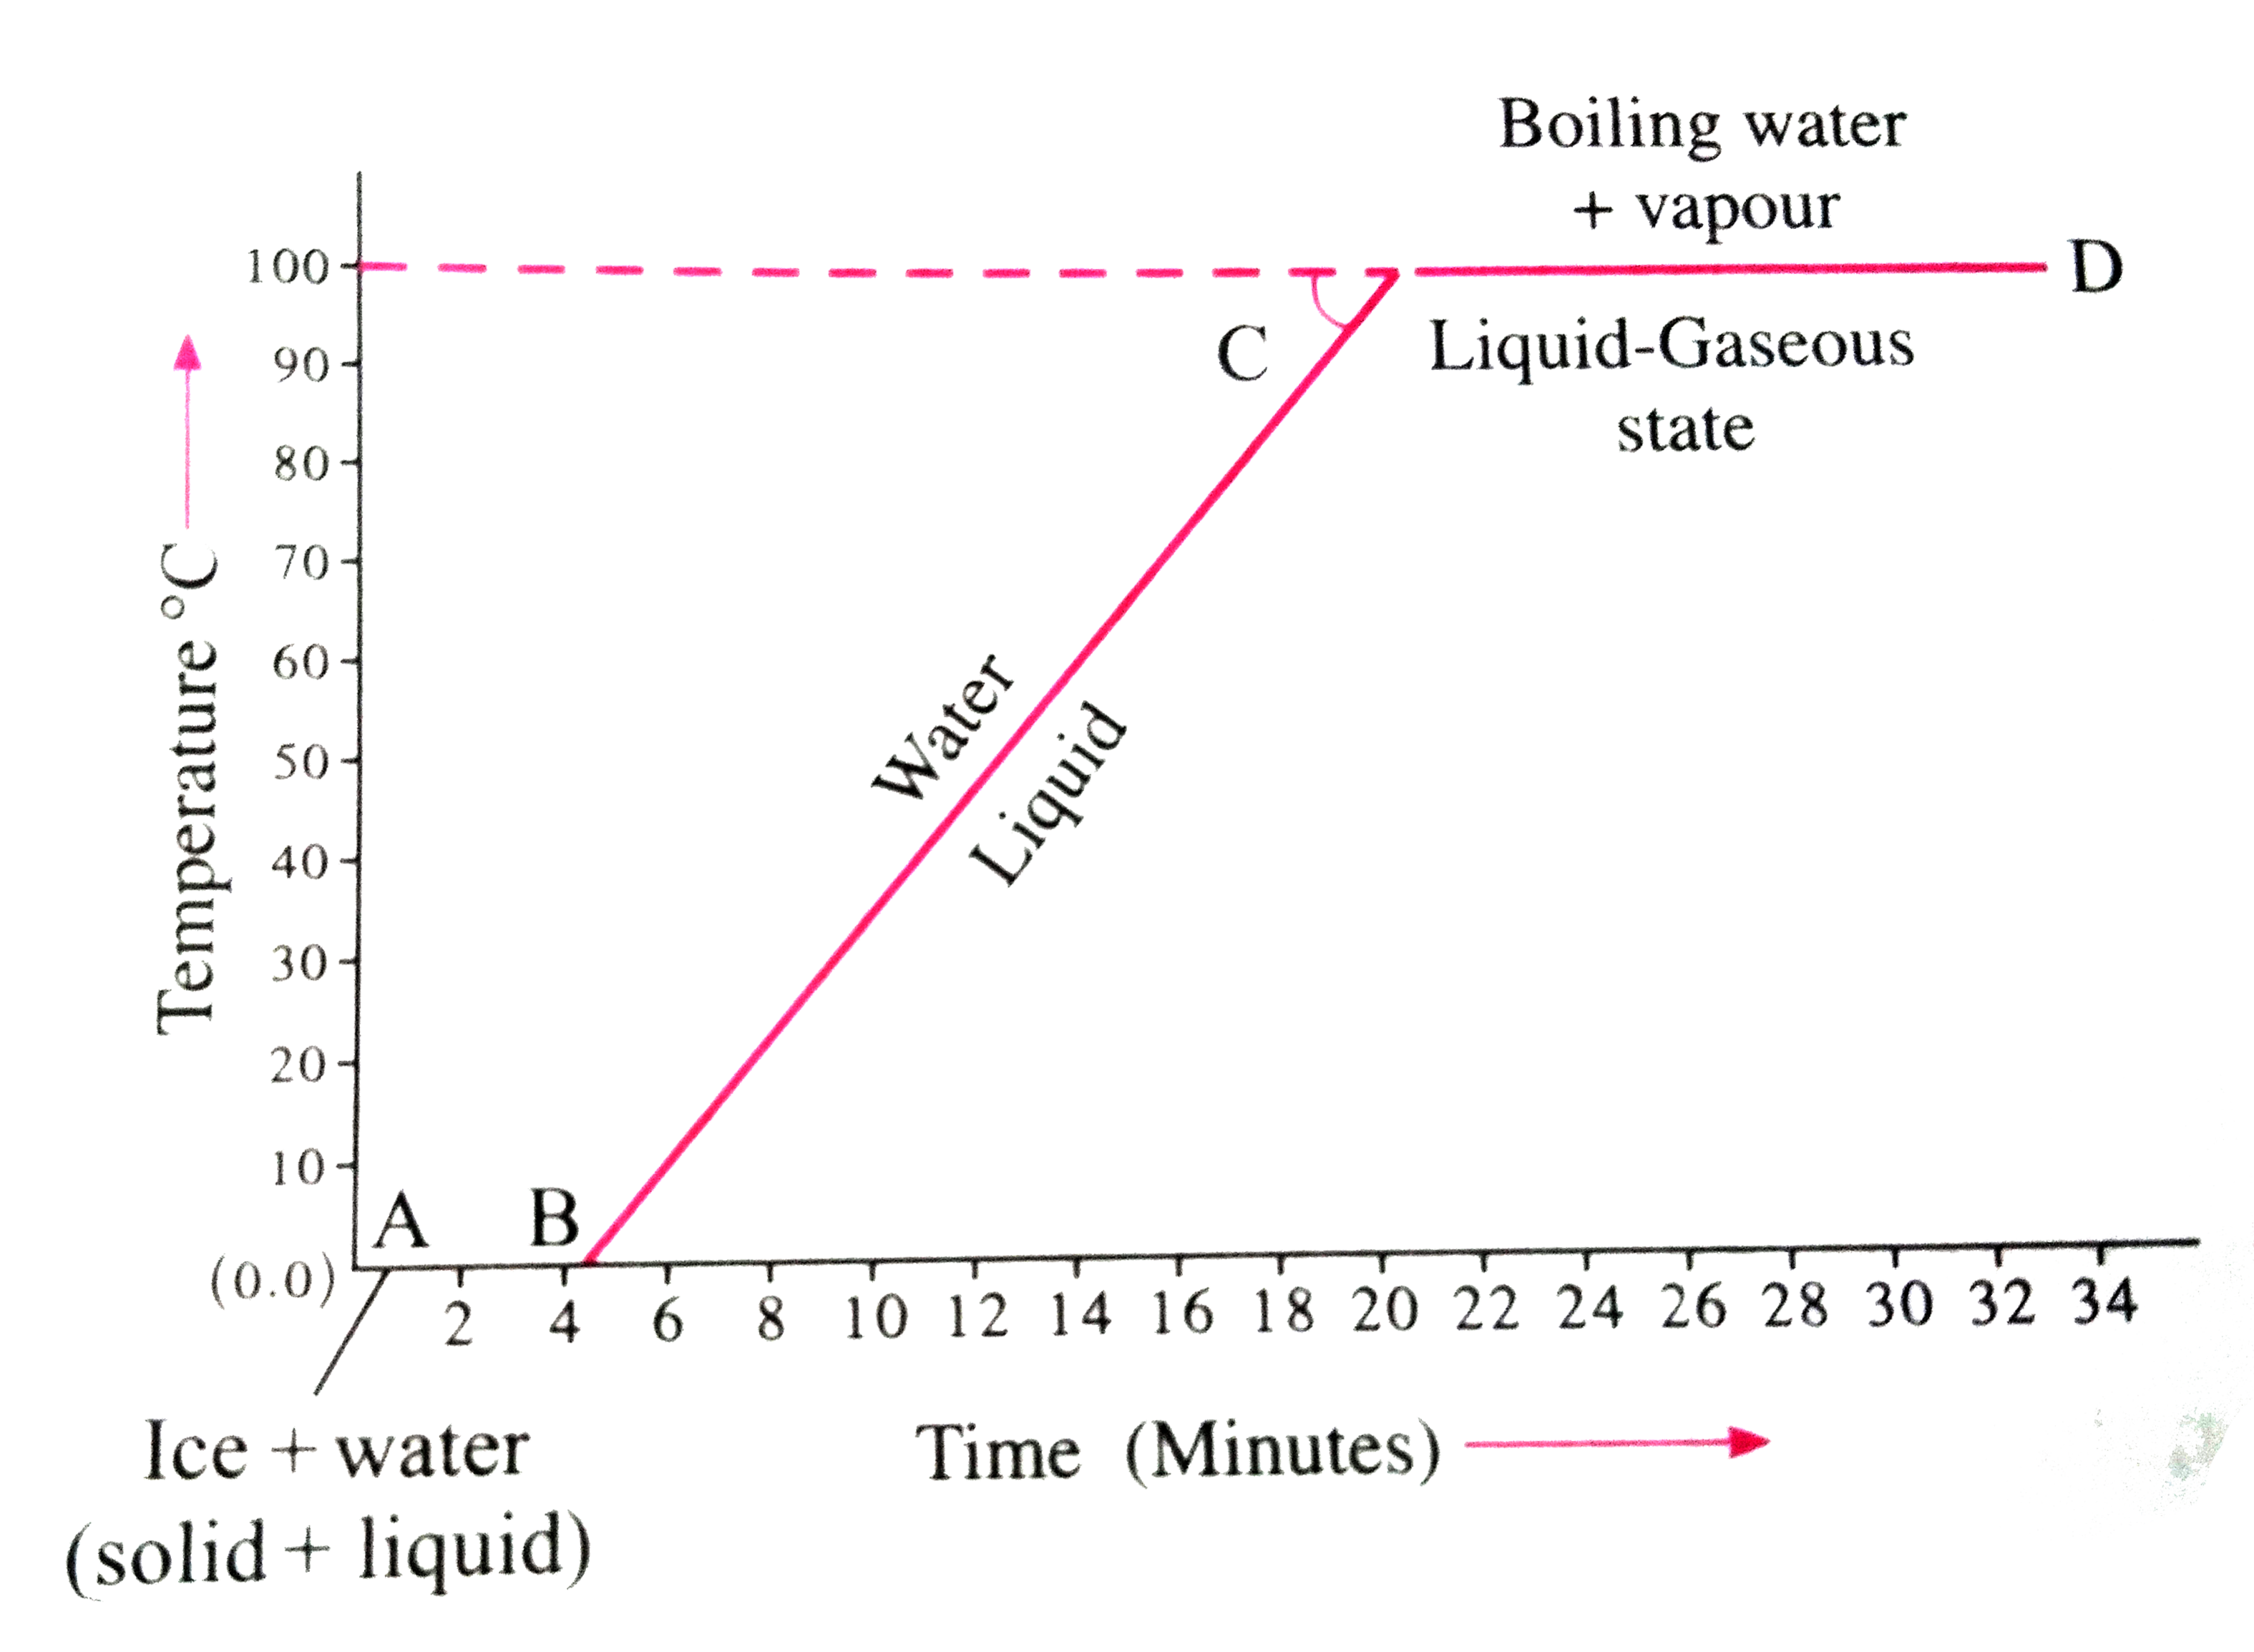
(7) Draw a graph of temperature versus time.
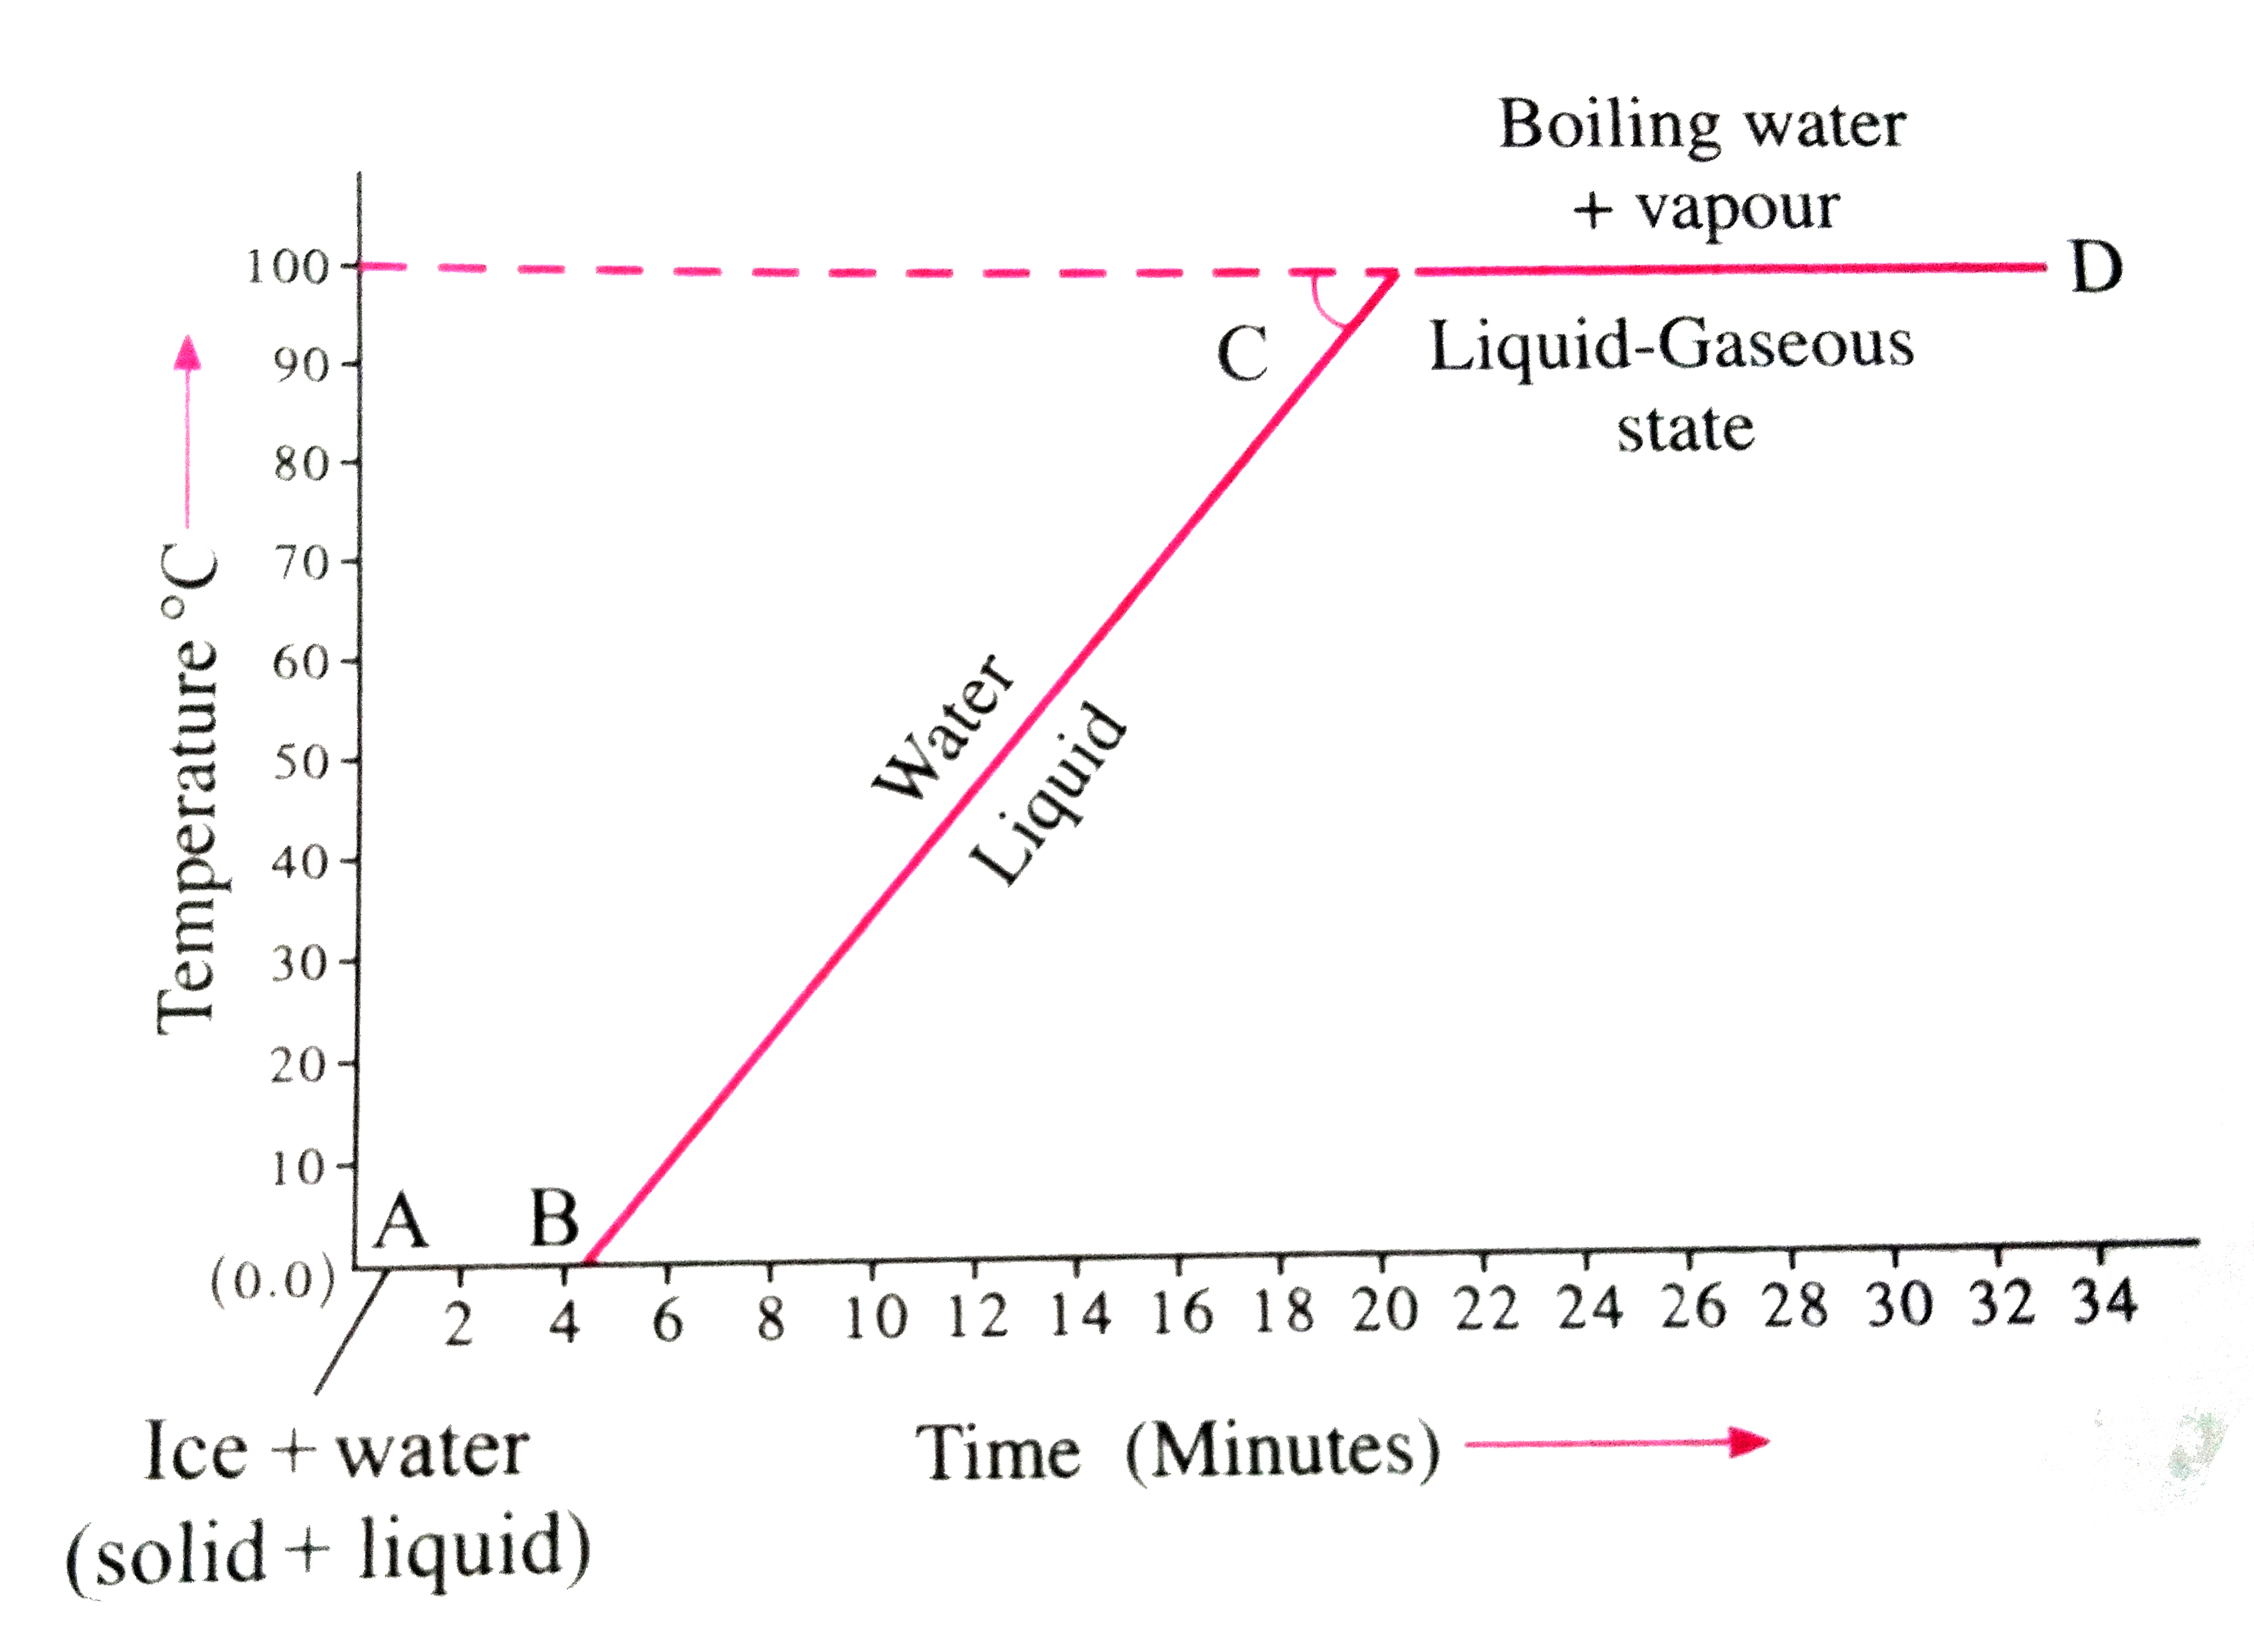
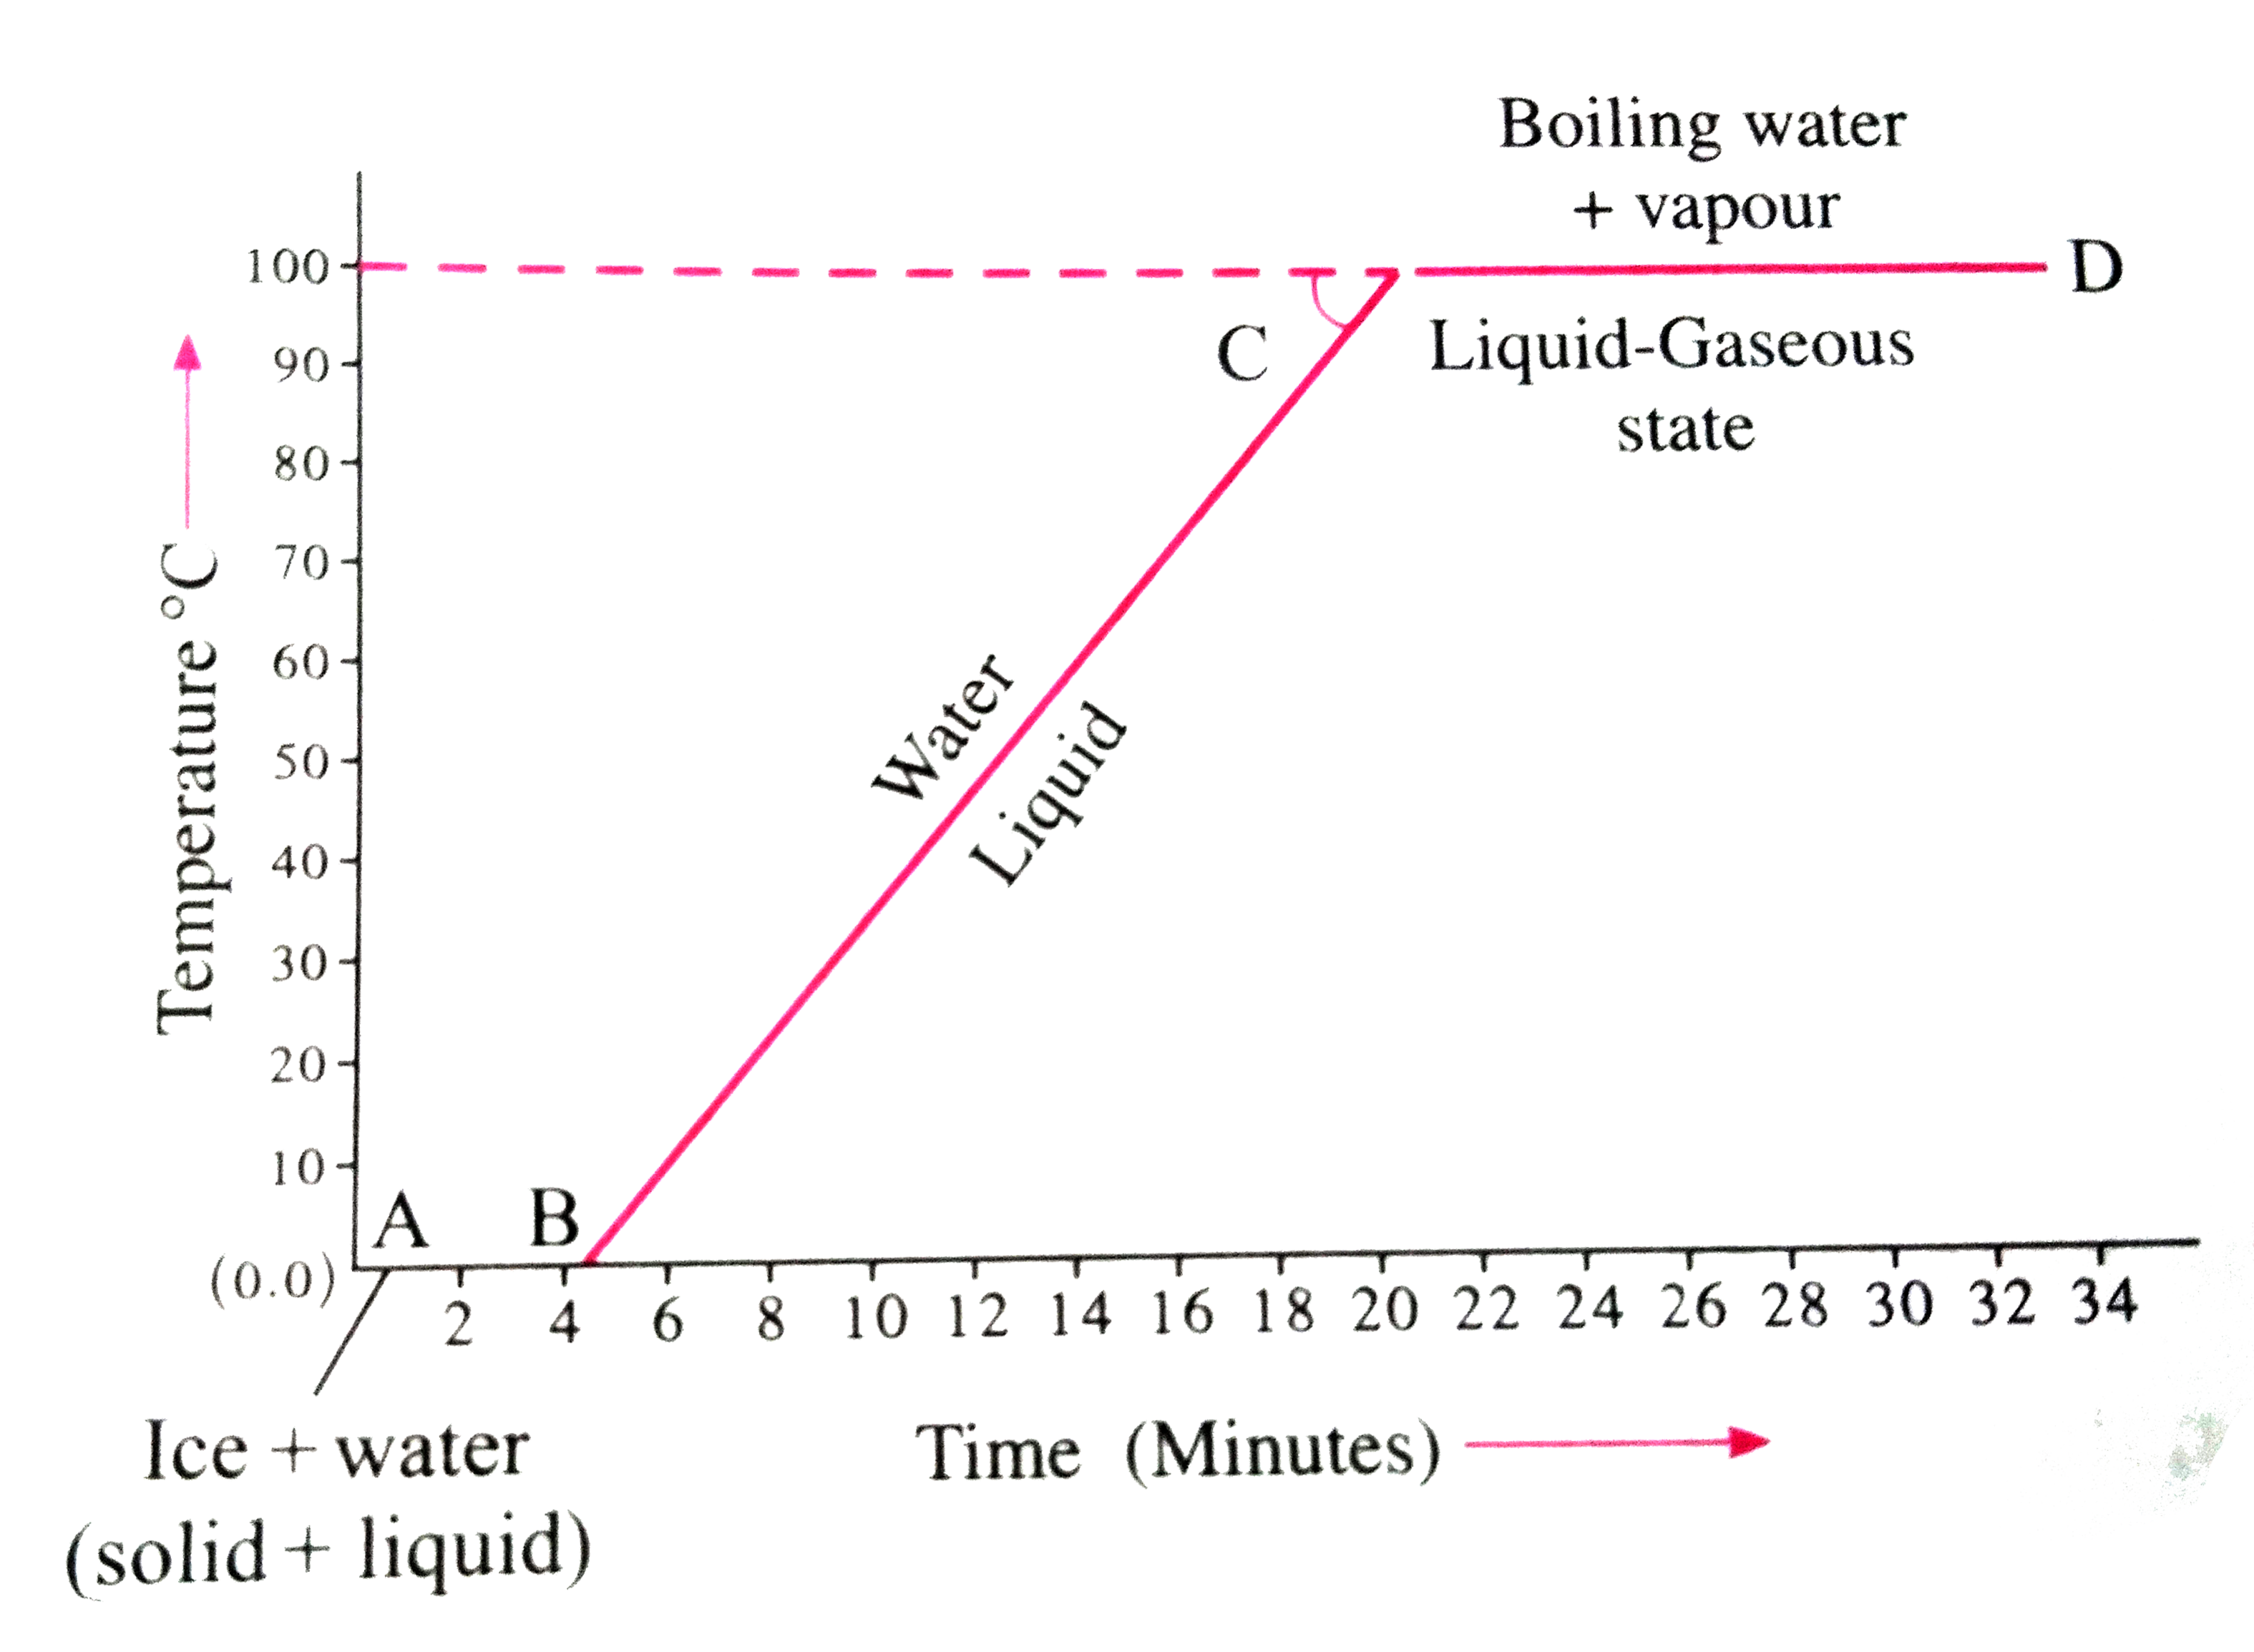
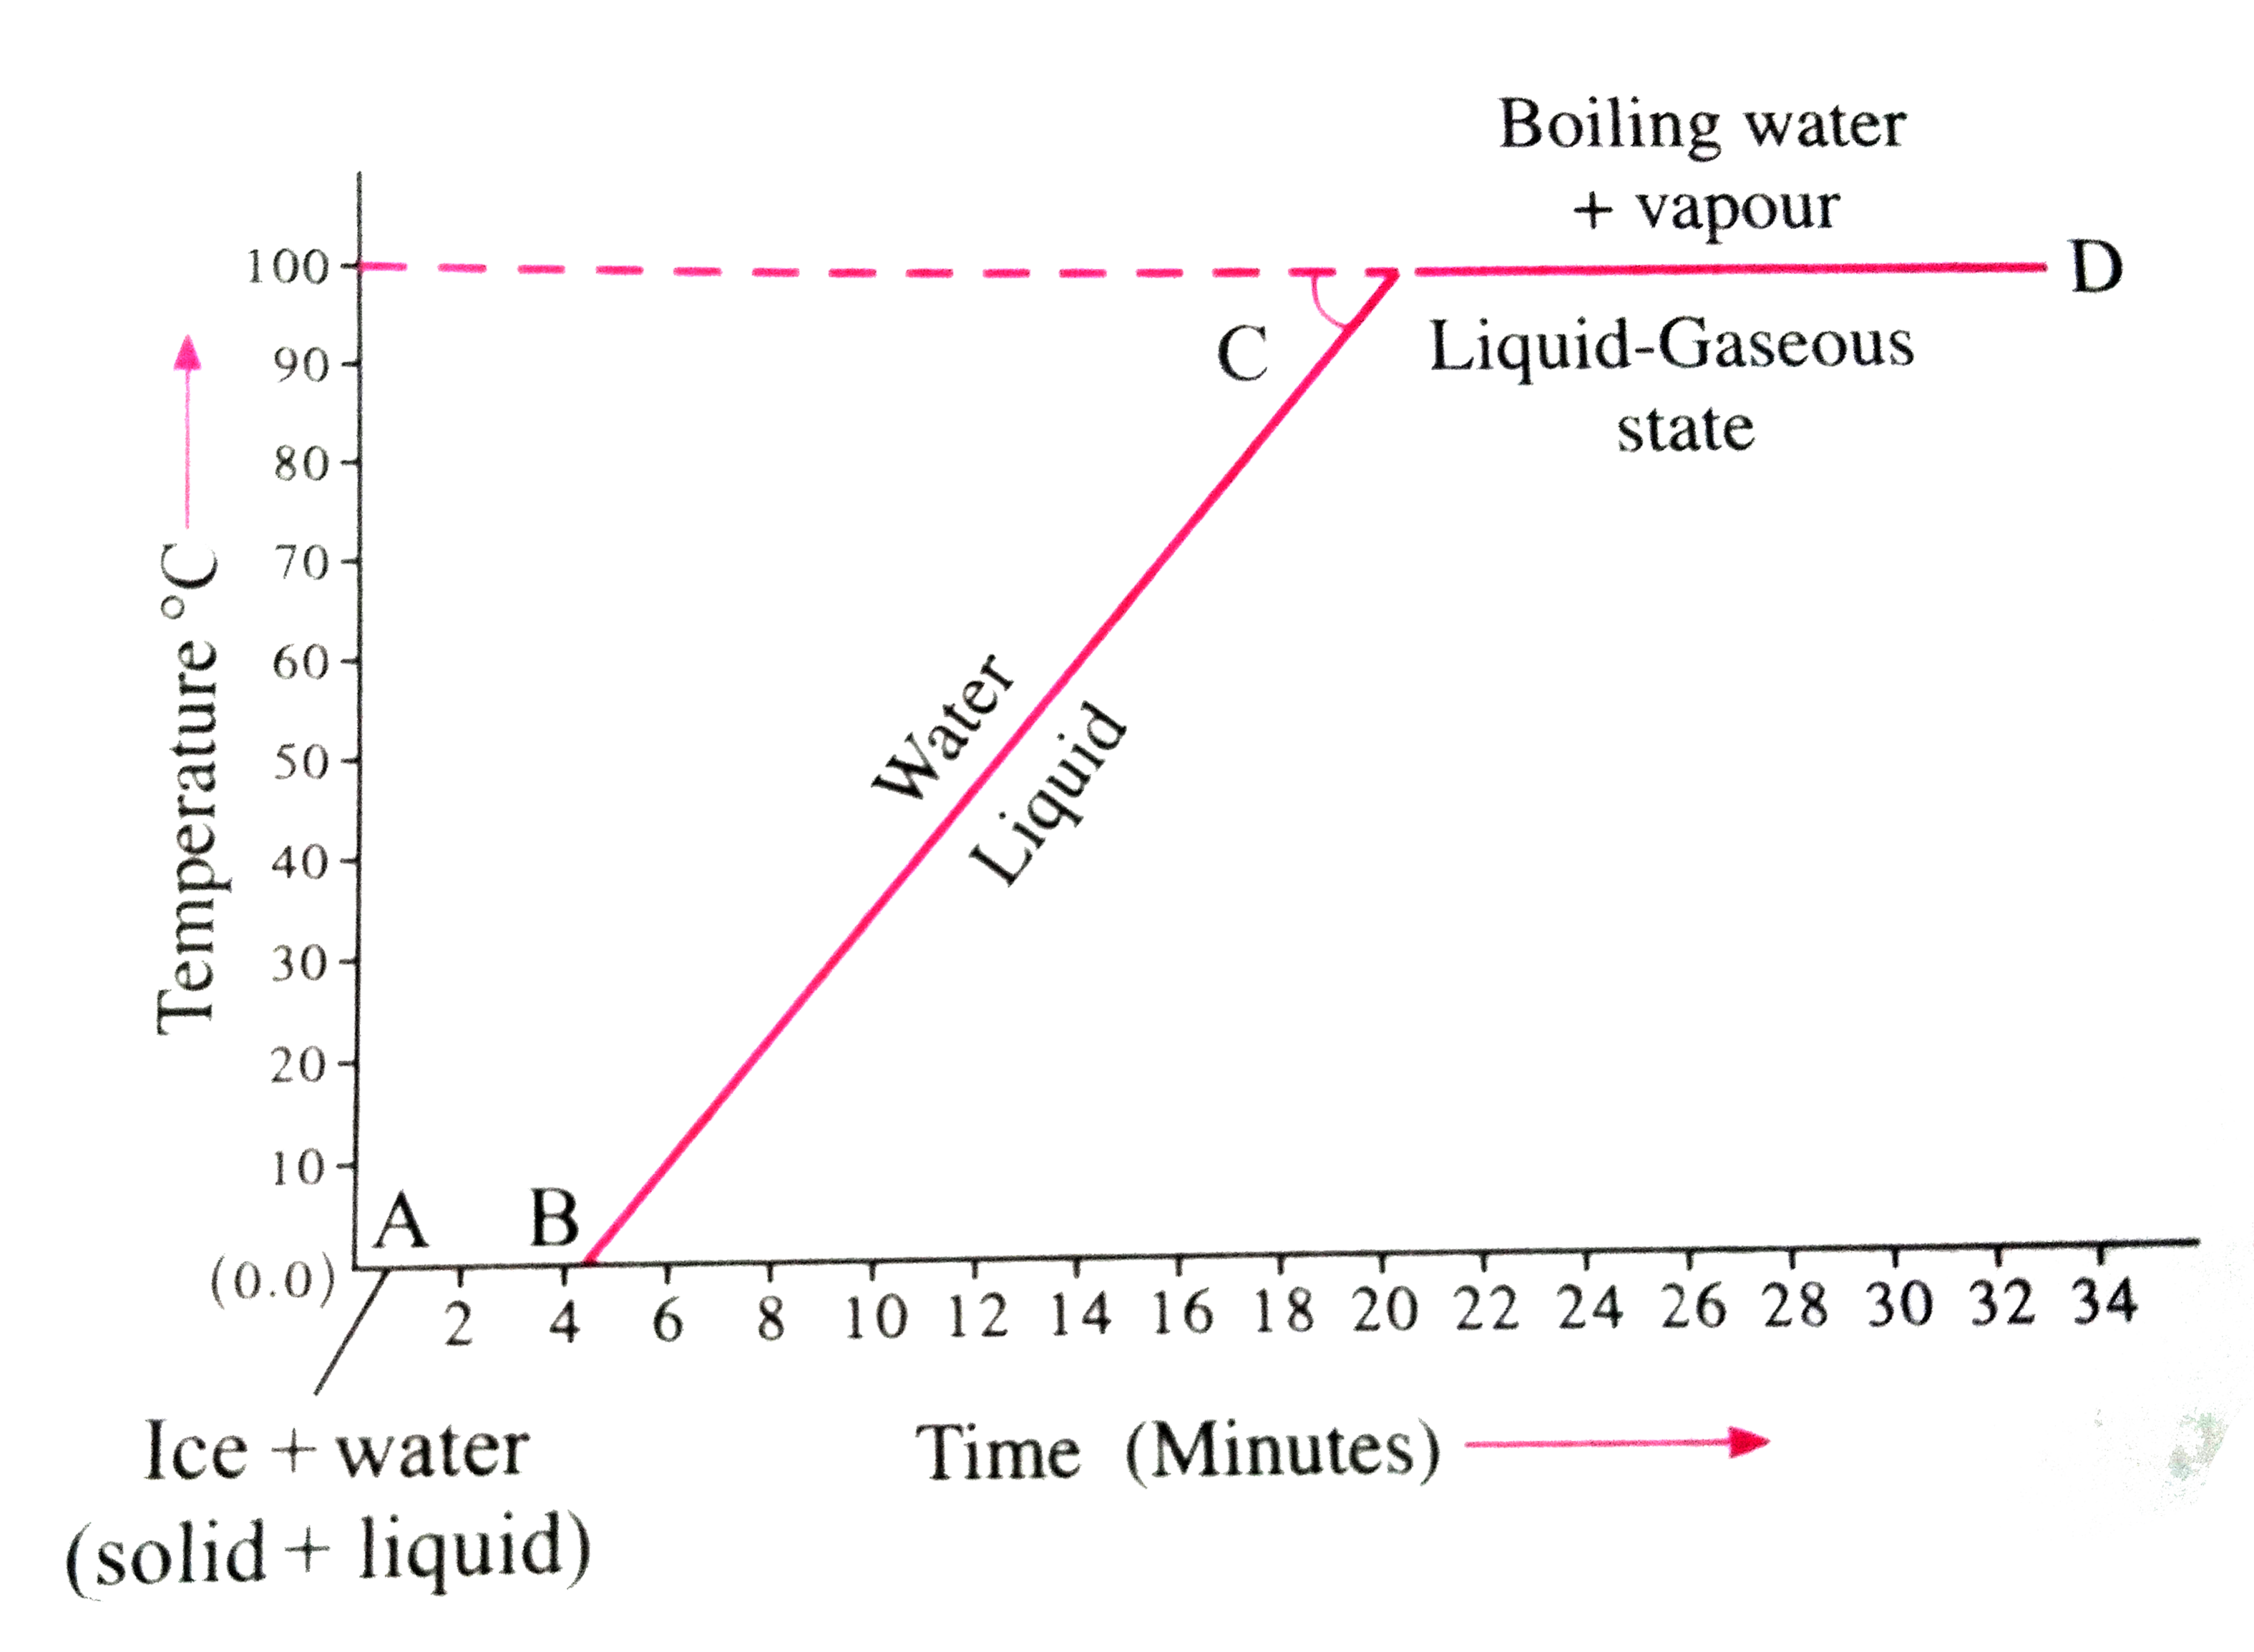
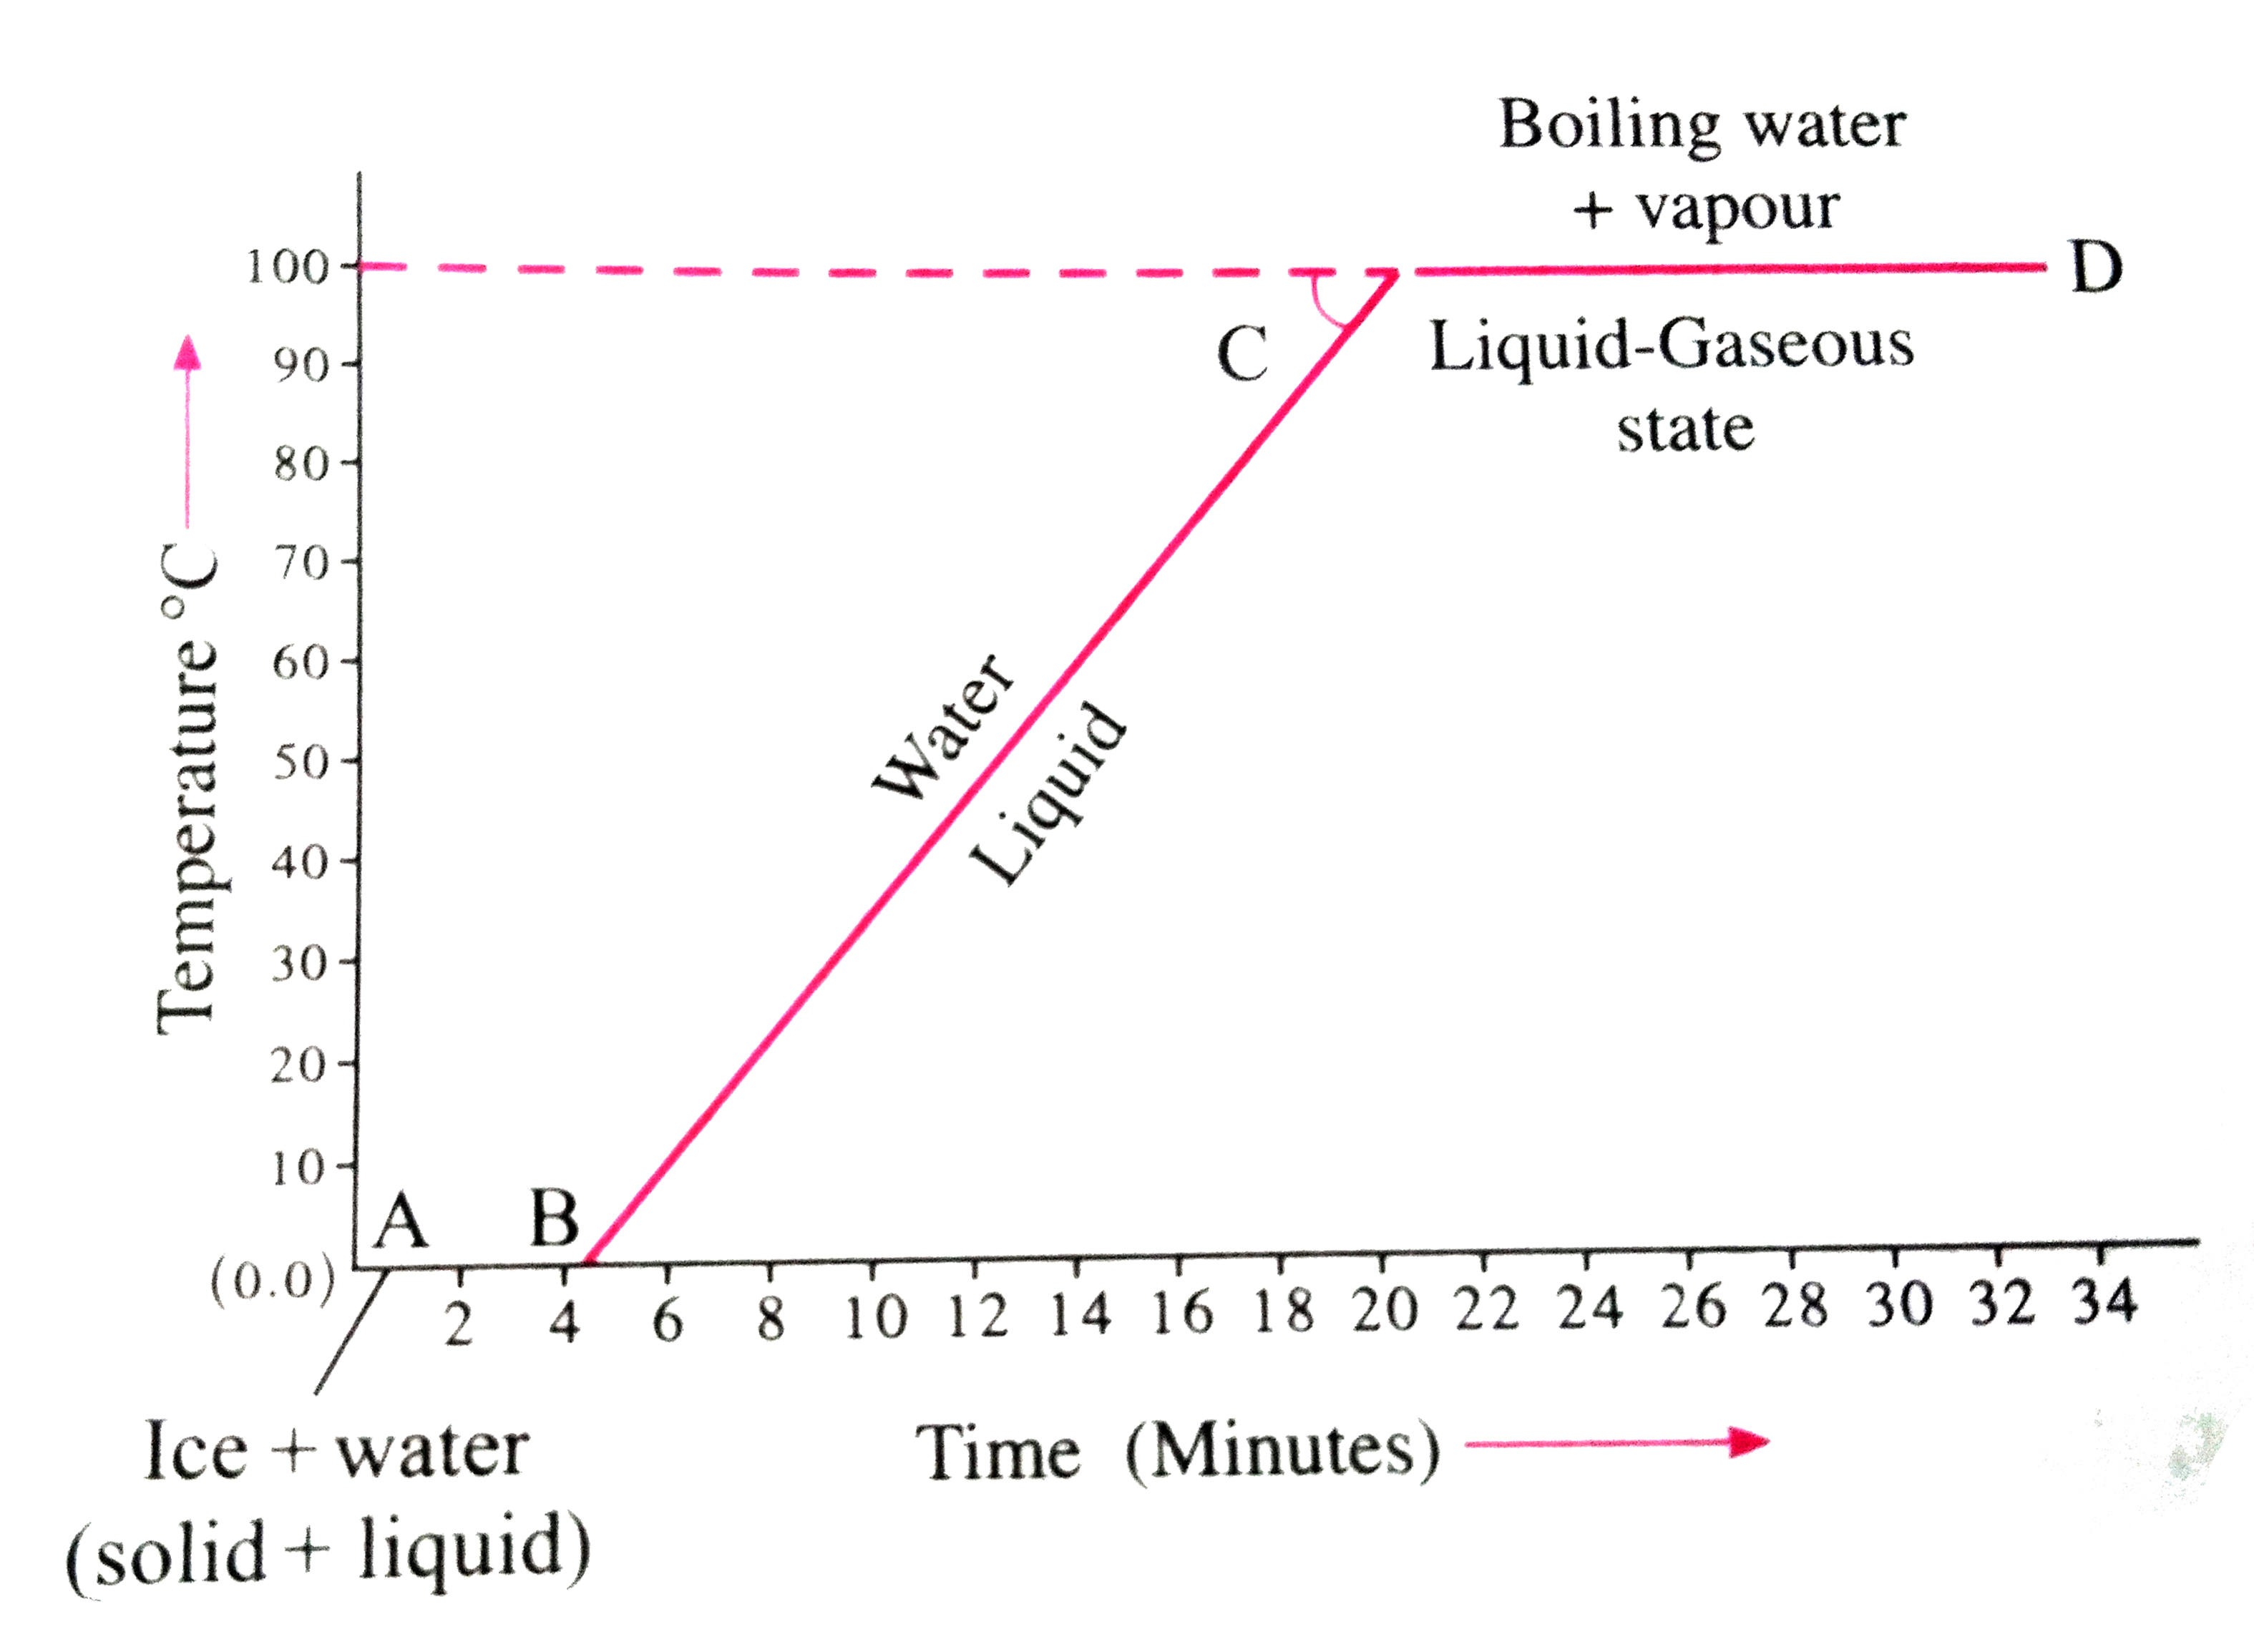
Explain the following temperature vs time graph.
The graphs shows what happens when a mixture of ice and water is heated continuously. The temperature of the mixture remains constant till all the ice melts as shown by the line AB. This temperature is the melting point of ice. On further heating the temperature rises steadily from to as shown by the line BC, At water starts converting into steam. This temperature is the boiling point of water. Further heating does not change the temperature and the conversion water steam continues as shown by the line CD.
Similar Questions
Mercury thermometers can be used to measure temperatures upto
View SolutionInsert the bulb of a thermometer in ice and measure its temperature.
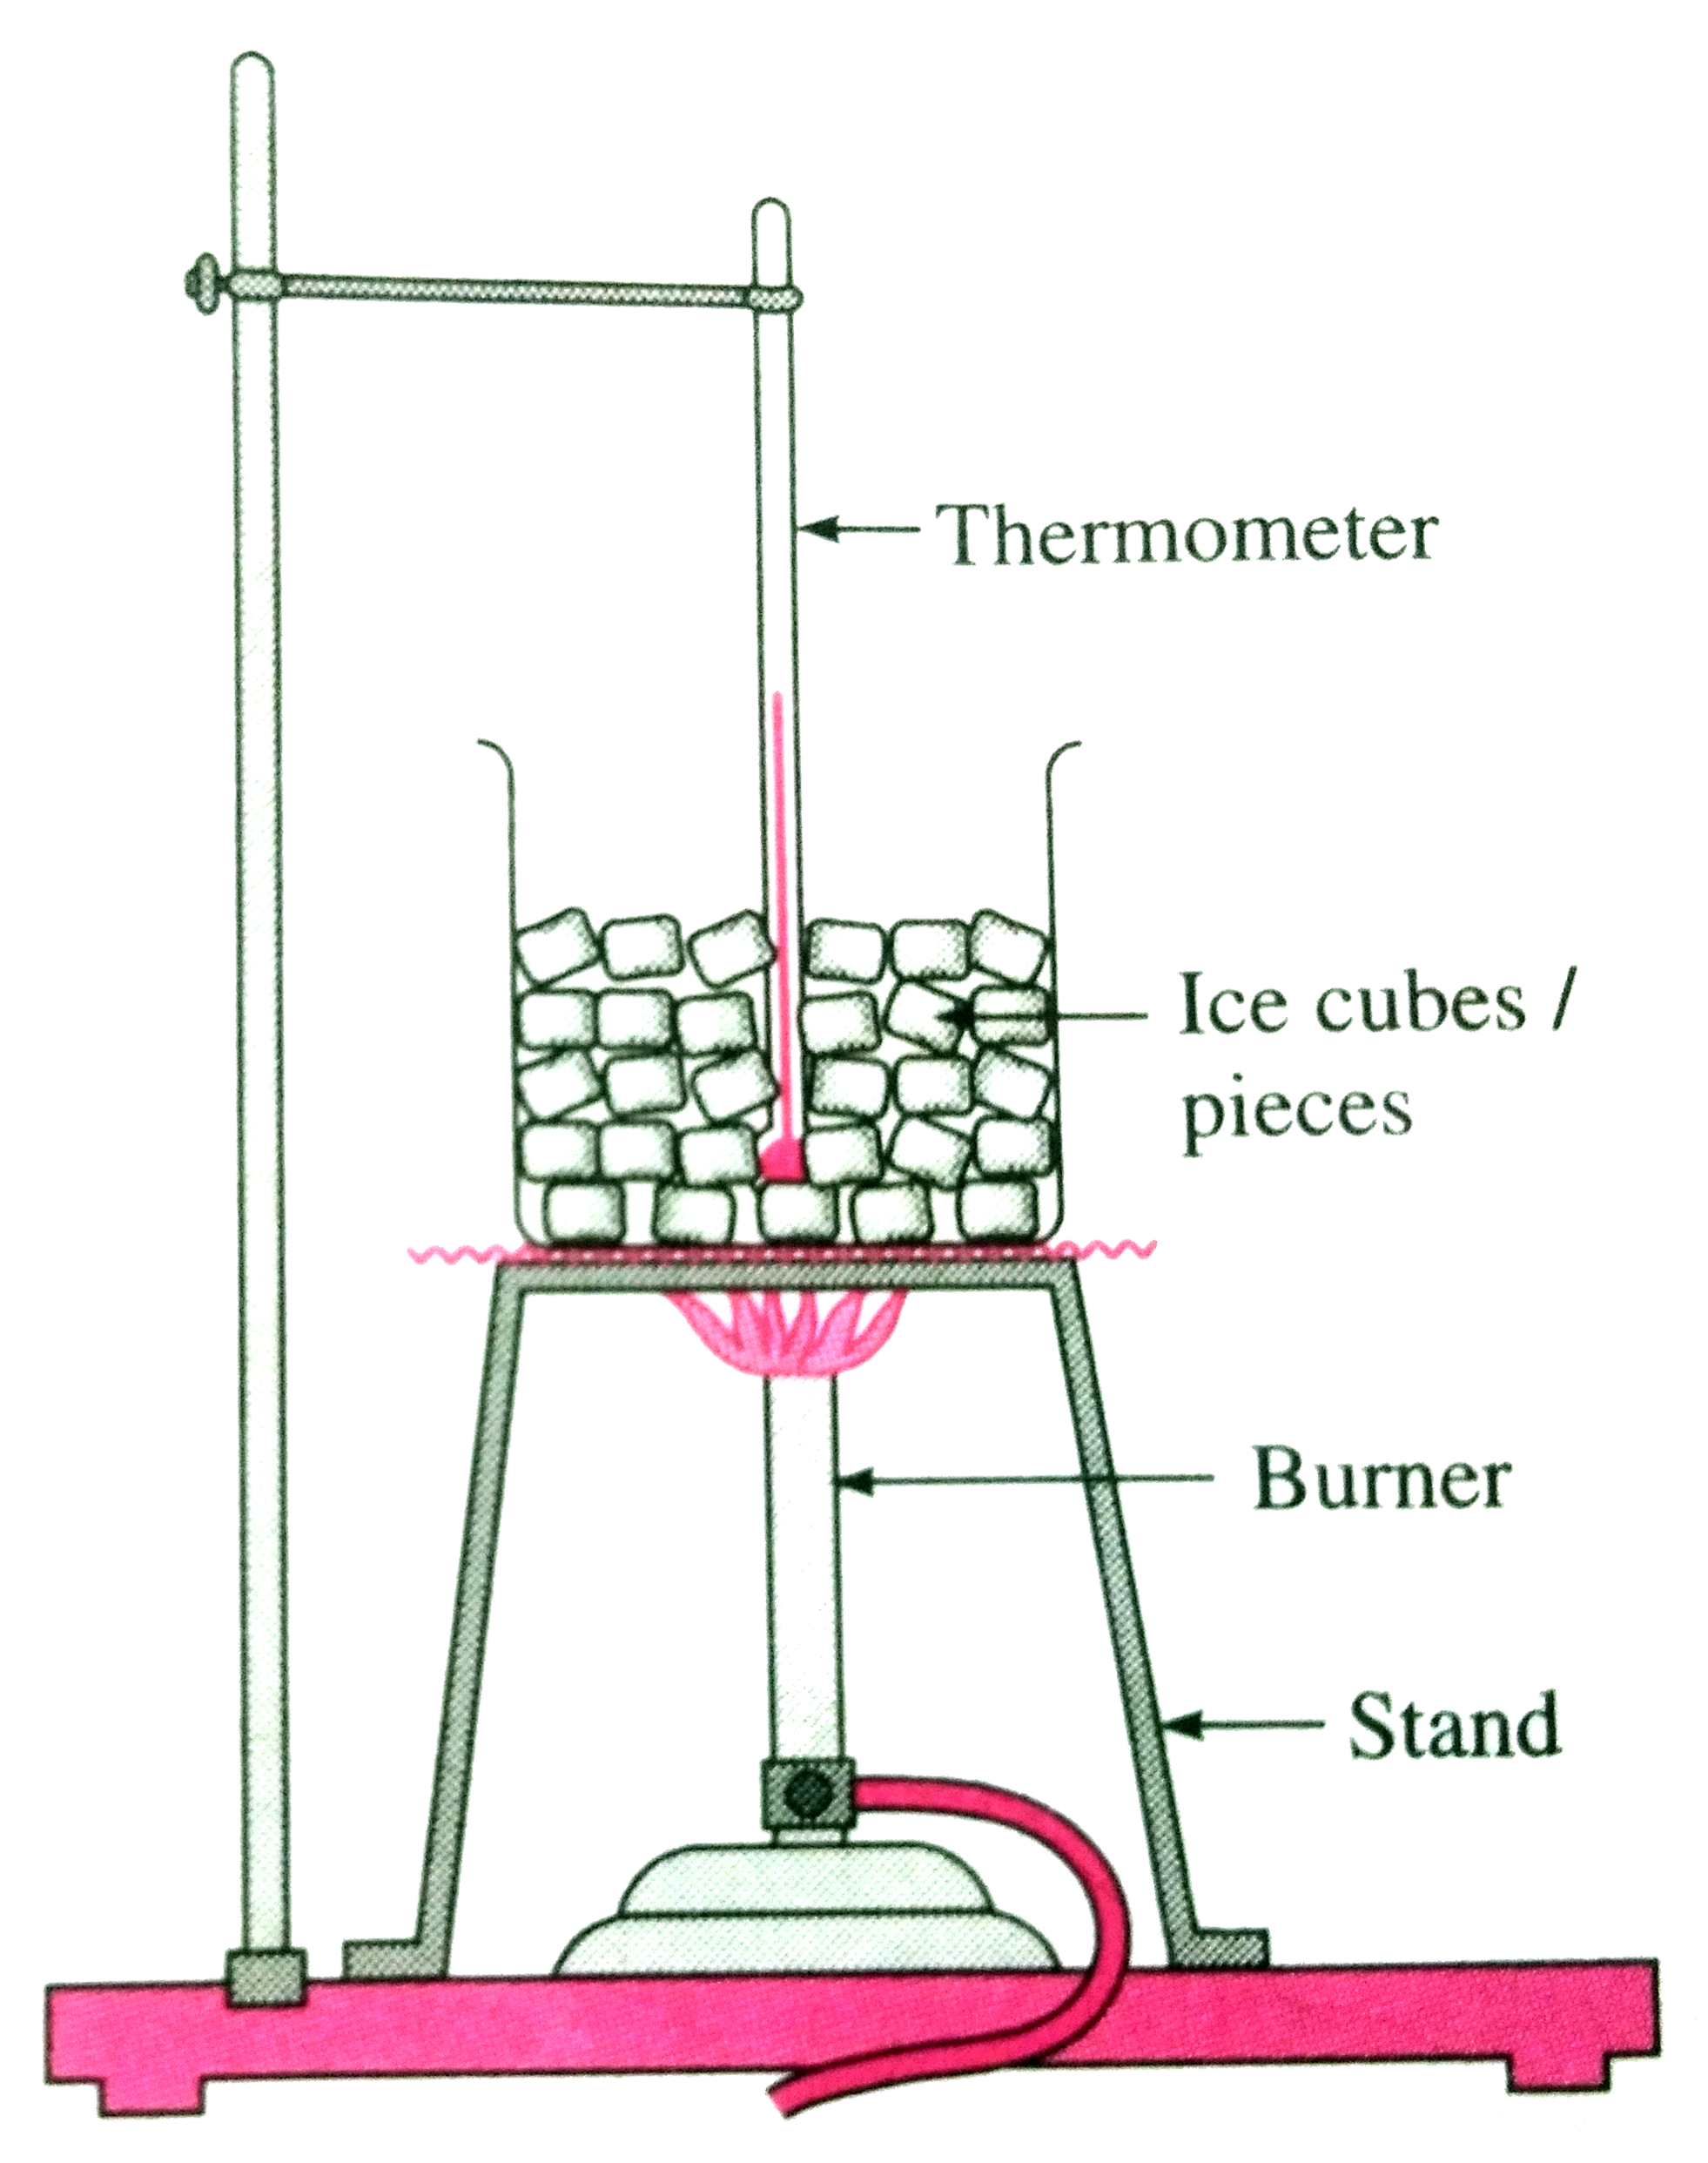
View Solution(1) Take a few pieces of ice in a glass beaker as shown in figure.
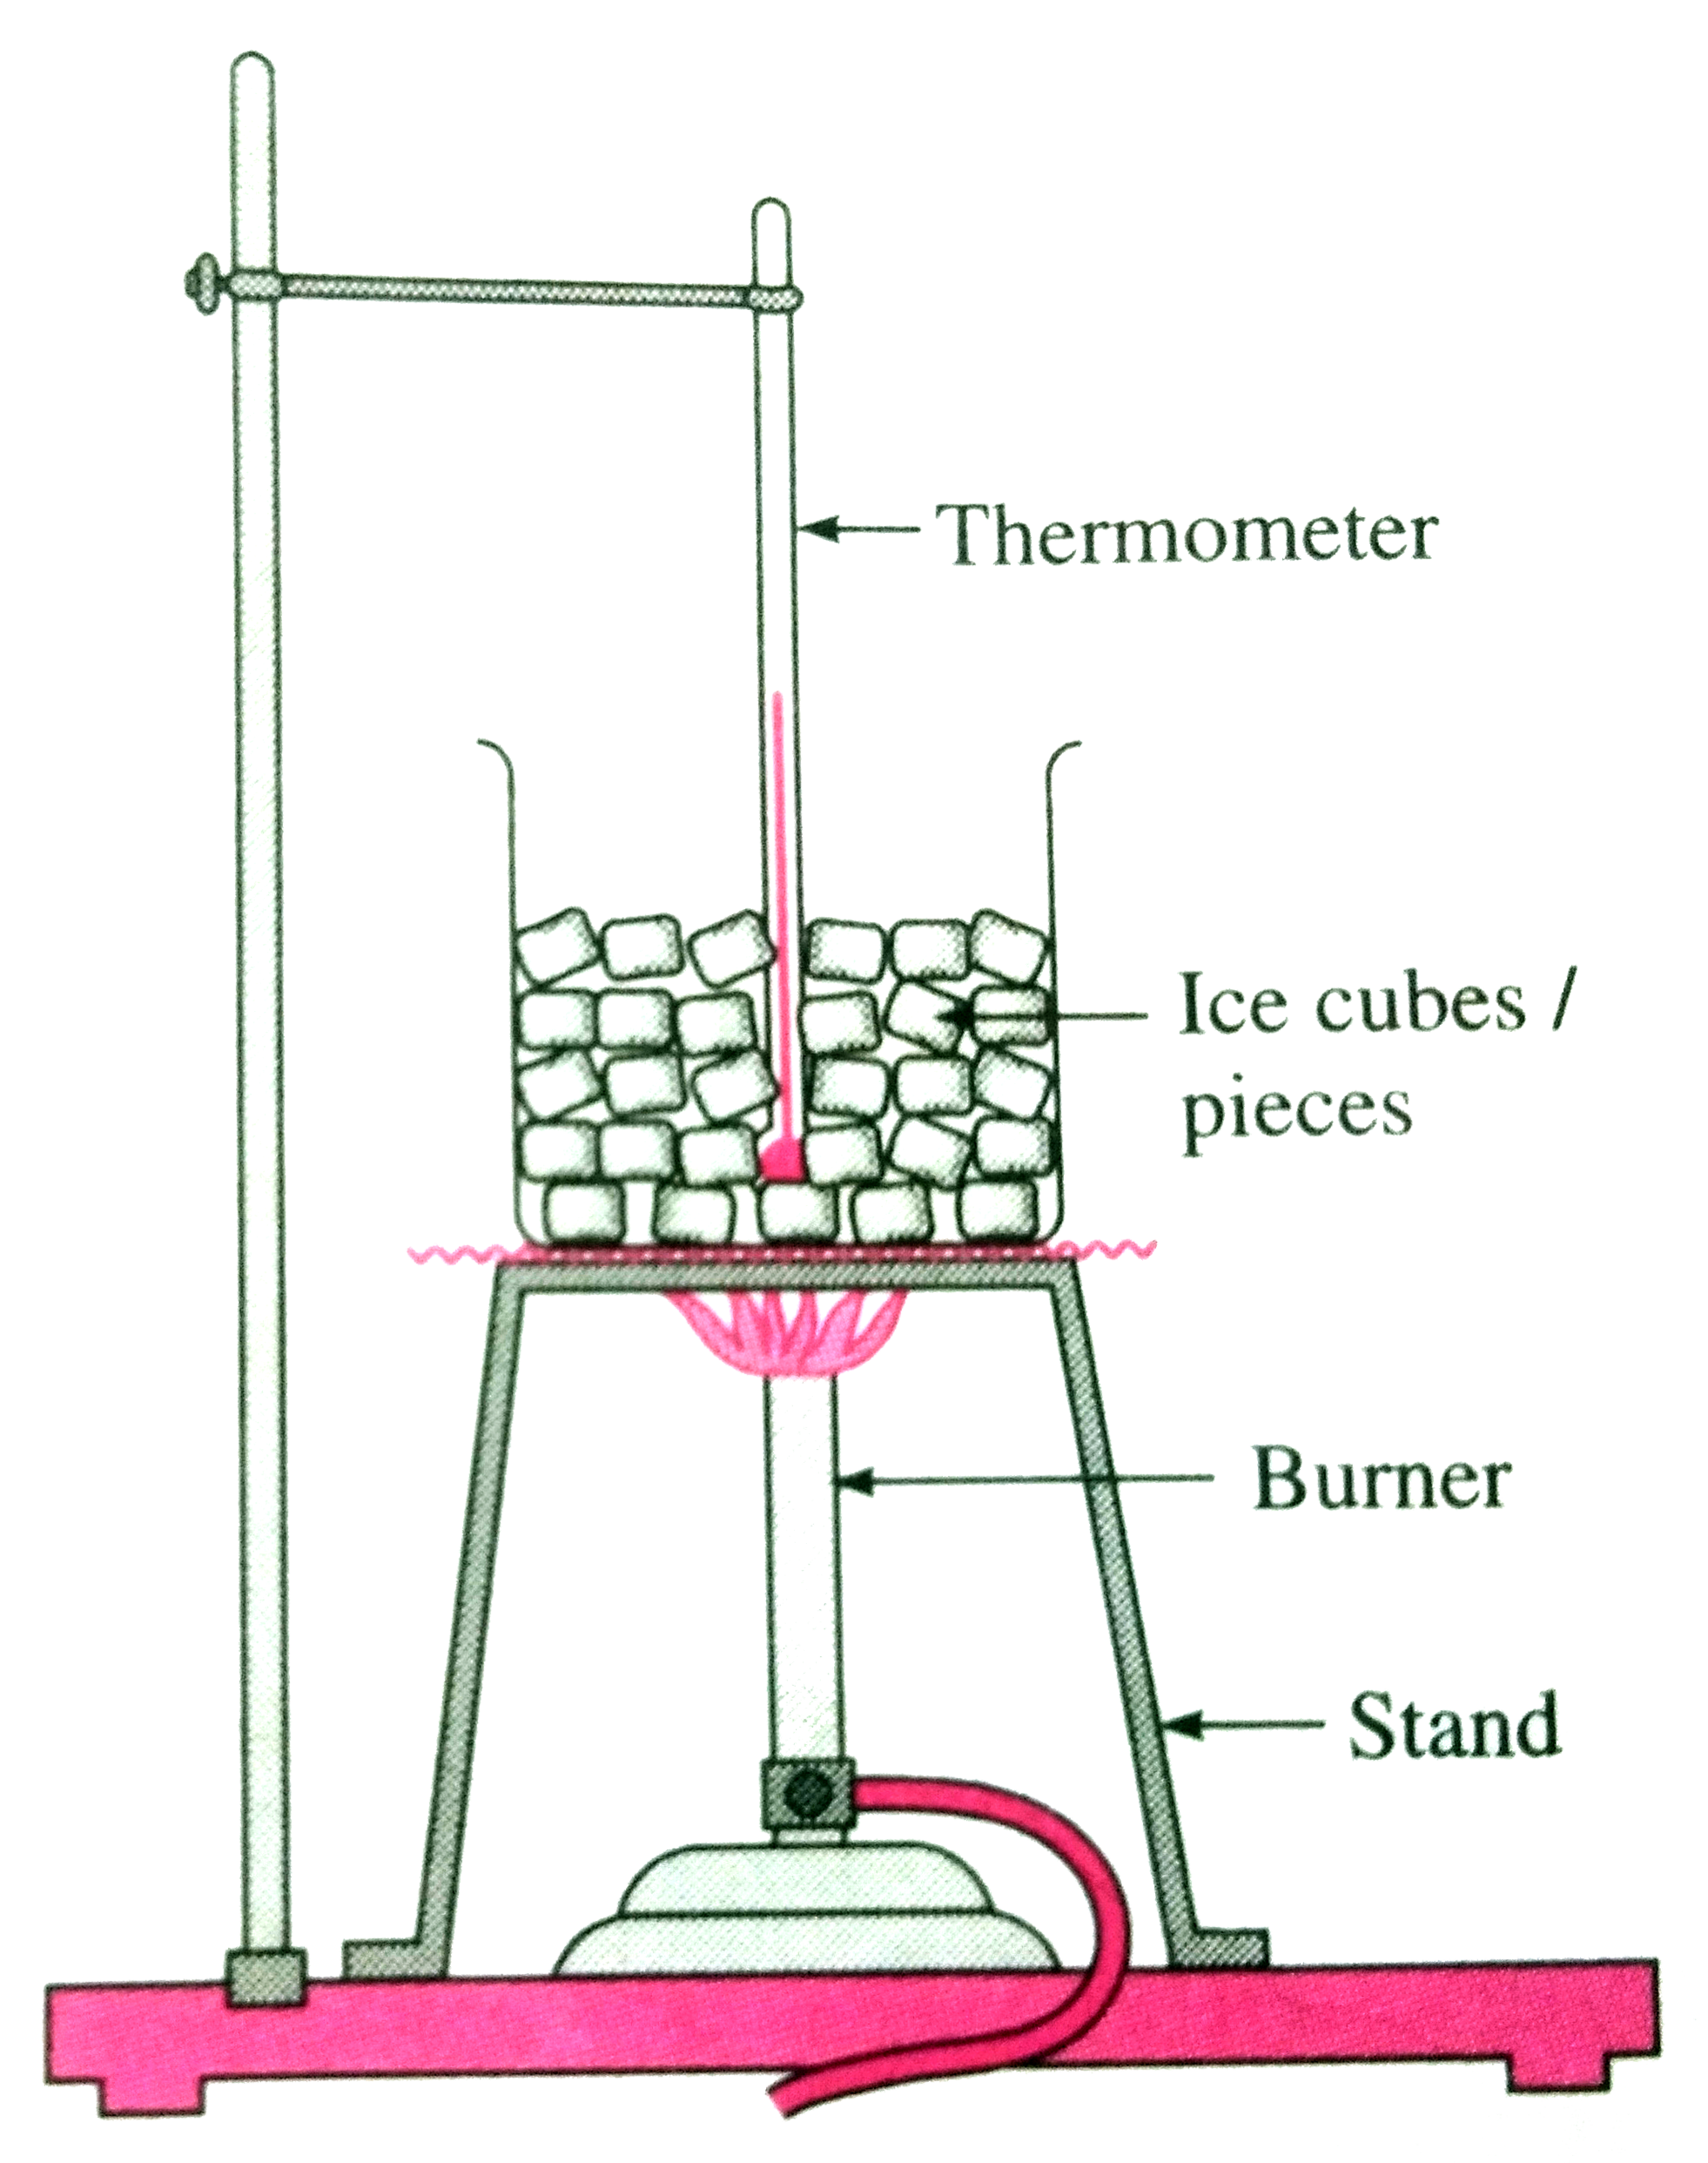
(2) Insert the bulb of a thermometer in ice and measure its temperature.
(3) Put the beaker on a stand and heat the ice using a burner.
(4) Record the temperature using the thermometer after every minute.
(5) As the ice is heated,it starts melting. Stir the mixture of ice and water.
(6) Continue the heating even after ice starts melting.
(7) Draw a graph of temperature versus time.
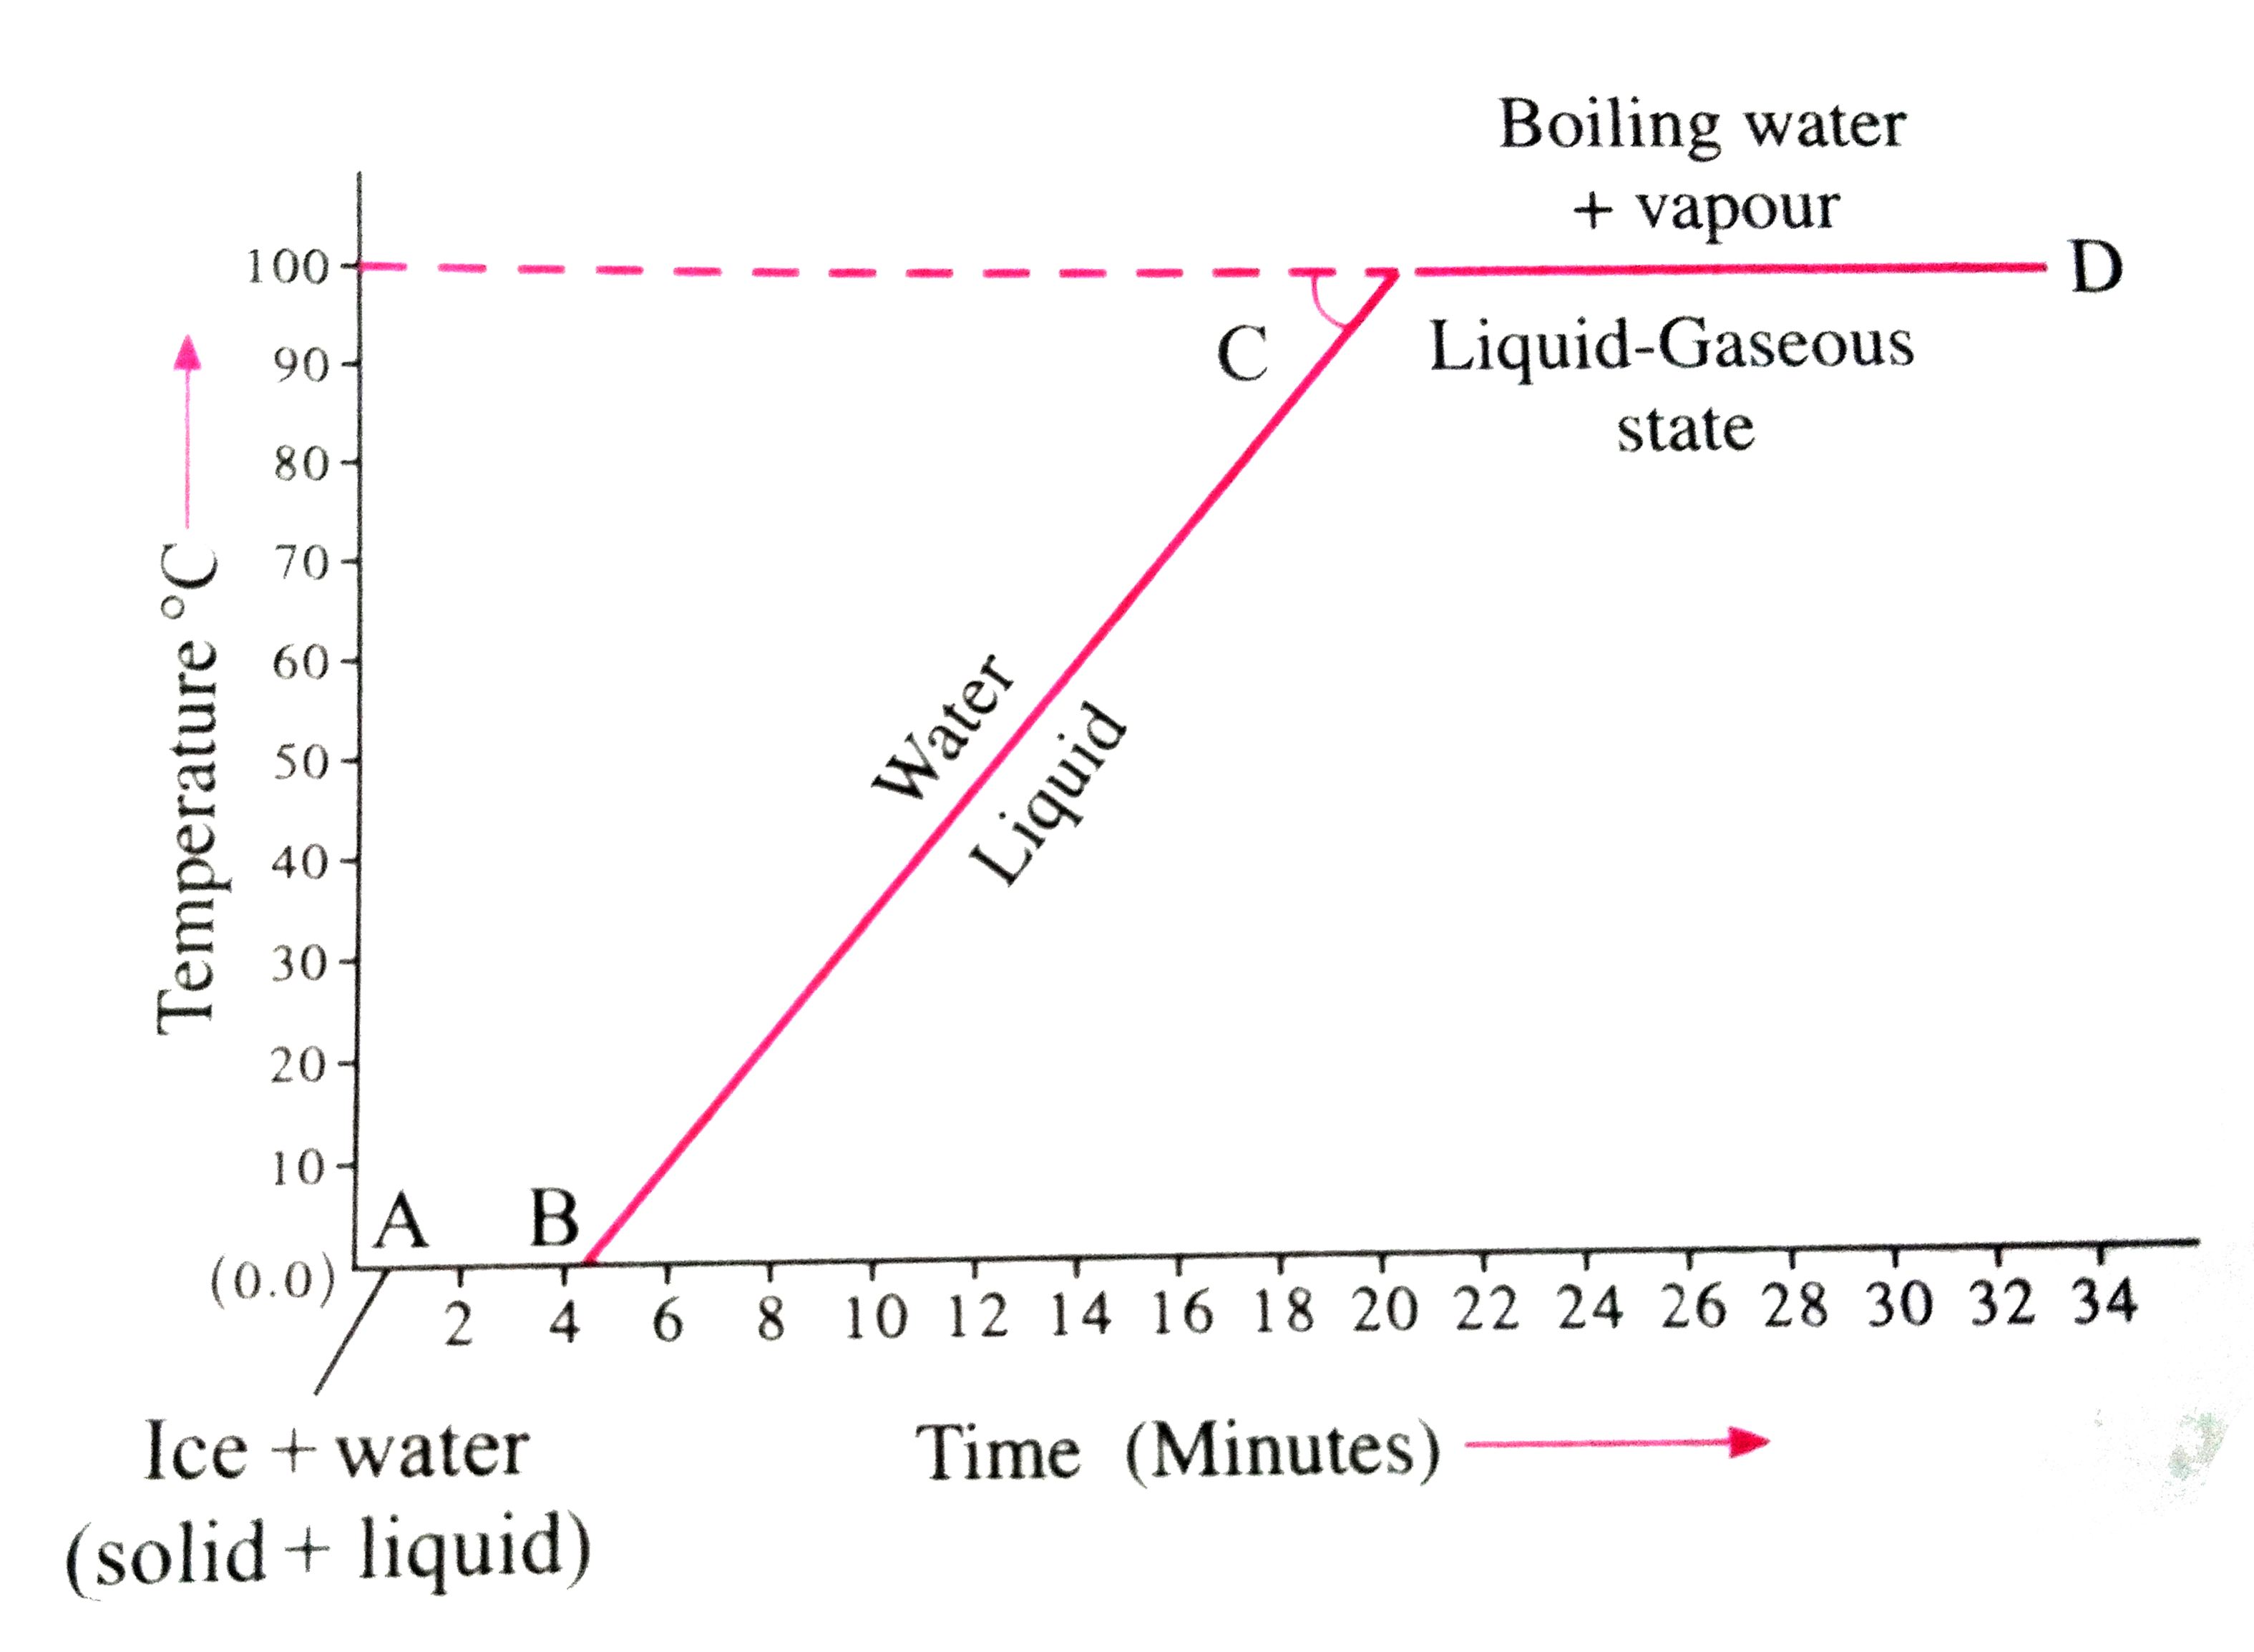
Explain the term latent heat of vaporization.
View Solution(1) Take a few pieces of ice in a glass beaker as shown in figure.
(2) Insert the bulb of a thermometer in ice and measure its temperature.
(3) Put the beaker on a stand and heat the ice using a burner.
(4) Record the temperature using the thermometer after every minute.
(5) As the ice is heated,it starts melting. Stir the mixture of ice and water.
(6) Continue the heating even after ice starts melting.
(7) Draw a graph of temperature versus time.
Explain the role of latent heat in the change of state of a substance.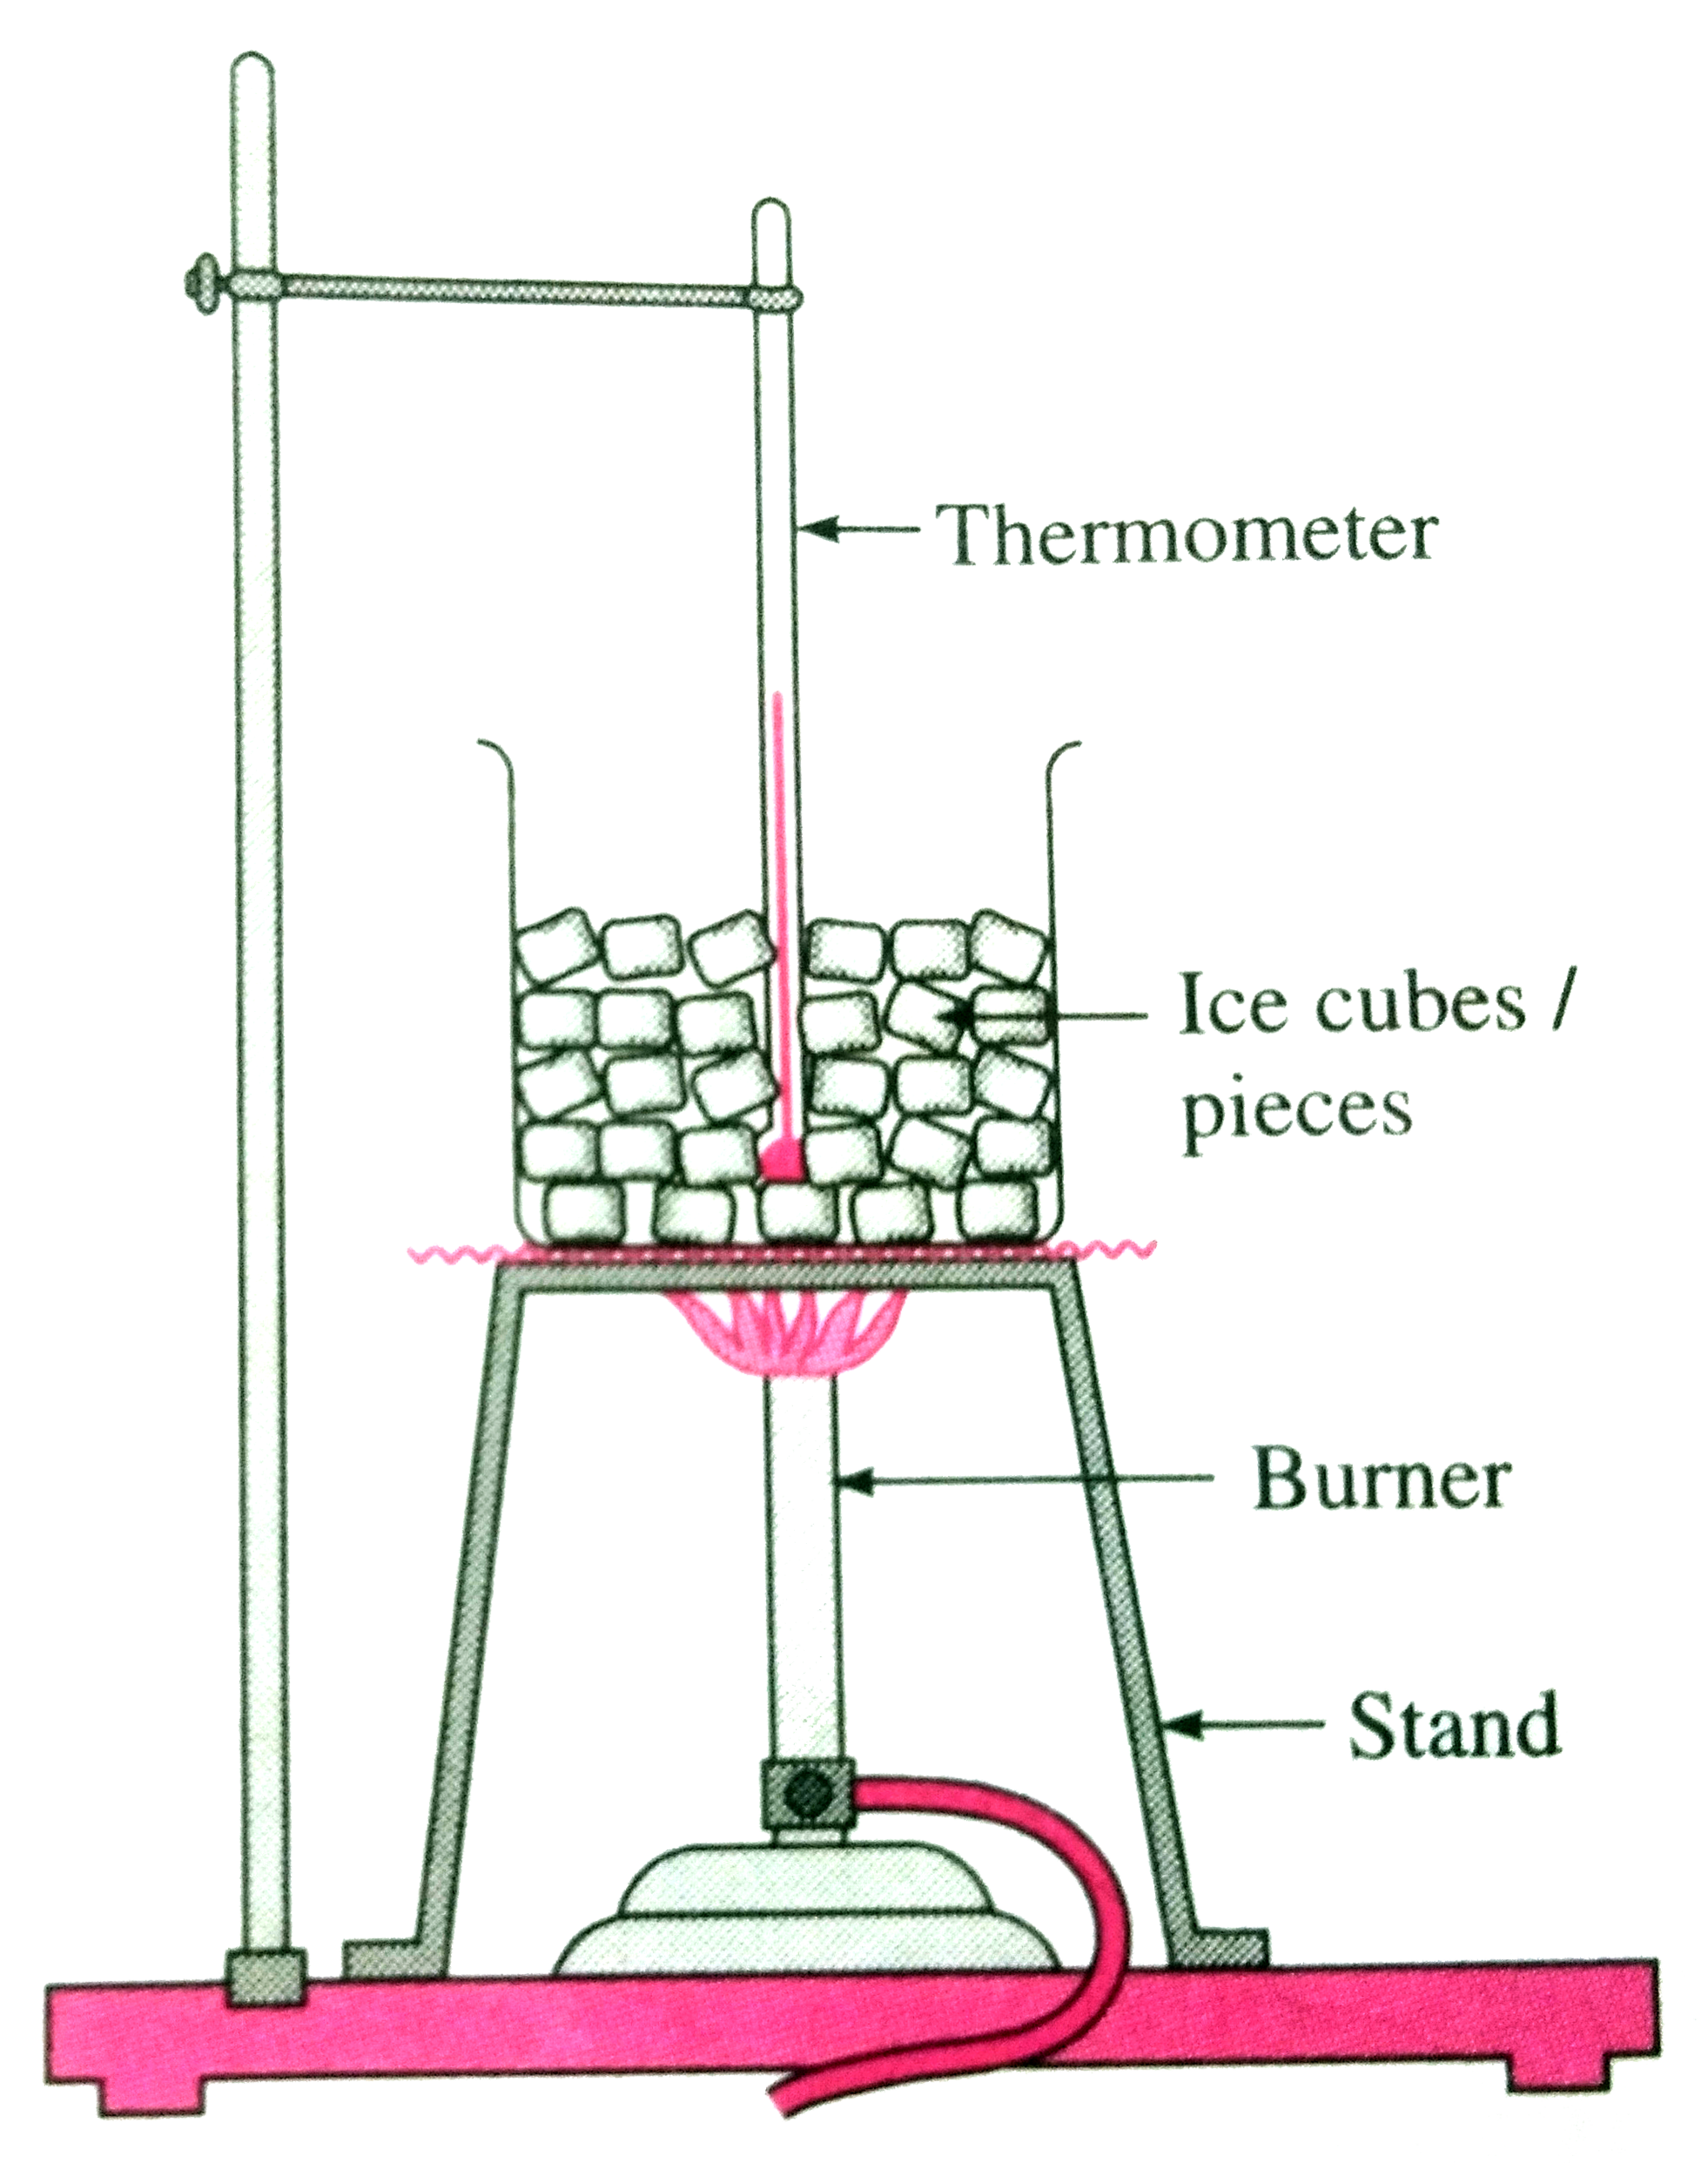
View Solution(1) Take a few pieces of ice in a glass beaker as shown in figure.
(2) Insert the bulb of a thermometer in ice and measure its temperature.
(3) Put the beaker on a stand and heat the ice using a burner.
(4) Record the temperature using the thermometer after every minute.
(5) As the ice is heated,it starts melting. Stir the mixture of ice and water.
(6) Continue the heating even after ice starts melting.
(7) Draw a graph of temperature versus time.
What is meant by latent heat ?How will the state of matter transform if latent heat is given off ?
View Solution(1) Take a few pieces of ice in a glass beaker as shown in figure.
(2) Insert the bulb of a thermometer in ice and measure its temperature.
(3) Put the beaker on a stand and heat the ice using a burner.
(4) Record the temperature using the thermometer after every minute.
(5) As the ice is heated,it starts melting. Stir the mixture of ice and water.
(6) Continue the heating even after ice starts melting.
(7) Draw a graph of temperature versus time.
The specific latent heat of vaporization of water is 540cal/g. Explain this statement.
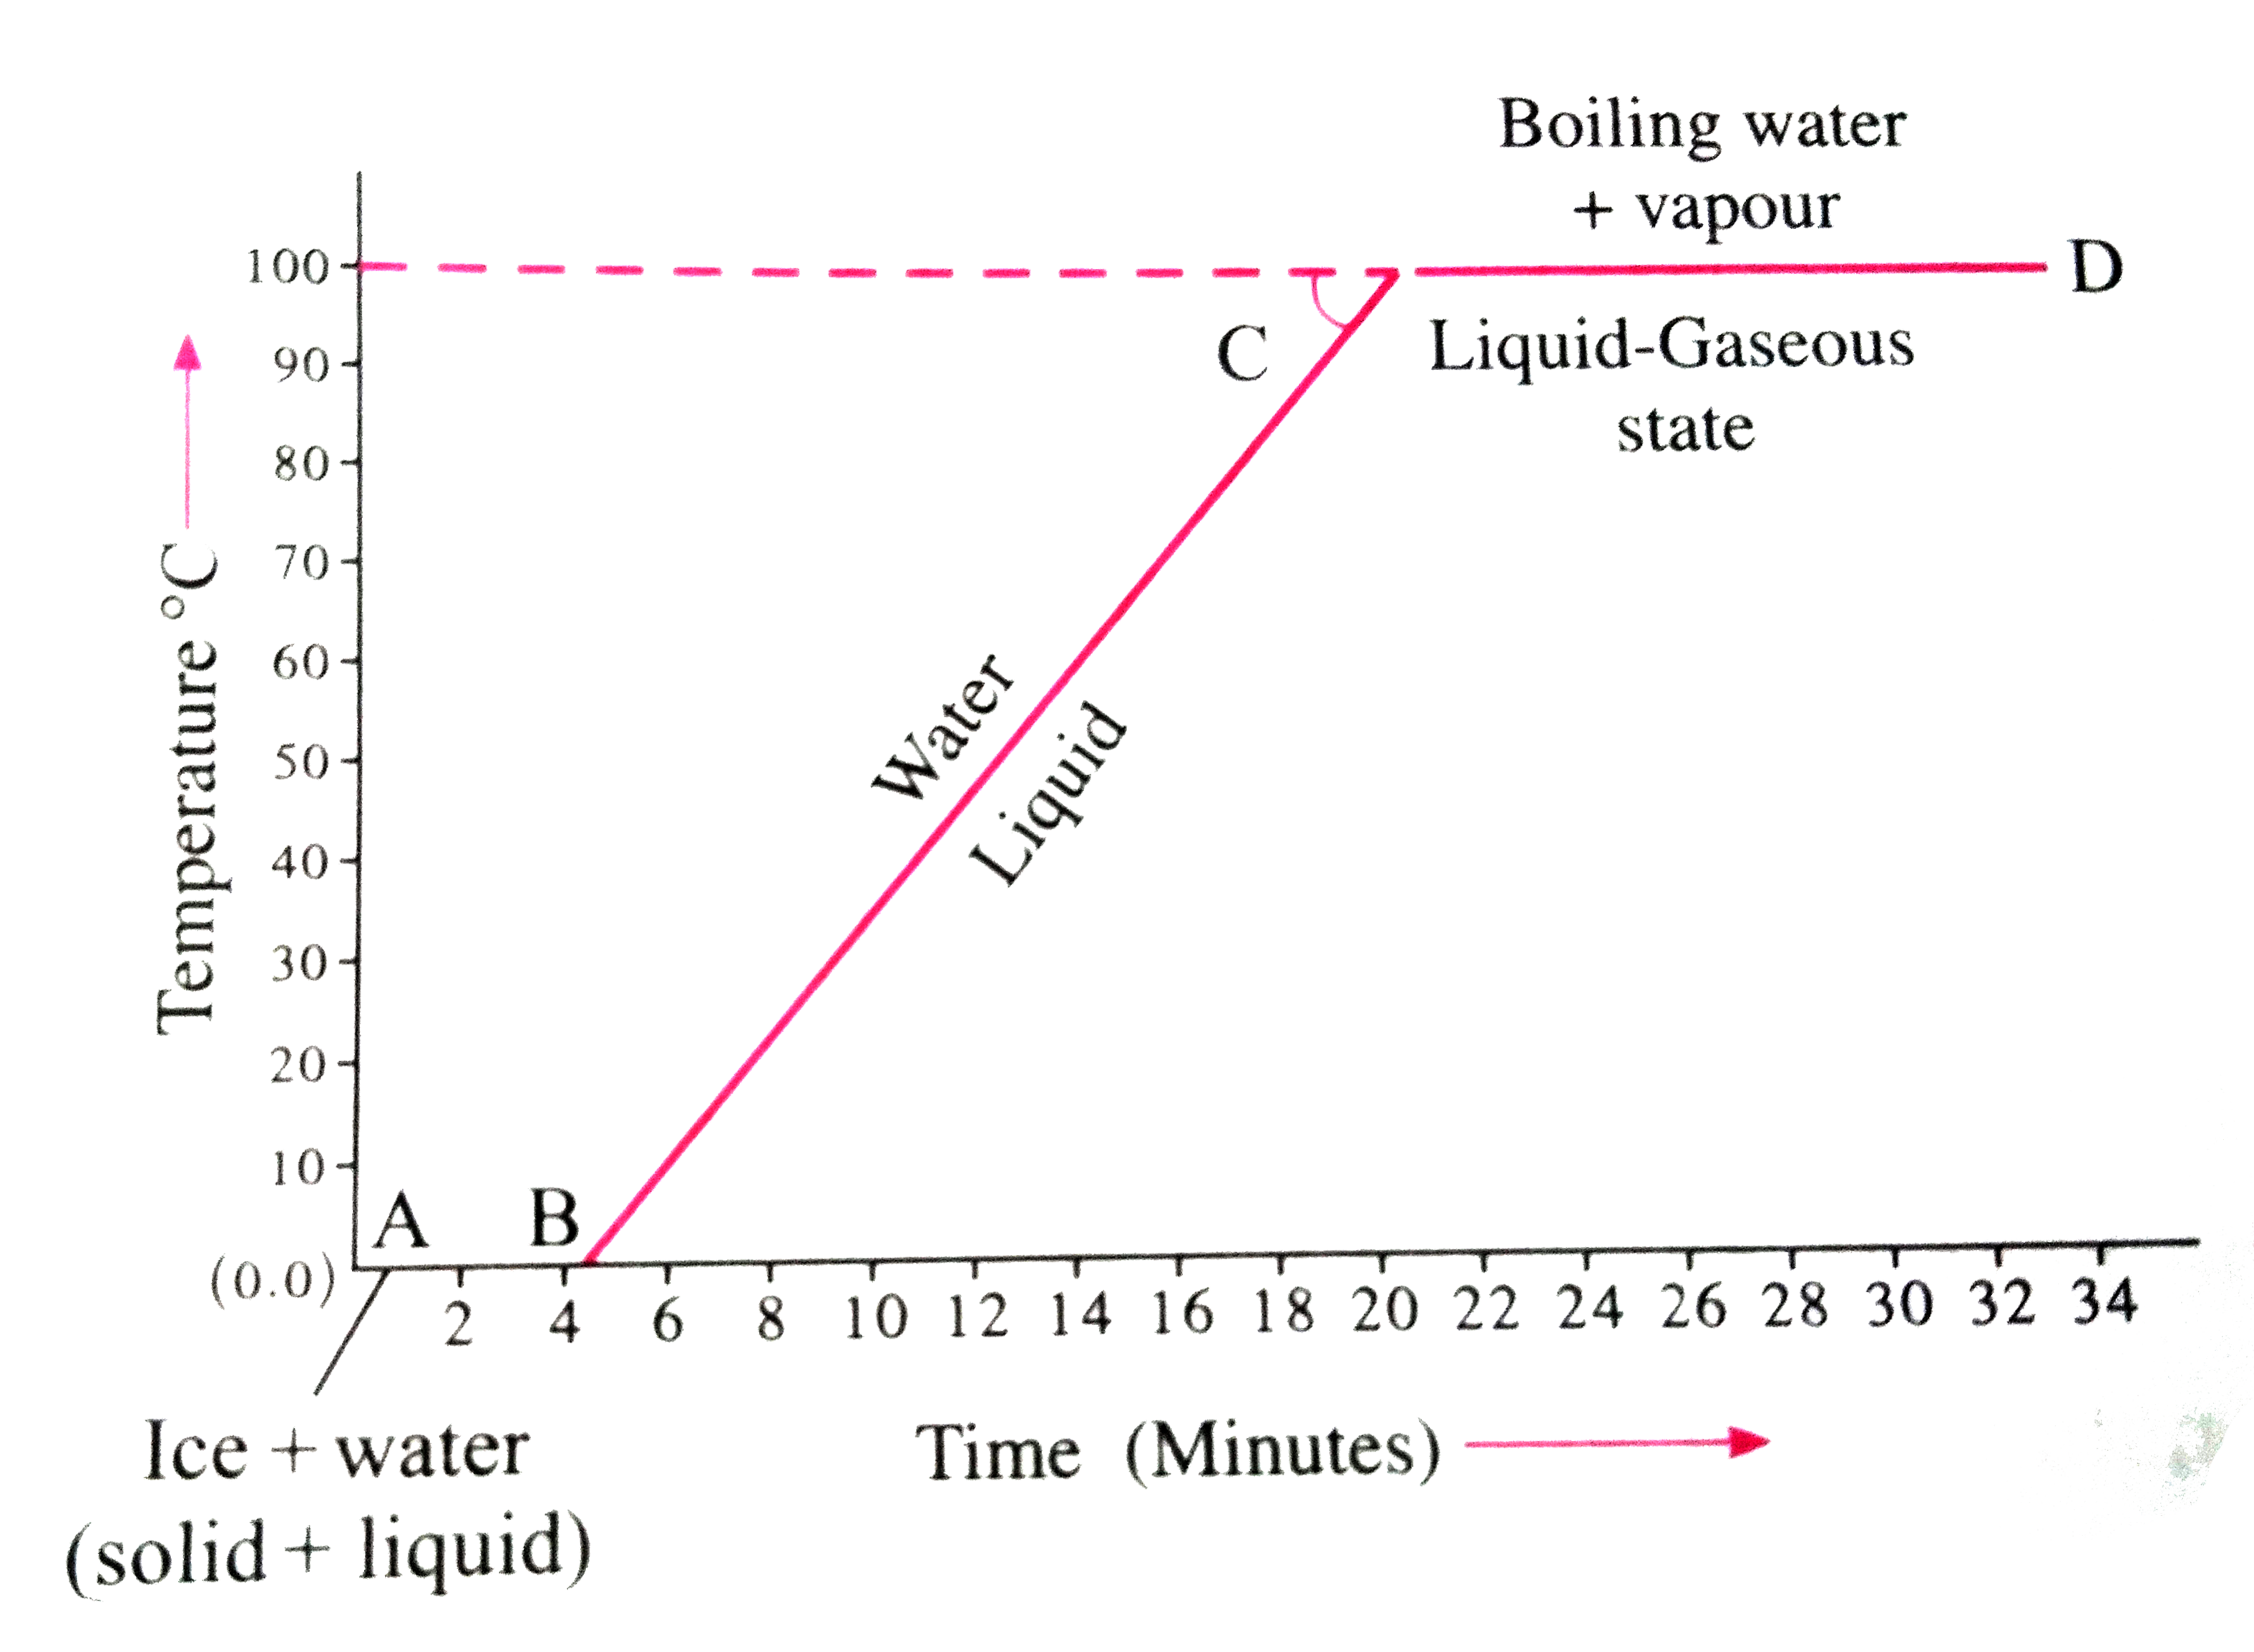
View Solution(1) Take a few pieces of ice in a glass beaker as shown in figure.
(2) Insert the bulb of a thermometer in ice and measure its temperature.
(3) Put the beaker on a stand and heat the ice using a burner.
(4) Record the temperature using the thermometer after every minute.
(5) As the ice is heated,it starts melting. Stir the mixture of ice and water.
(6) Continue the heating even after ice starts melting.
(7) Draw a graph of temperature versus time.
Define boiling point of a liquid. OR What is boiling point of a liquid ?
View Solution(1) Take a few pieces of ice in a glass beaker as shown in figure.
(2) Insert the bulb of a thermometer in ice and measure its temperature.
(3) Put the beaker on a stand and heat the ice using a burner.
(4) Record the temperature using the thermometer after every minute.
(5) As the ice is heated,it starts melting. Stir the mixture of ice and water.
(6) Continue the heating even after ice starts melting.
(7) Draw a graph of temperature versus time.
The specific latent heat of fusion of ice is 80cal/g .Explain this statement .
View Solution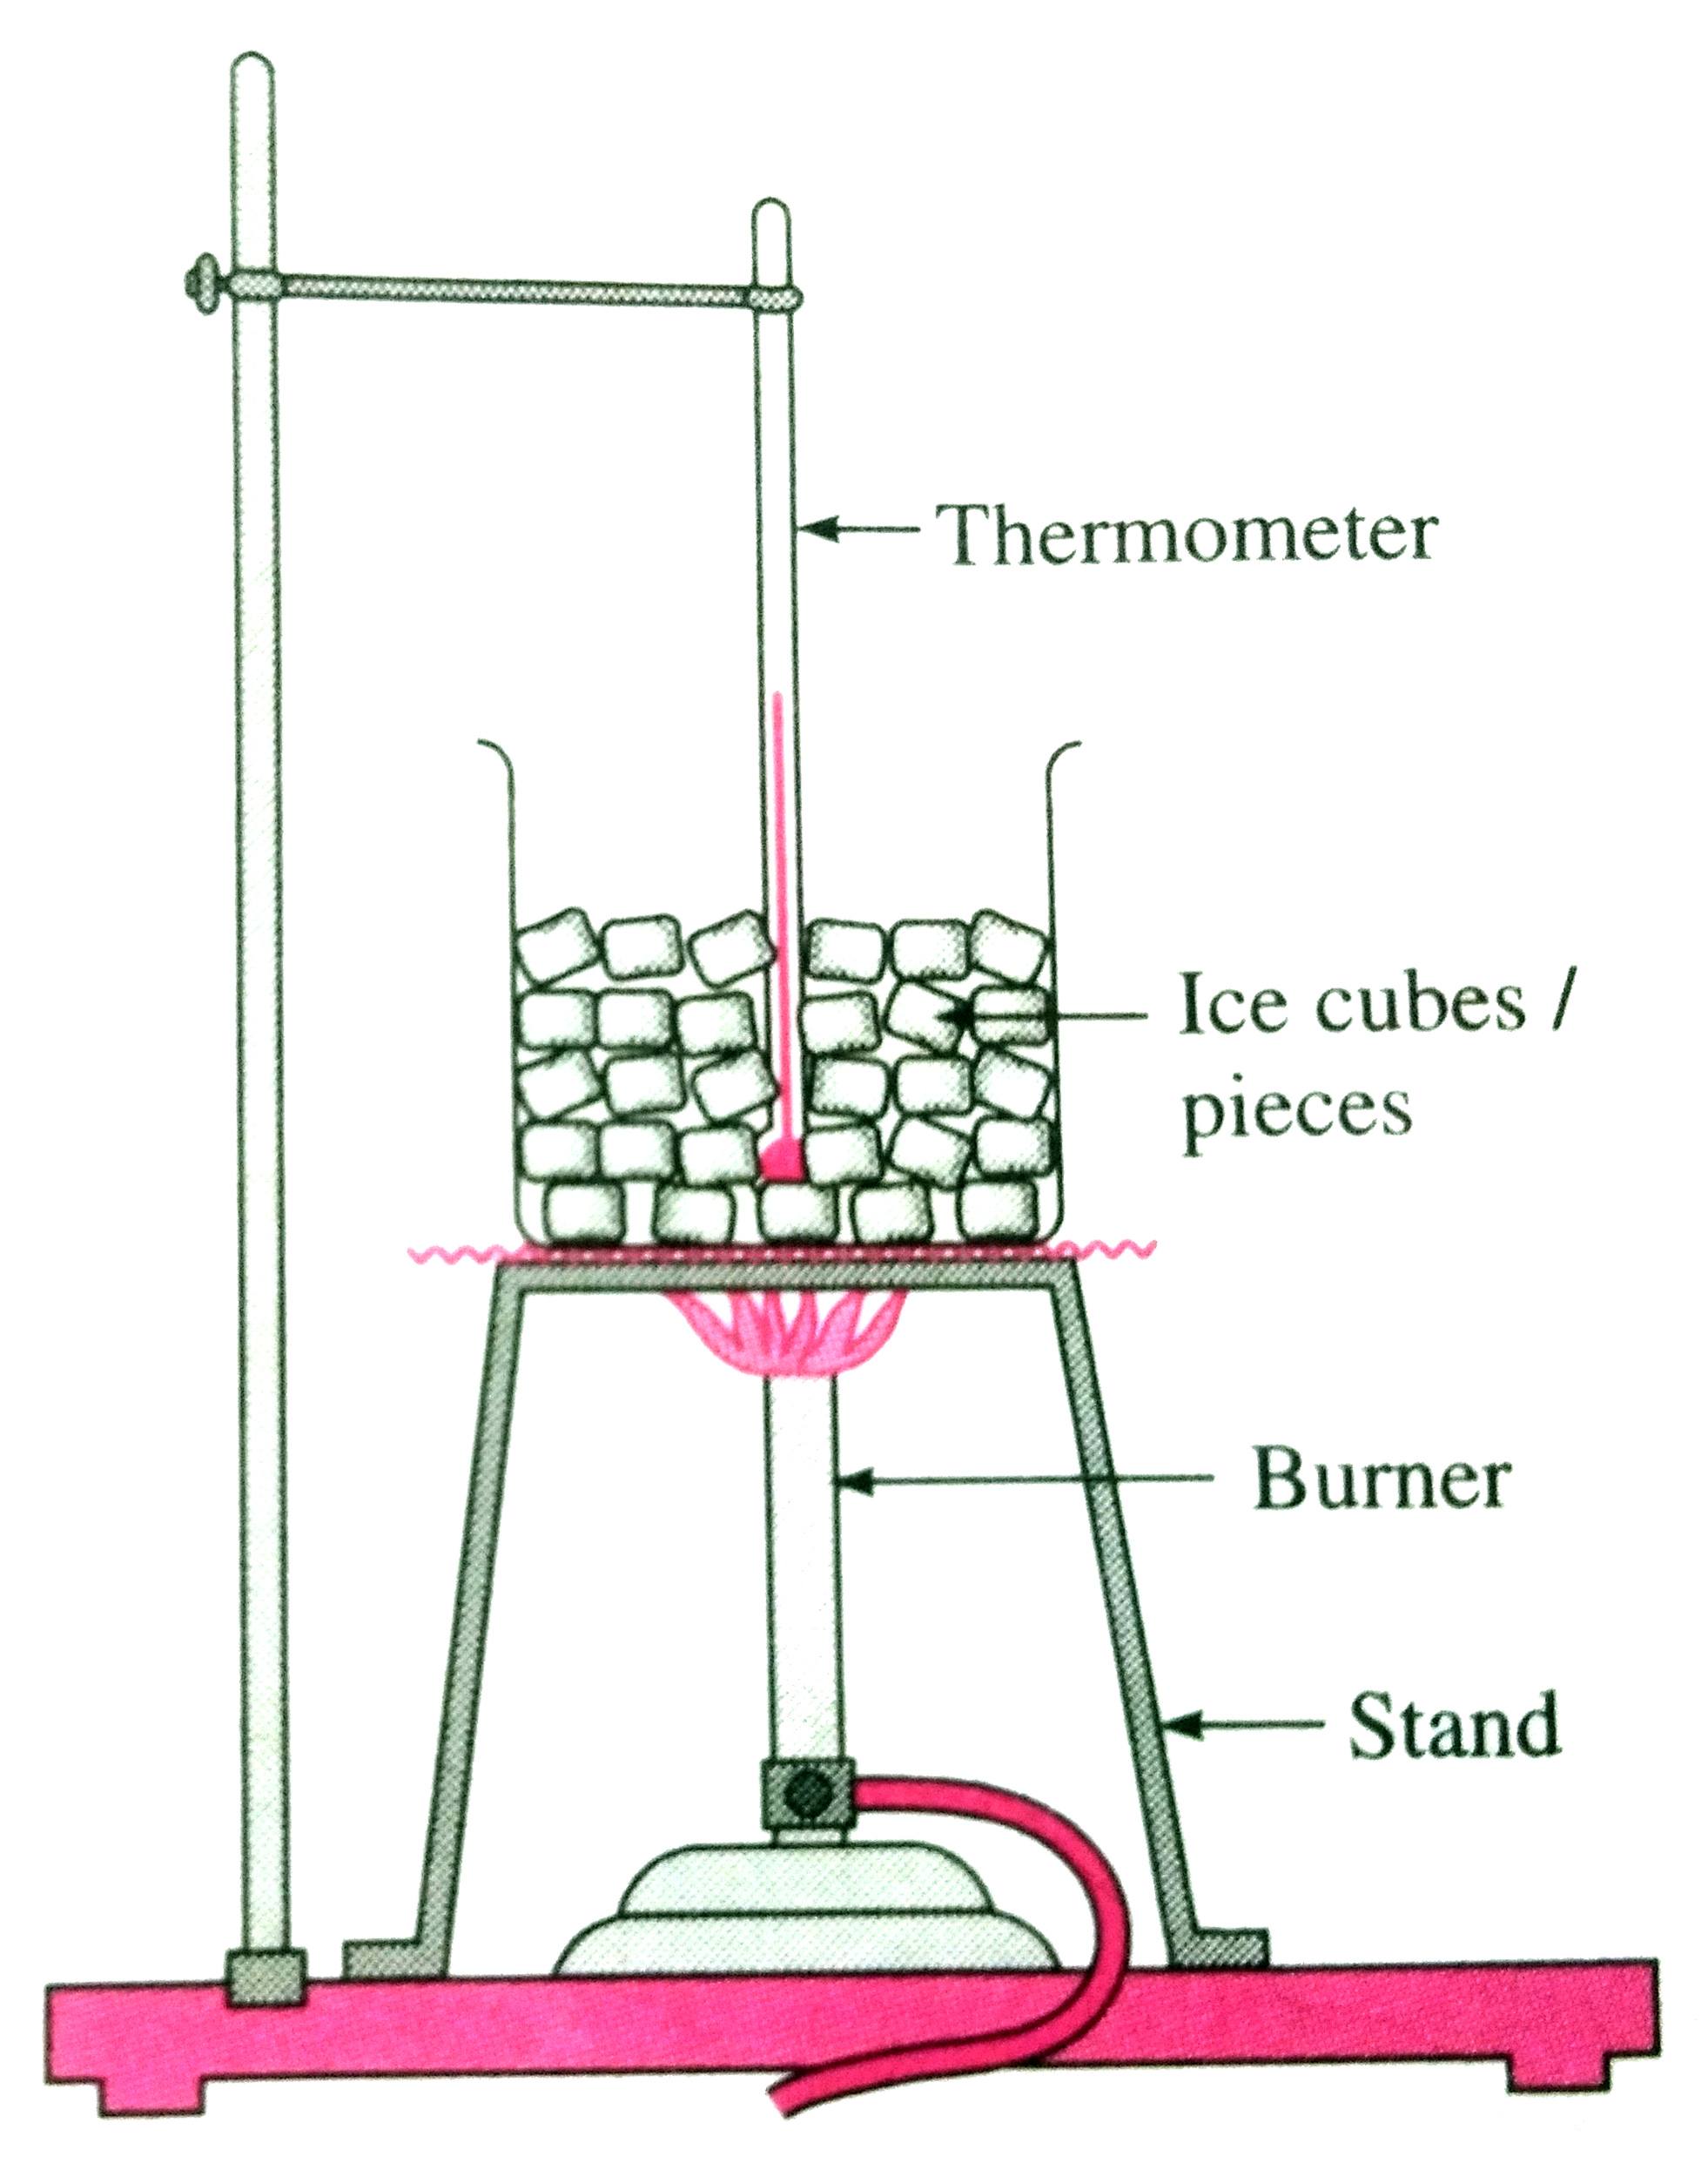
(1) Take a few pieces of ice in a glass beaker as shown in figure.
(2) Insert the bulb of a thermometer in ice and measure its temperature.
(3) Put the beaker on a stand and heat the ice using a burner.
(4) Record the temperature using the thermometer after every minute.
(5) As the ice is heated,it starts melting. Stir the mixture of ice and water.
(6) Continue the heating even after ice starts melting.
(7) Draw a graph of temperature versus time.
Define specific latent heat of fursion. OR
What is specific latent heat of fusion? State its units.
View Solution(1) Take a few pieces of ice in a glass beaker as shown in figure.
(2) Insert the bulb of a thermometer in ice and measure its temperature.
(3) Put the beaker on a stand and heat the ice using a burner.
(4) Record the temperature using the thermometer after every minute.
(5) As the ice is heated,it starts melting. Stir the mixture of ice and water.
(6) Continue the heating even after ice starts melting.
(7) Draw a graph of temperature versus time.
Define latent heat of fusion
OR
What is latent heat of fusion ? State its units.
View Solution
