Oil and gas production in a certain area dropped from 4 million barrels in 2000 to 1.9 million barrels in 2013. Assuming that the oil and gas production decreased at a constant rate, which of the following linear functions f best models the production, in millions of barrels, t years after the year 2000?
f(t)=21130t+4
f(t)=19130t+4
f(t)=−21130t+4
f(t)=−19130t+4
The correct Answer is:C
It is assumed that the oil and gas production decreased at a constant rate. Therefore, the function f that best models the production t years after the year 2000 can be written as a linear function, f (t) = mt + b, where m is the rate of change of the oil and gas production and b is the oil and gas production, in millions of barrels, in the year 2000. Since there were 4 million barrels of oil and gas produced in 2000, b = 4. The rate of change, m, can be calculated as 4−1.90−13=−2.113, which is equivalent to −21130 , the rate of change in choice C.
Choices A and B are incorrect because each of these functions has a positive rate of change. Since the oil and gas production decreased over time, the rate of change must be negative. Choice D is incorrect. This model may result from misinterpreting 1.9 million barrels as the amount by which the production decreased.
Similar Questions
Land under cultivation (in million hectares) in India in the year 2000 was
View SolutionAssertion : In 1900, world population was 2000 million.
Reason : Indian population crossed 2000 million mark in May 2000.
View SolutionFill in the blanks: {:("Year","Population of India","Population of World"),(,"(in million)","(in million)"),(1900,280,a),(1947,b,2600),(2000,c,d),(2016,e,f):}
View SolutionAn oil refinery buys oil at Rs 3600 per barrel. 10% of this goes to waste. If the refinery wants to make 5% profit then at what price should it sell the oil which includes 8% tax. (in Rupees per barrel)
View SolutionIf the number of barrels of oil consumed doubles in 10 years and if B barrels of oil were consumed in 1940, then what multiple of B oil was consumed in the year 2000
View SolutionProduction of Rabi and Kharif pulses (in million tonnes) In which of the following years the difference between the production of Rabi and Kharif is minimum?
View SolutionProduction of Rabi and Kharif pulses (in million tonnes) In the year 1995-96 the production of Kharif is approximately what percent of the production of Rabi?
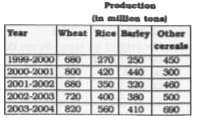
View SolutionThe following table shows the productions of food-grains (in million tons) in a state for the period 1999 - 2000 to 2003 - 2004. Read the table and the questions.

In the year 2003 - 2004, the increase in production was maximum over the previous year for :
View Solution
