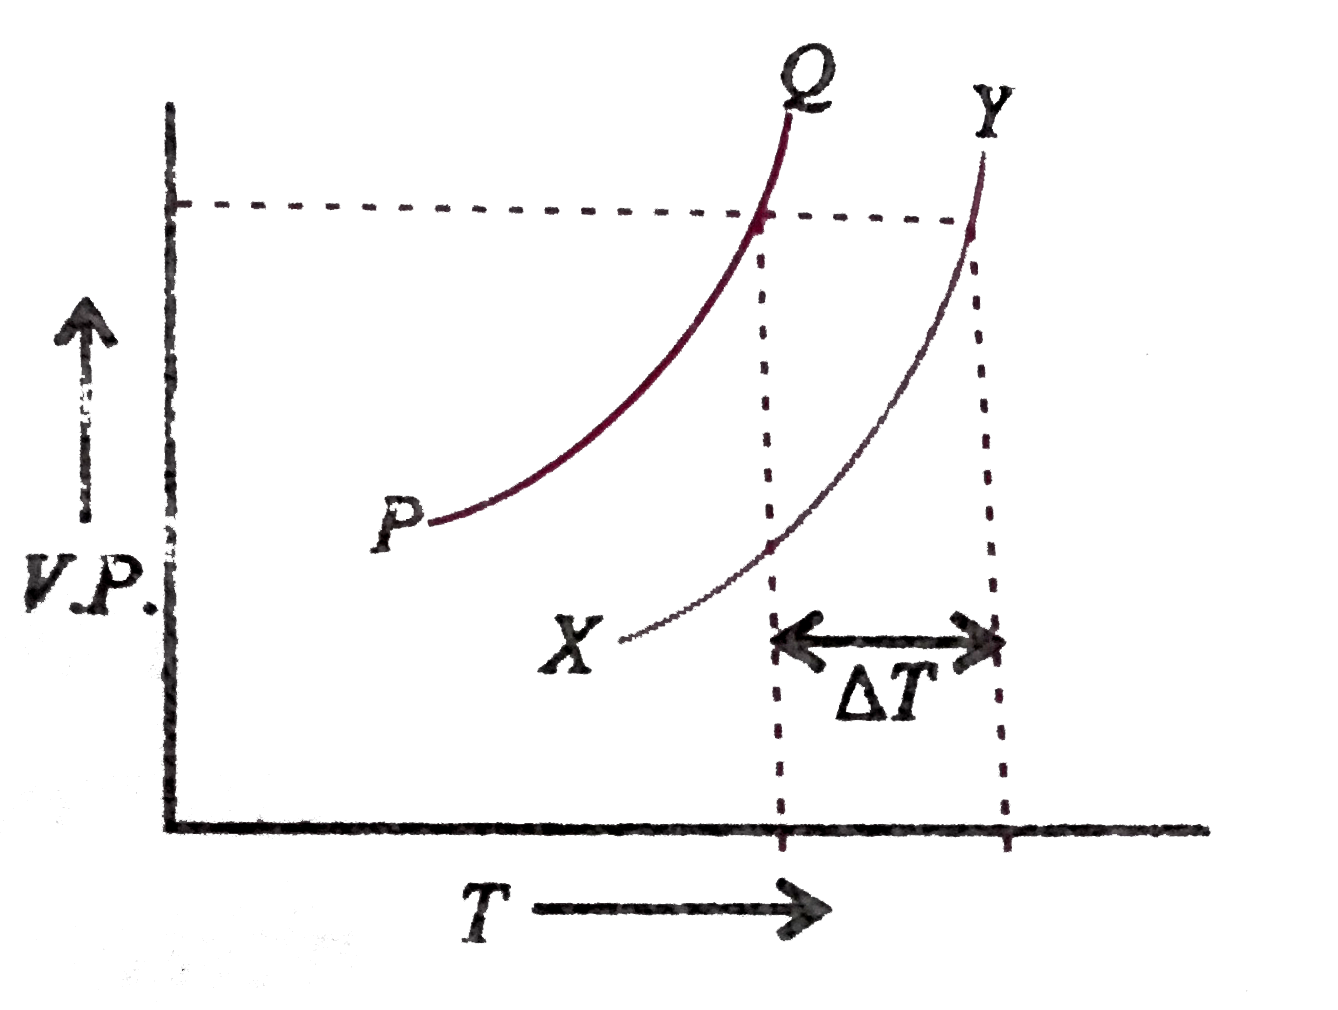
Which plot involving vapour pressure (VP) and absolute temperature results in a straight line ?
Vp us T
VP us T−1
ln VP us T
ln VP us T−1
The correct Answer is:D
Step by step video, text & image solution for Which plot involving vapour pressure (VP) and absolute temperature results in a straight line ? by Chemistry experts to help you in doubts & scoring excellent marks in Class 12 exams.
Updated on:21/07/2023Topper's Solved these Questions
- GRAPHICAL INTERPRETATIONBook:GRB PUBLICATIONChapter:GRAPHICAL INTERPRETATIONExercise:H. Chemical Kinetics
Explore 1 Video
- GRAPHICAL INTERPRETATIONBook:GRB PUBLICATIONChapter:GRAPHICAL INTERPRETATIONExercise:Chemical Kinetics
Explore 80 Videos
- GRAPHICAL INTERPRETATIONBook:GRB PUBLICATIONChapter:GRAPHICAL INTERPRETATIONExercise:G. Chemical Equilibrium
Explore 1 Video
- F-BLOCK ELEMENTSBook:GRB PUBLICATIONChapter:F-BLOCK ELEMENTSExercise:Subjective type
Explore 7 Videos
- HYDROCARBON (ALIPHATIC)Book:GRB PUBLICATIONChapter:HYDROCARBON (ALIPHATIC)Exercise:Previous years jee questions
Explore 28 Videos
Similar Questions
Knowledge Check
Absolute temperature is the temperature at which
Aall molecular motion ceasesBvolume becomes zeroCmass becomes zeroDnone of theseAbsolute zero is the temperature at which
Awater solidifiesBall gases become liquidCice meltsDmotion of molecules becomes minimumThe absolute zero is the temperature at which
AWater freezesBAll substance exist in solid stateCMolecular motion ceasesDNone of the above
Why is the vapour pressure of liquid constant at a constant temperature ?
View SolutionAssertion: The plot of volume (V) versus pressure (P) at constant temperature is a hyperbola in the first quadrant.
Reason: V∝1/P at constant temperature.
View SolutionThe absolute zero is the temperature at which
View SolutionIf P, V and T stand for pressure, volume and absolute temperature of a gas, which of the following will be true for Boyle's Law
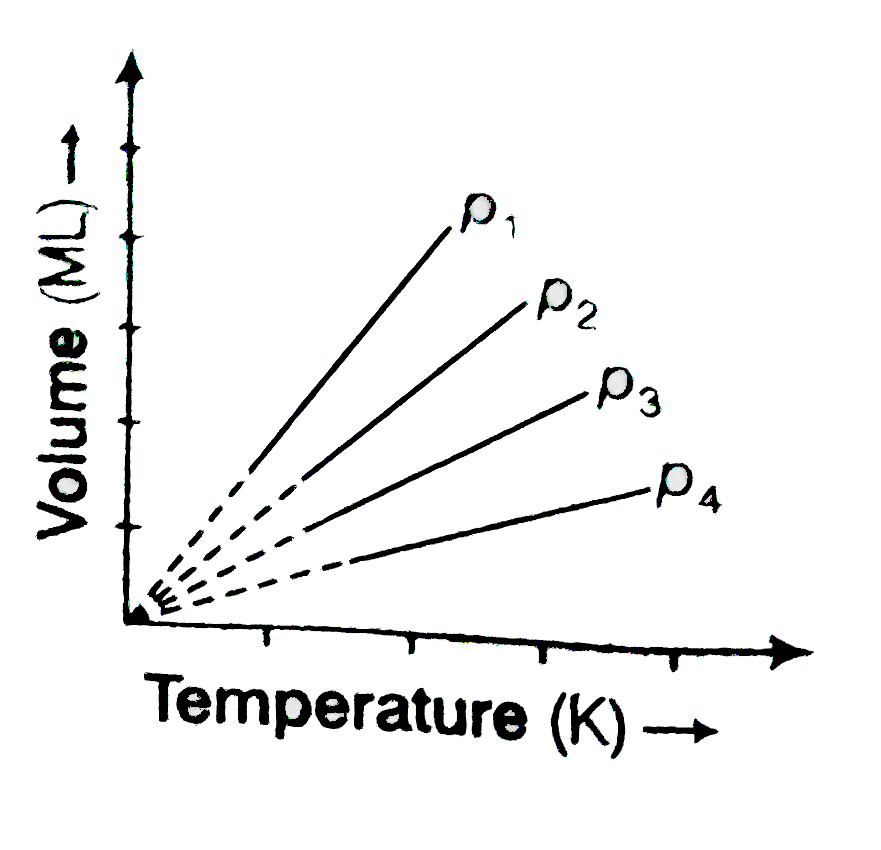
View SolutionA plot of volume (V) versus temperature (T) for a gas at constant pressure is a straight line passing through the origin. The plots at different values of pressure are shown in figure. Which of the following order of pressure is correct for this gas ?

View Solution


