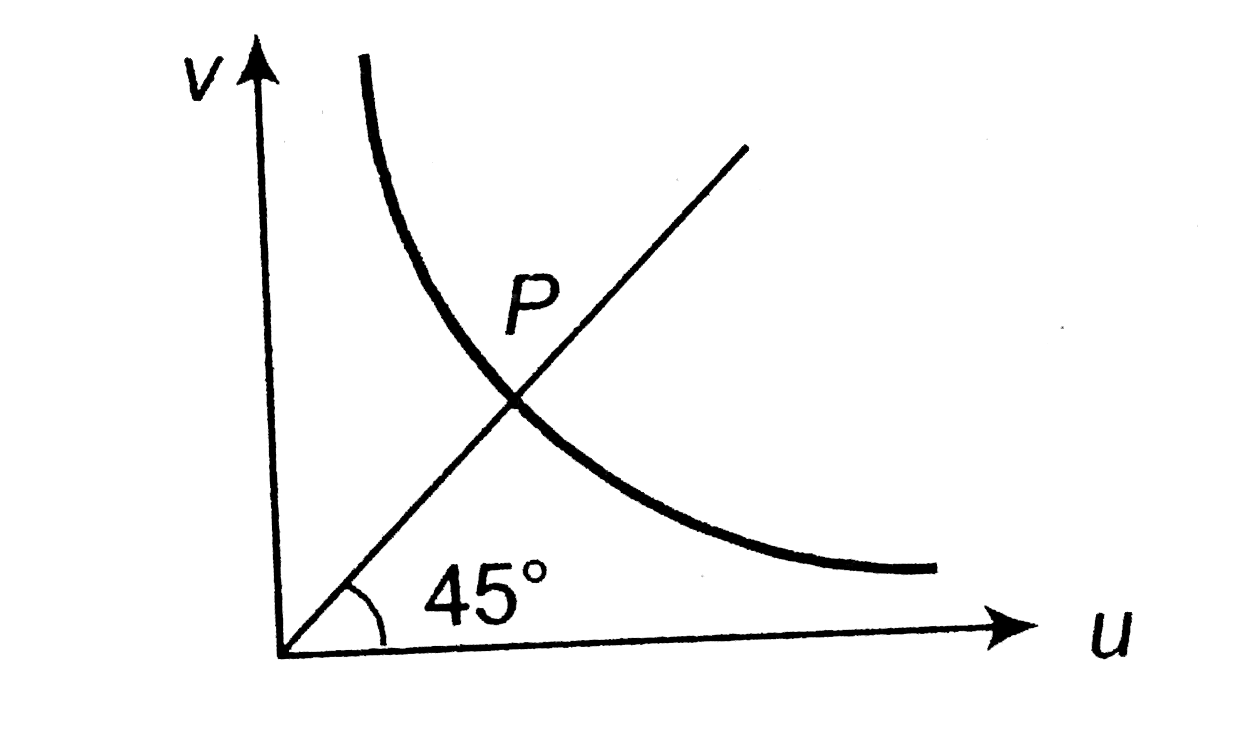
The graph shows variation of v with change in u for a mirrorr. Points plotted above the point P on the curve are for values of v
Smaller than f
Smaller than 2 f
Larger than 2f
Larger than f
The correct Answer is:C
Step by step video, text & image solution for The graph shows variation of v with change in u for a mirrorr. Points plotted above the point P on the curve are for values of v by Physics experts to help you in doubts & scoring excellent marks in Class 12 exams.
Updated on:21/07/2023Topper's Solved these Questions
- RAY OPTICSBOOK - CENGAGE PHYSICSCHAPTER - RAY OPTICSEXERCISE - Matching Column Type
1 Video
- RAY OPTICSBOOK - CENGAGE PHYSICSCHAPTER - RAY OPTICSEXERCISE - DPP 1.2
15 Videos
- PHOTOELECTRIC EFFECTBOOK - CENGAGE PHYSICSCHAPTER - PHOTOELECTRIC EFFECTEXERCISE - Integer Type
4 Videos
- RAY OPTICS AND OPTICAL INSTRUMENTSBOOK - CENGAGE PHYSICSCHAPTER - RAY OPTICS AND OPTICAL INSTRUMENTSEXERCISE - QUESTION BANK
40 Videos
Similar Questions
Knowledge Check
The graph in Fig. shows plot of variation of v with change in u for a concave mirror. Points plotted above the point P on the curve are for values of v :
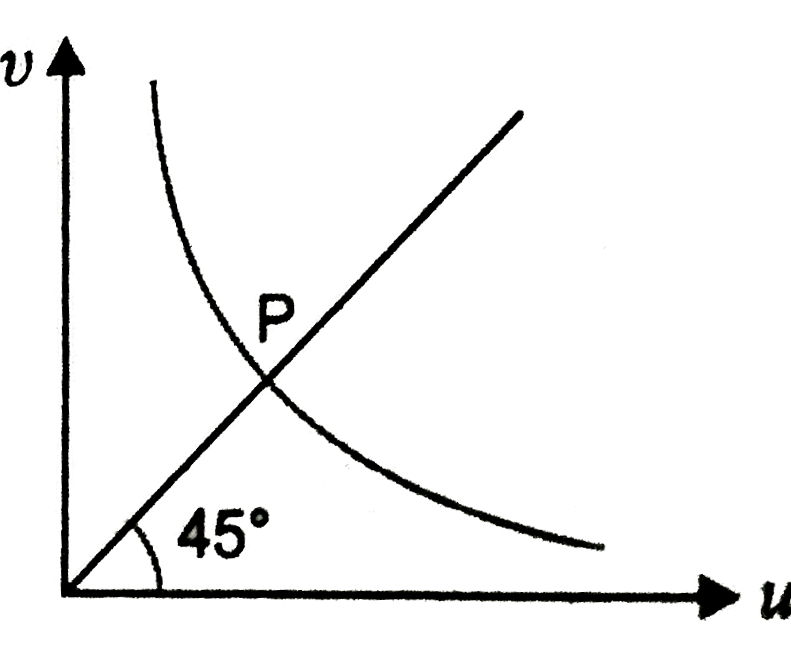 .Asmaller than fBsmaller than 2fClarger than 2fDlarger than f but less than 2f
The graph showing correctly the variation of image distance (v) as a function of object distance (u) in case of a concave mirror is
A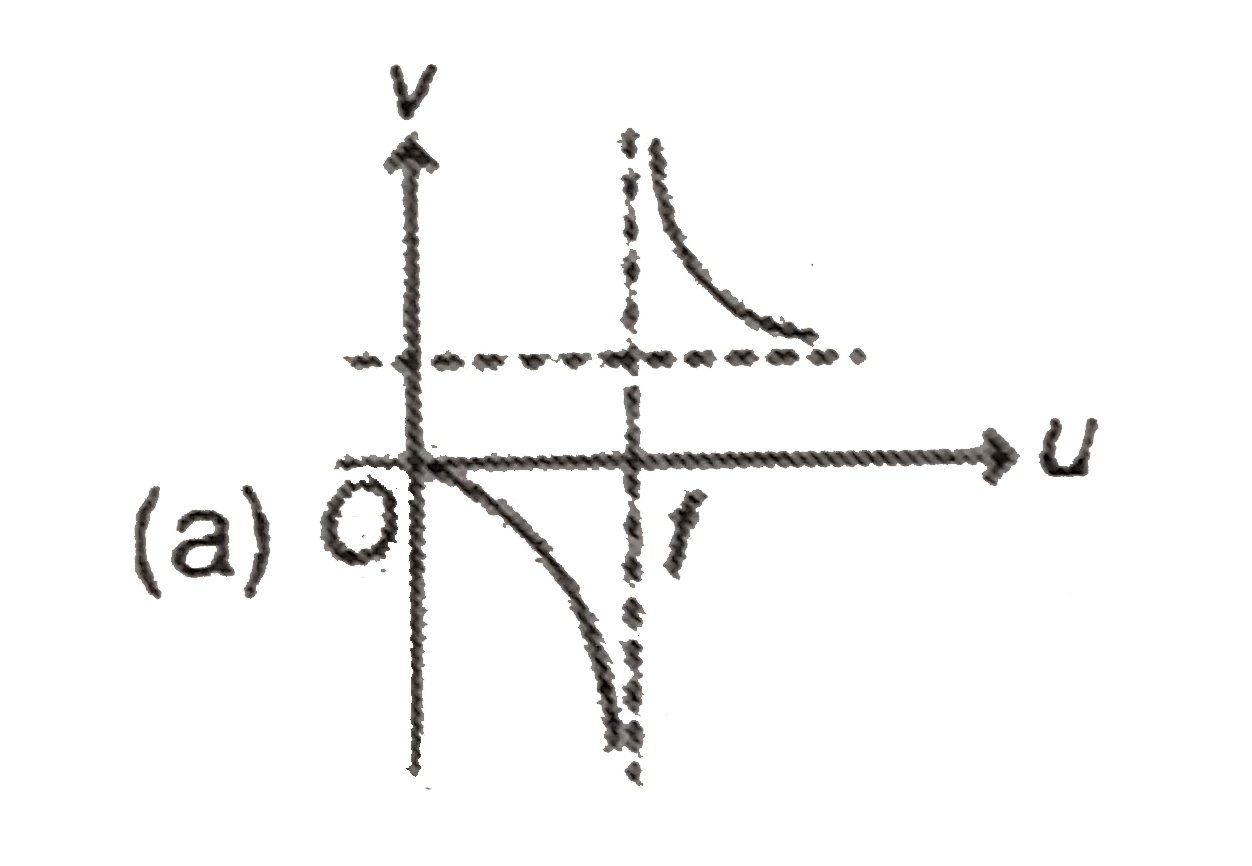 B
B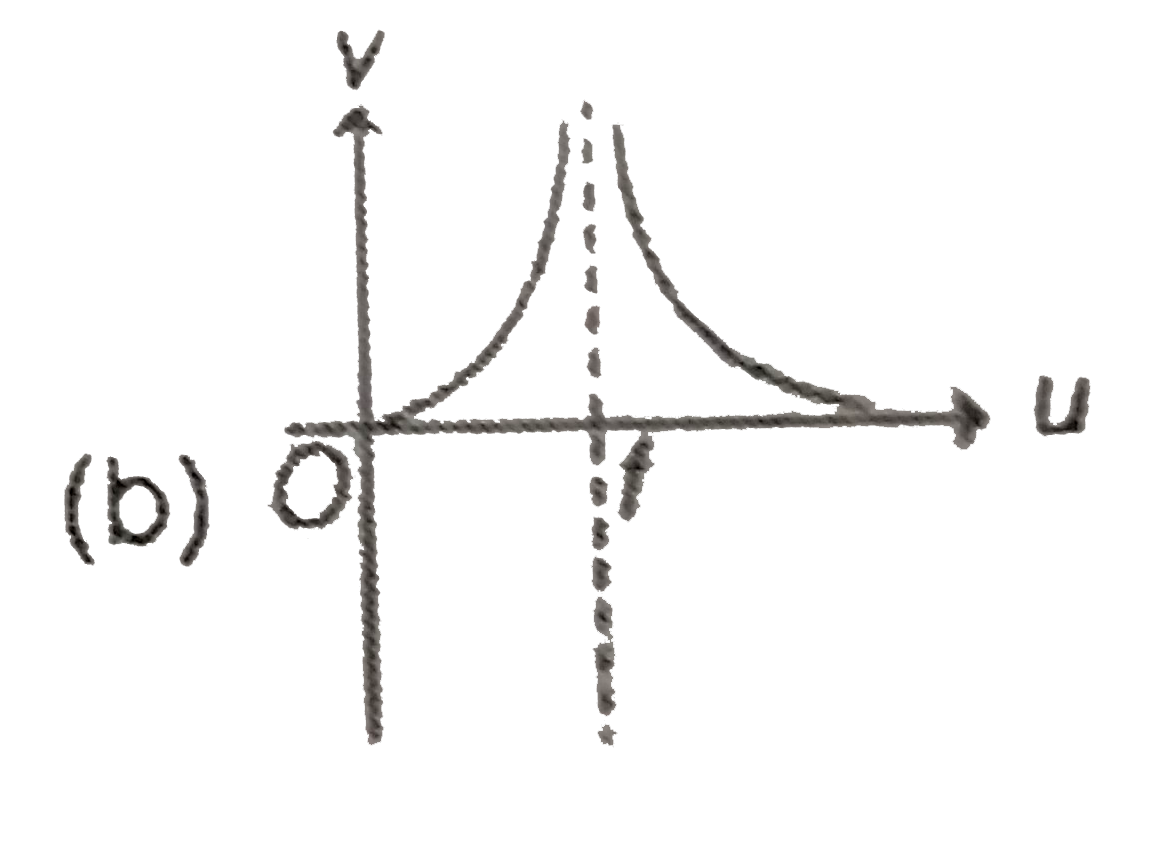 C
C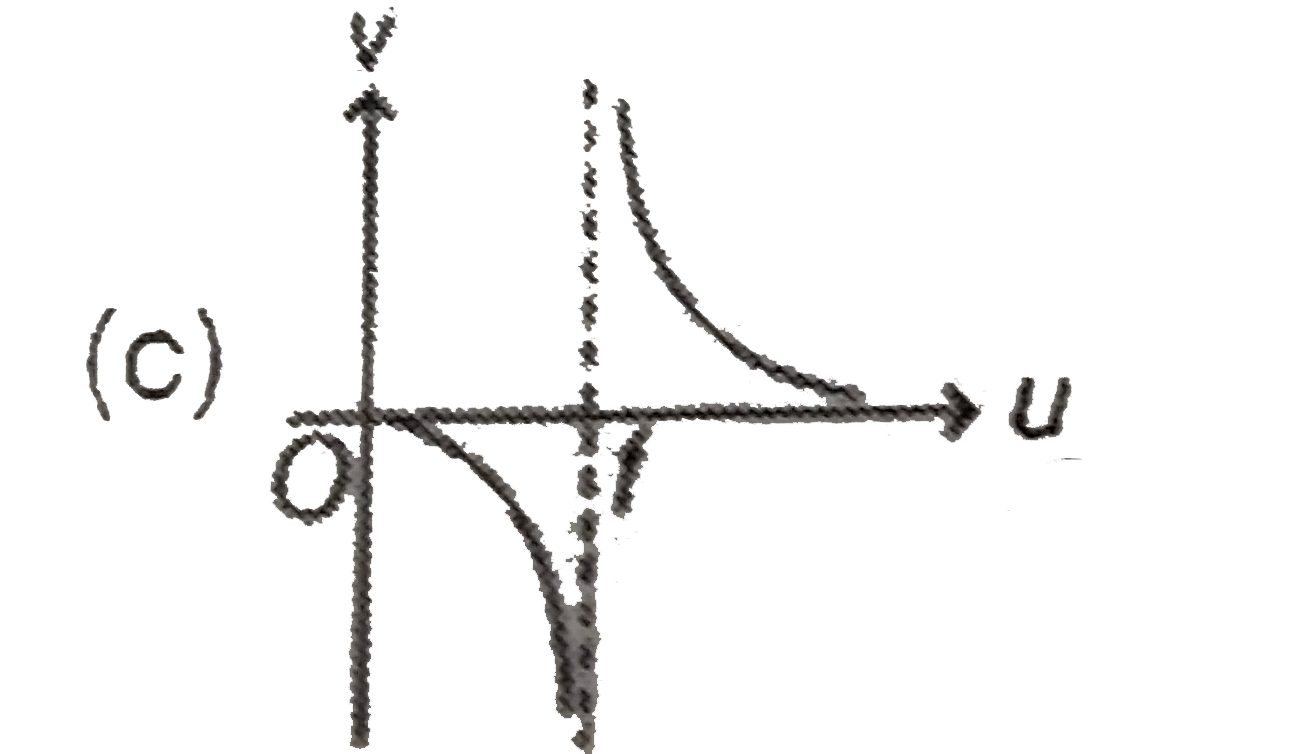 D
D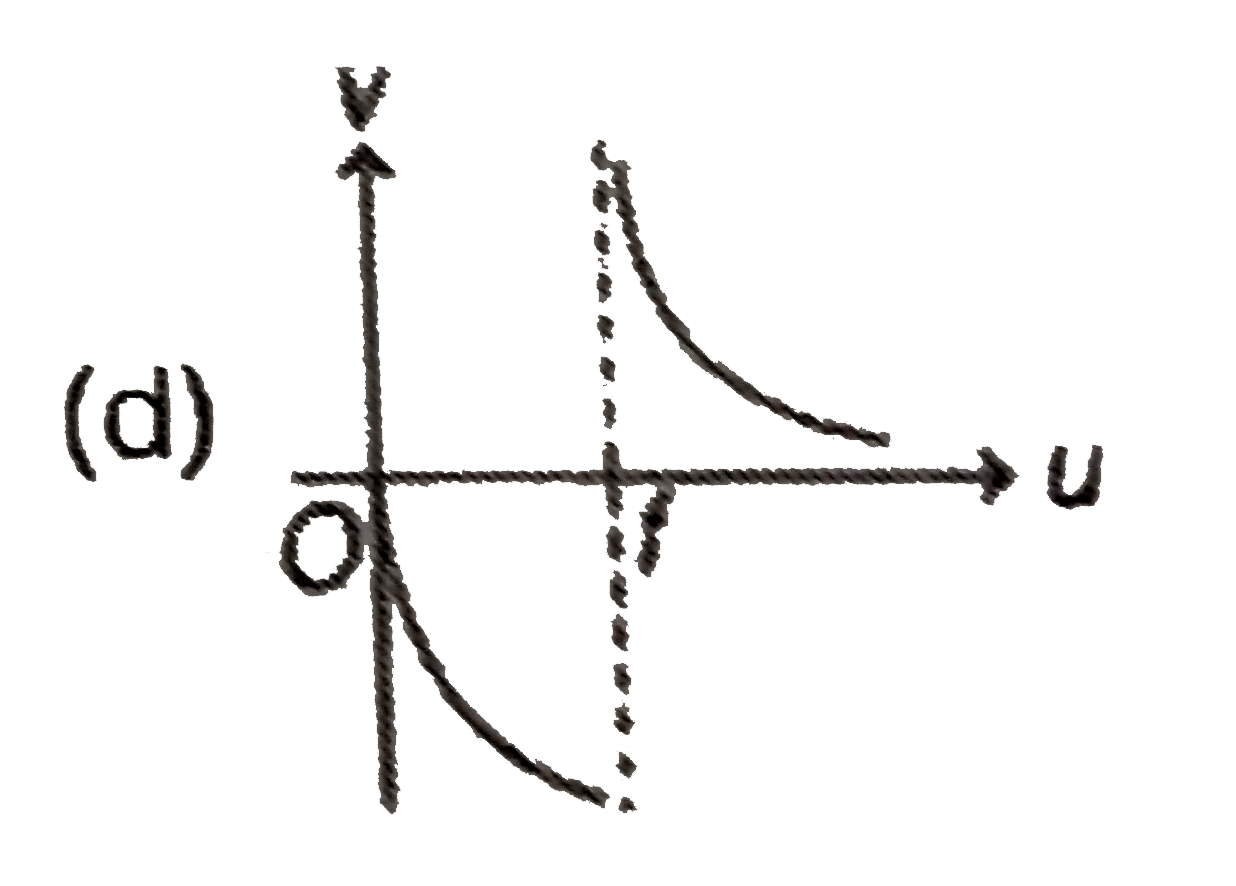
The graph between u and v for a convex mirrorr is
A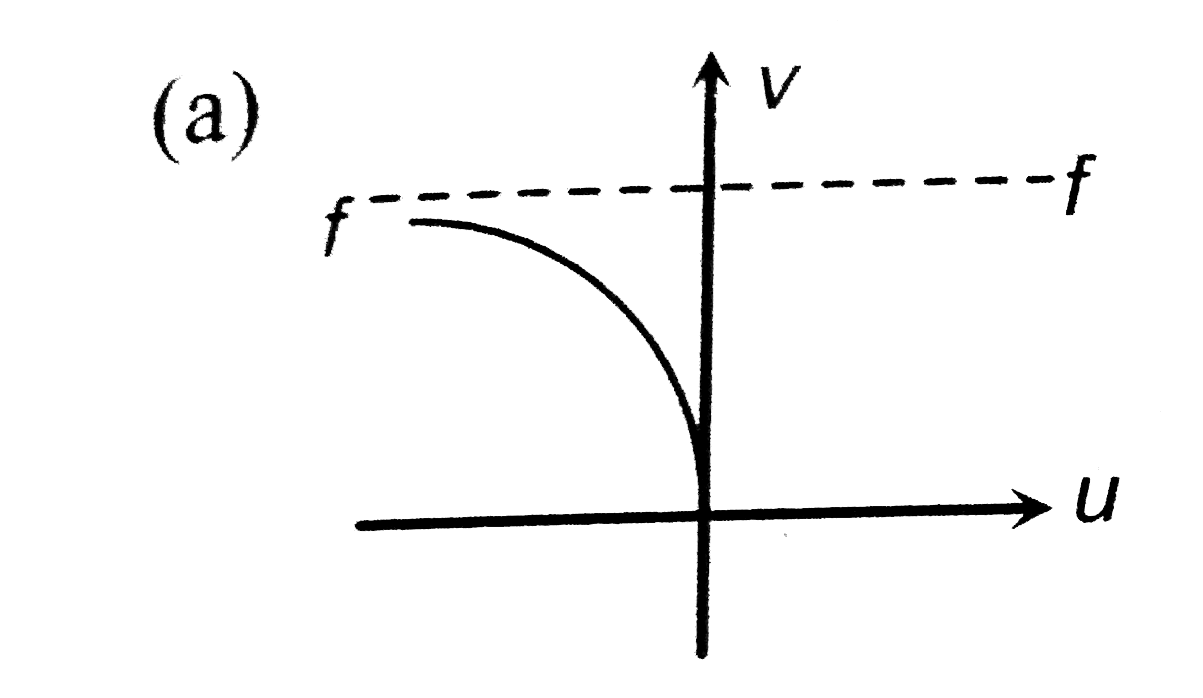 B
B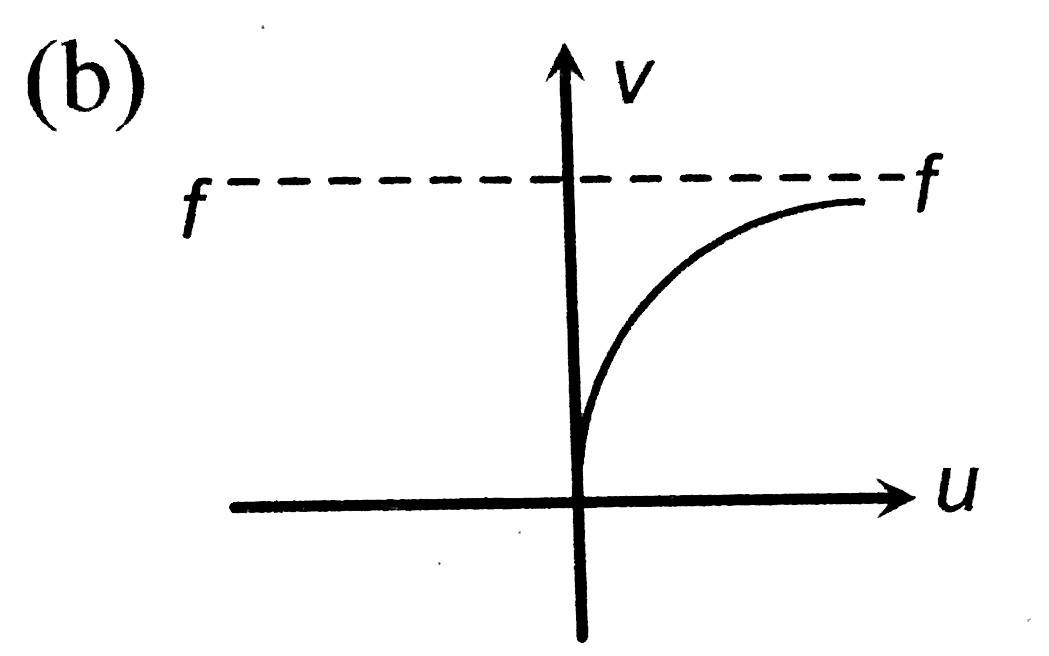 C
C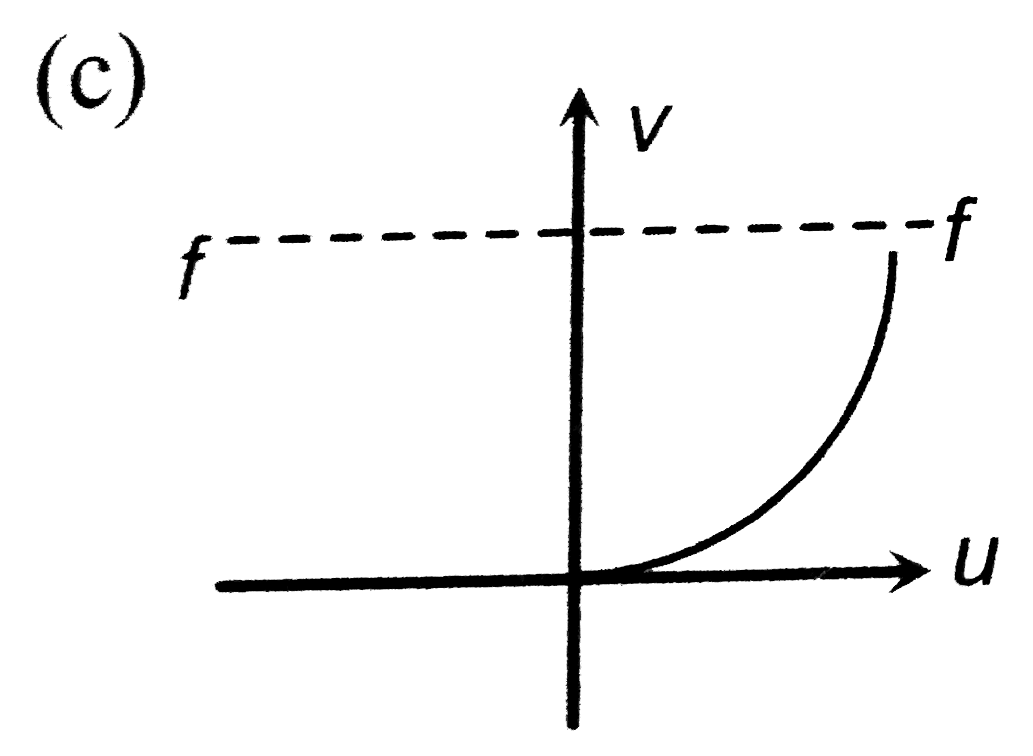 D
D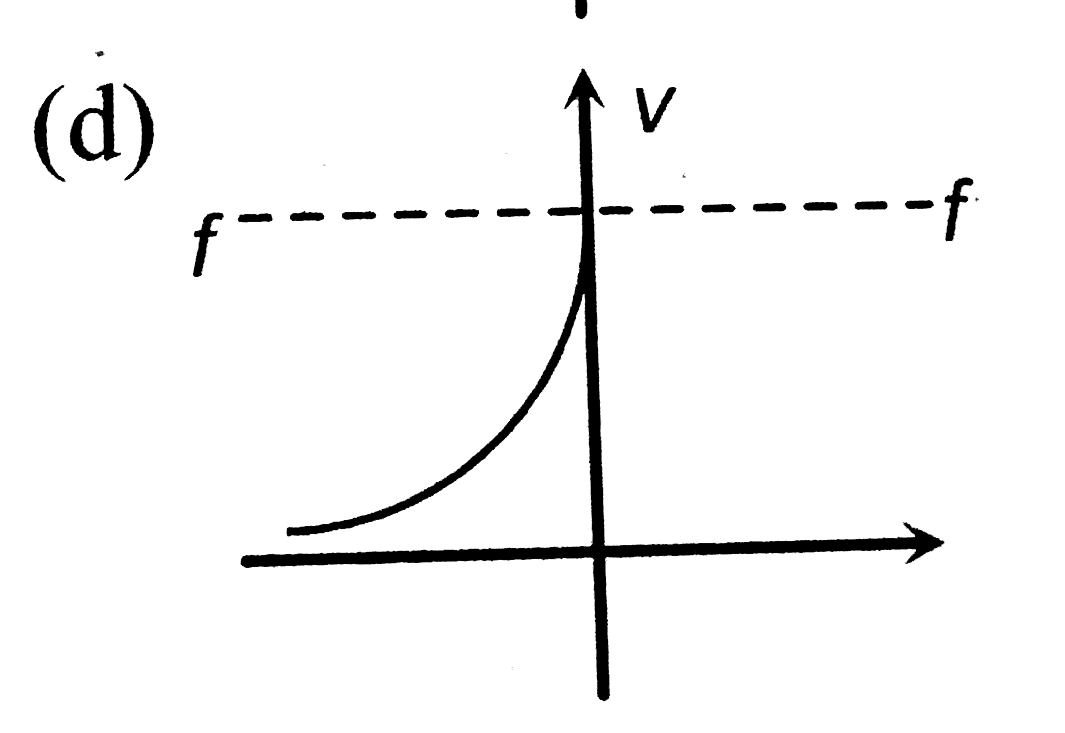
Plot a graph showing variation of capacitive reactance with the change in the frequency of the AC source.
View SolutionDraw the graph showing variation of the value of the induced emf as a function of rate of change of current flowing through an ideal inductor.
View SolutionDraw the graph showing variation of the value of the induced emf as a function of rate of change of current flowing through an ideal inductor.
View SolutionPlot the point (4, 3) on a graph sheet. Is it the same as the point (3, 4)?
View SolutionAs the position of an object (u) reflected from a concave mirrorr is varies, the position of the image (v) also varies. By letting the u changes from 0 to +∞ the graph between v versus u will be
View Solution