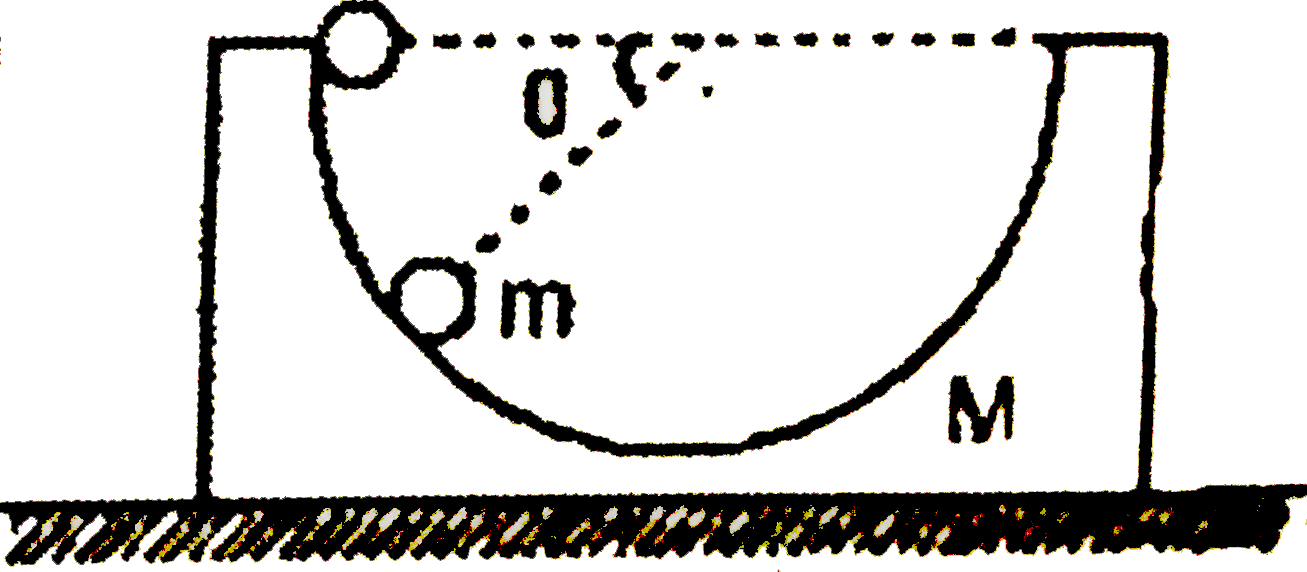
In the shown figure, a small mass m starts sliding down a smooth and stationary circular track. Which of the following graph best represents the variation of magnitude of the force applied by the track on the mass and the angle θ?
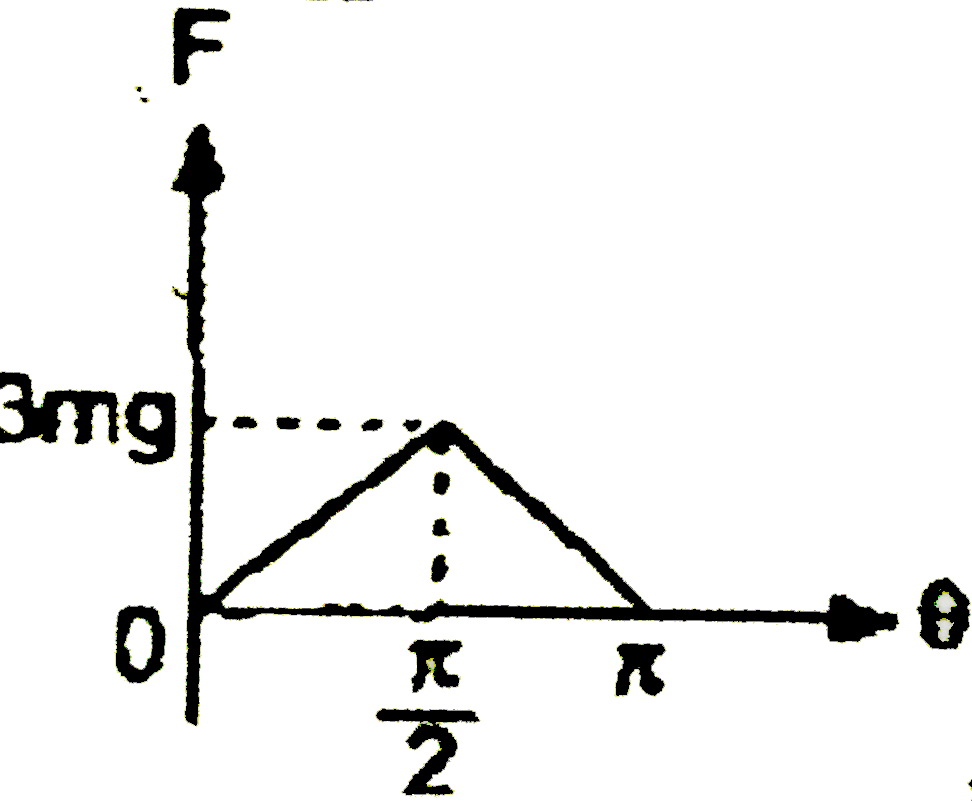
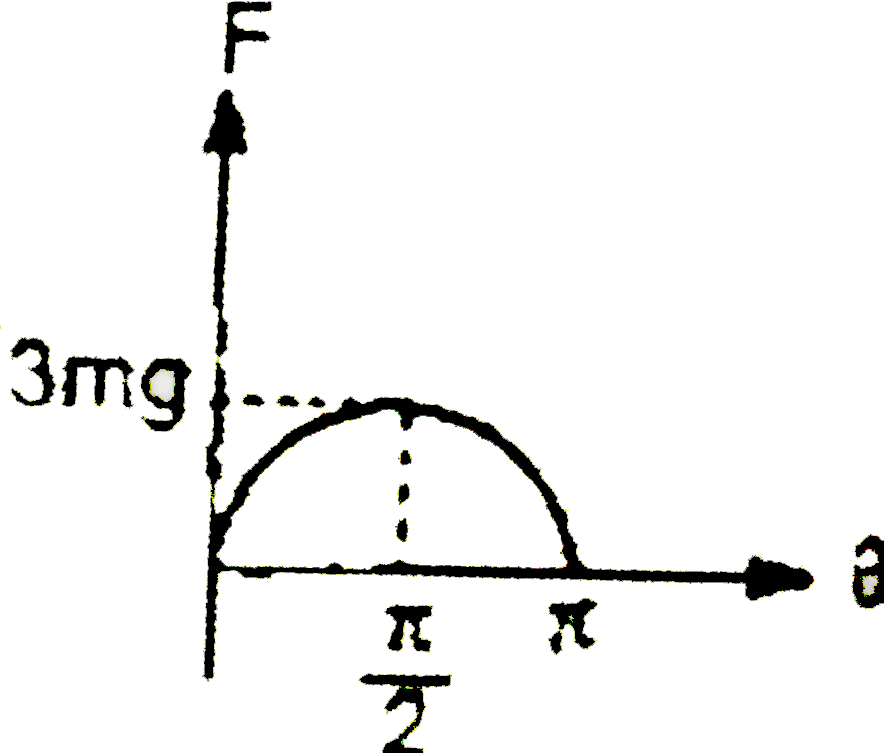
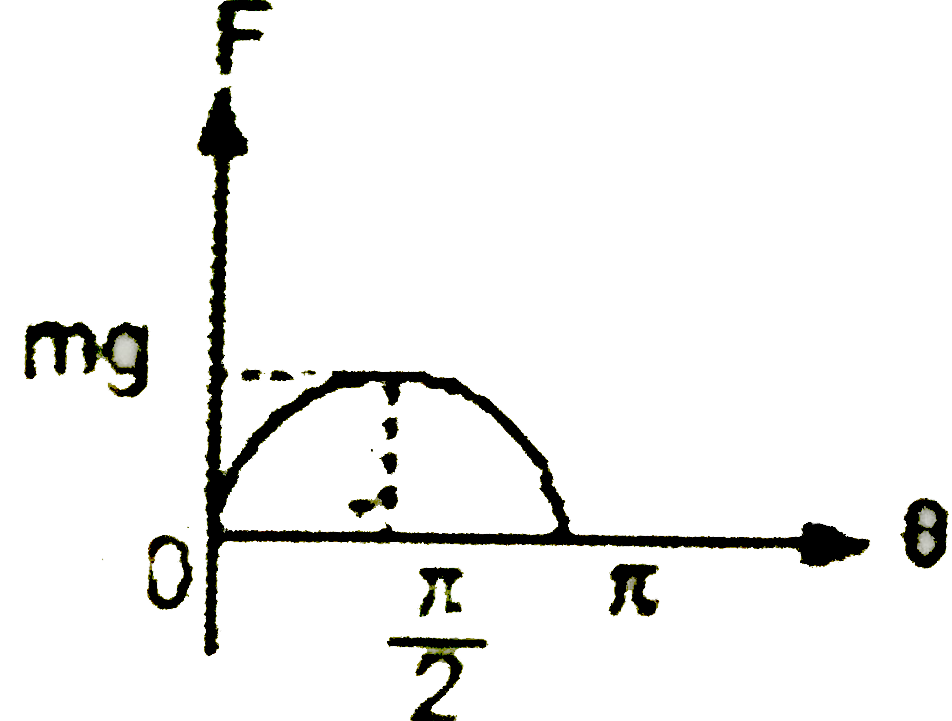
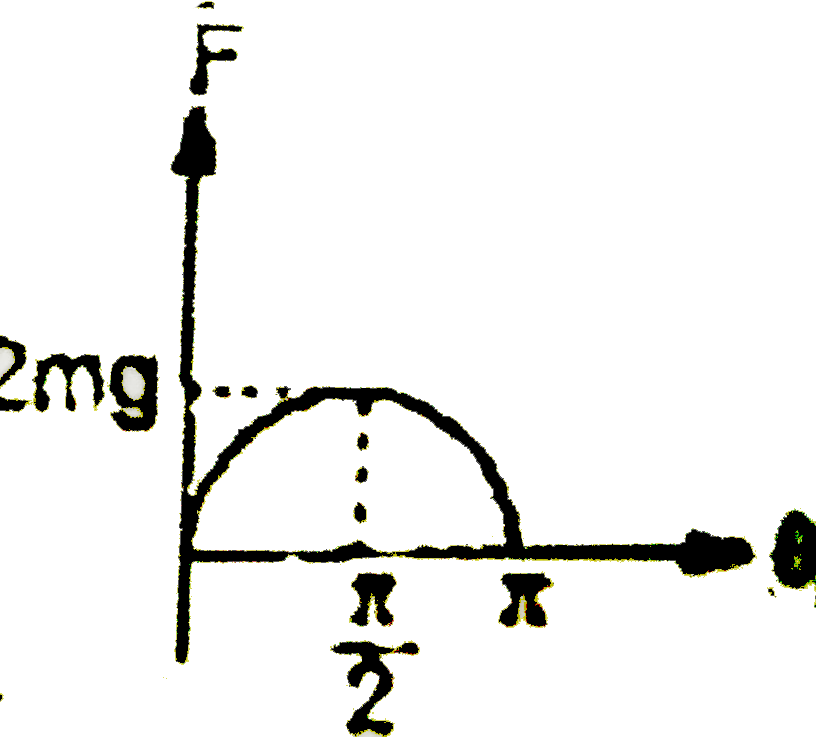
The correct Answer is:B
Step by step video, text & image solution for In the shown figure, a small mass m starts sliding down a smooth and stationary circular track. Which of the following graph best represents the variation of magnitude of the force applied by the track on the mass and the angle theta? by Physics experts to help you in doubts & scoring excellent marks in Class 11 exams.
Updated on:21/07/2023Topper's Solved these Questions
- WORK AND ENERGYBook:ANURAG MISHRAChapter:WORK AND ENERGYExercise:Level 2
Explore 18 Videos
- WORK AND ENERGYBook:ANURAG MISHRAChapter:WORK AND ENERGYExercise:Level 3
Explore 34 Videos
- WORK AND ENERGYBook:ANURAG MISHRAChapter:WORK AND ENERGYExercise:Eample
Explore 47 Videos
- UNIT AND DIMENSIONSBook:ANURAG MISHRAChapter:UNIT AND DIMENSIONSExercise:Matching Type Problem
Explore 4 Videos
Similar Questions
Knowledge Check
The graph shown the variation with times t of the velocity v of an object . Which one of the following graphs best represents the variation of acceleration a of the object with time t?
 A
A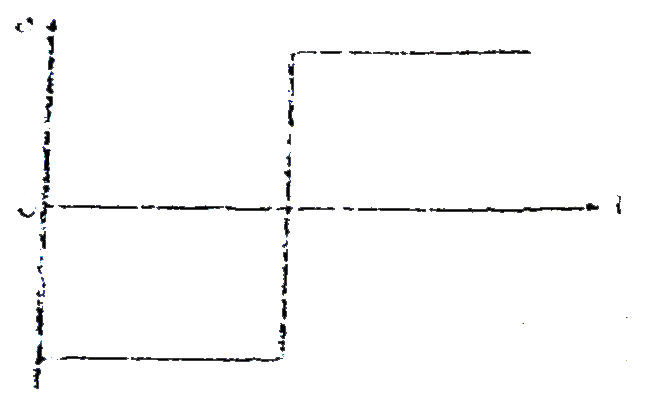 B
B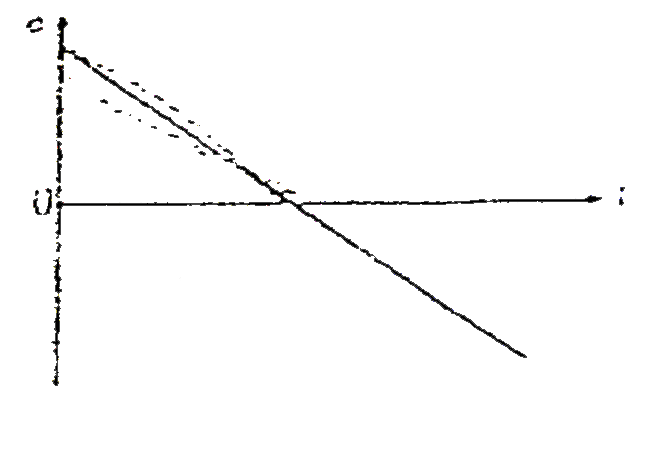 C
C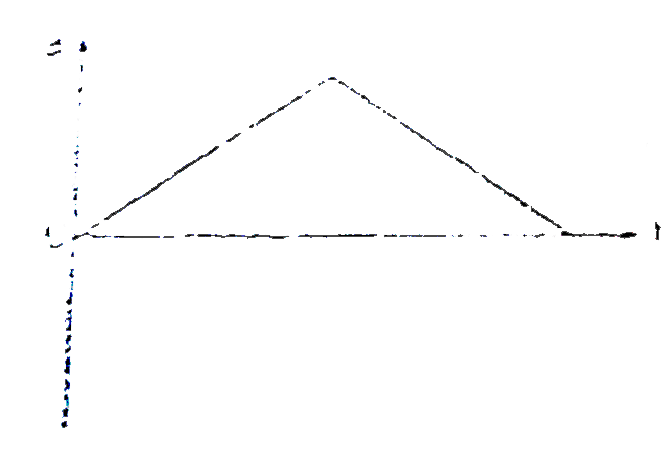 D
D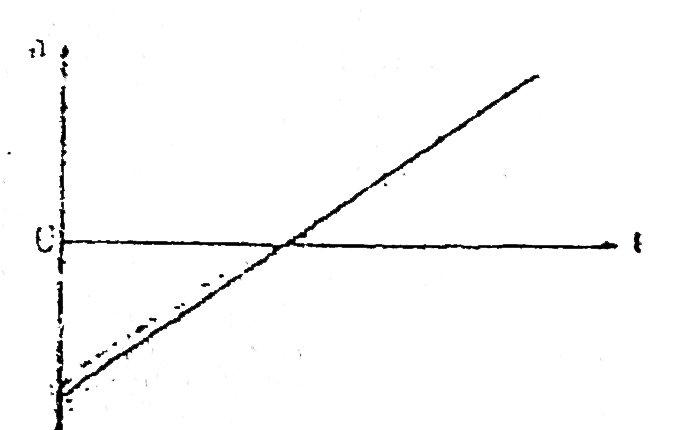
In the Q. No. 26, if M=2m and friction exists between the circular track and the horizontal surface then, which of the following lot best represents the variation of frictional force versus the angle θ:
A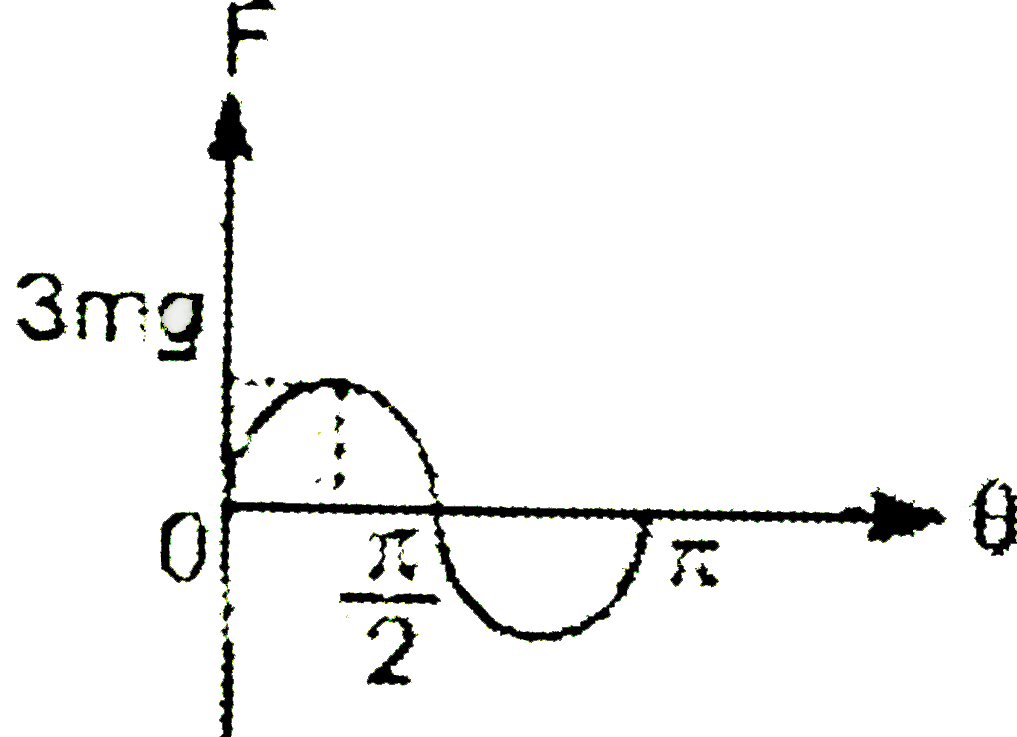 B
B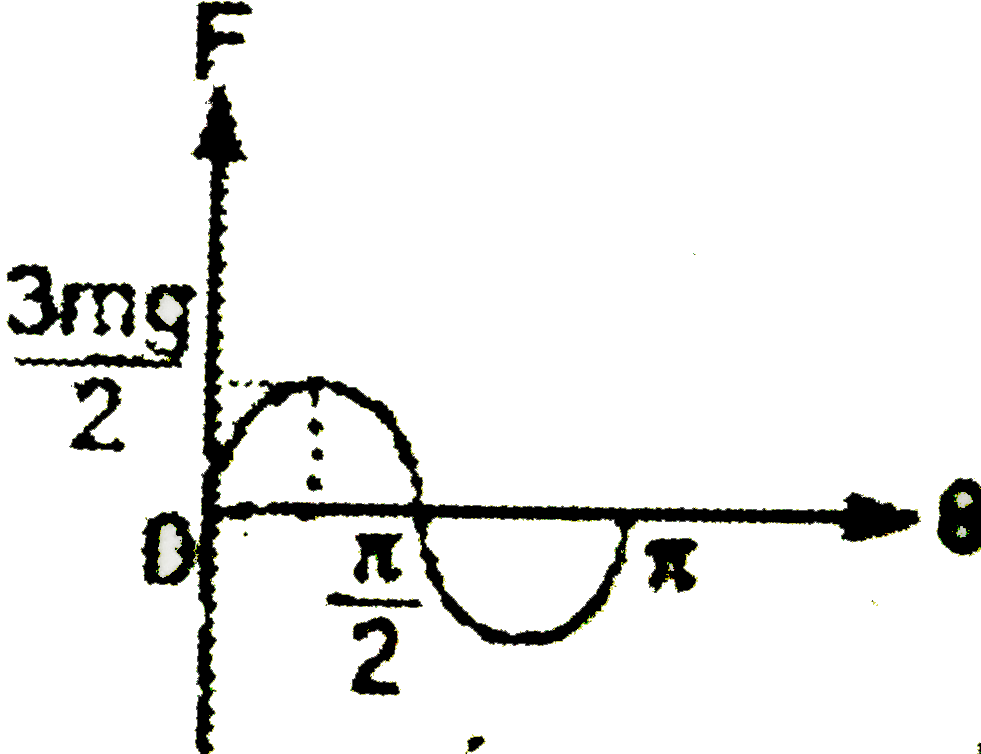 C
C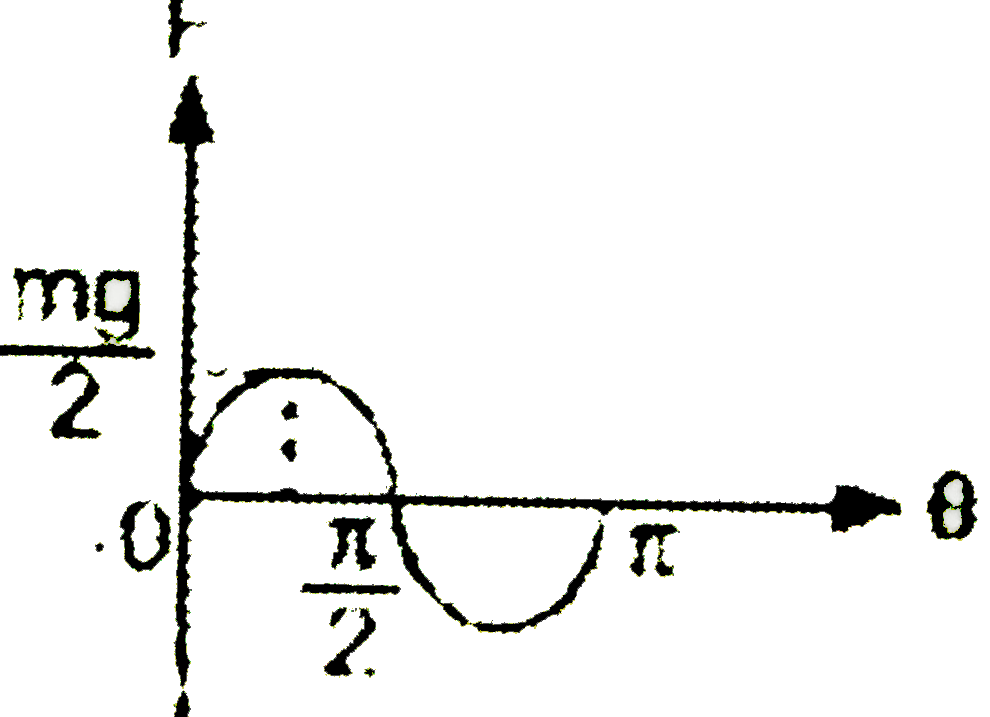 D
D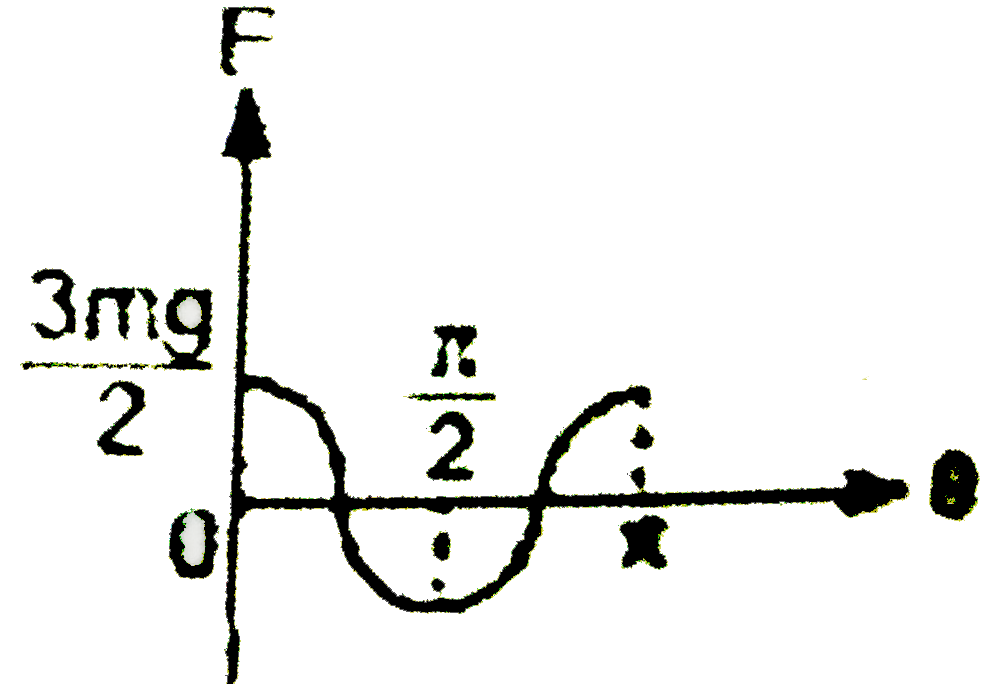
Graph between velocity and displacement is shown in the following figure:
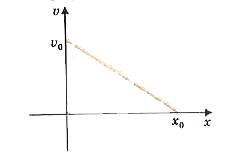
Which of the following graphes represents the correct variation of acceleration with displacementA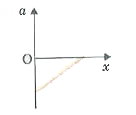 B
B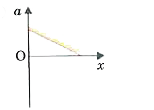 C
C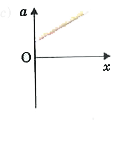 Dnone
Dnone
We know that when two equal masses are placed on a line then, gravitational force on a third mass is zero due to these two masses when the third is placed at the centre of line joining the two masses. But if third mass is placed anywhere else on the x-axis, the gravitational force acts on that mass due to these two masses. Consider a system shown in figure.
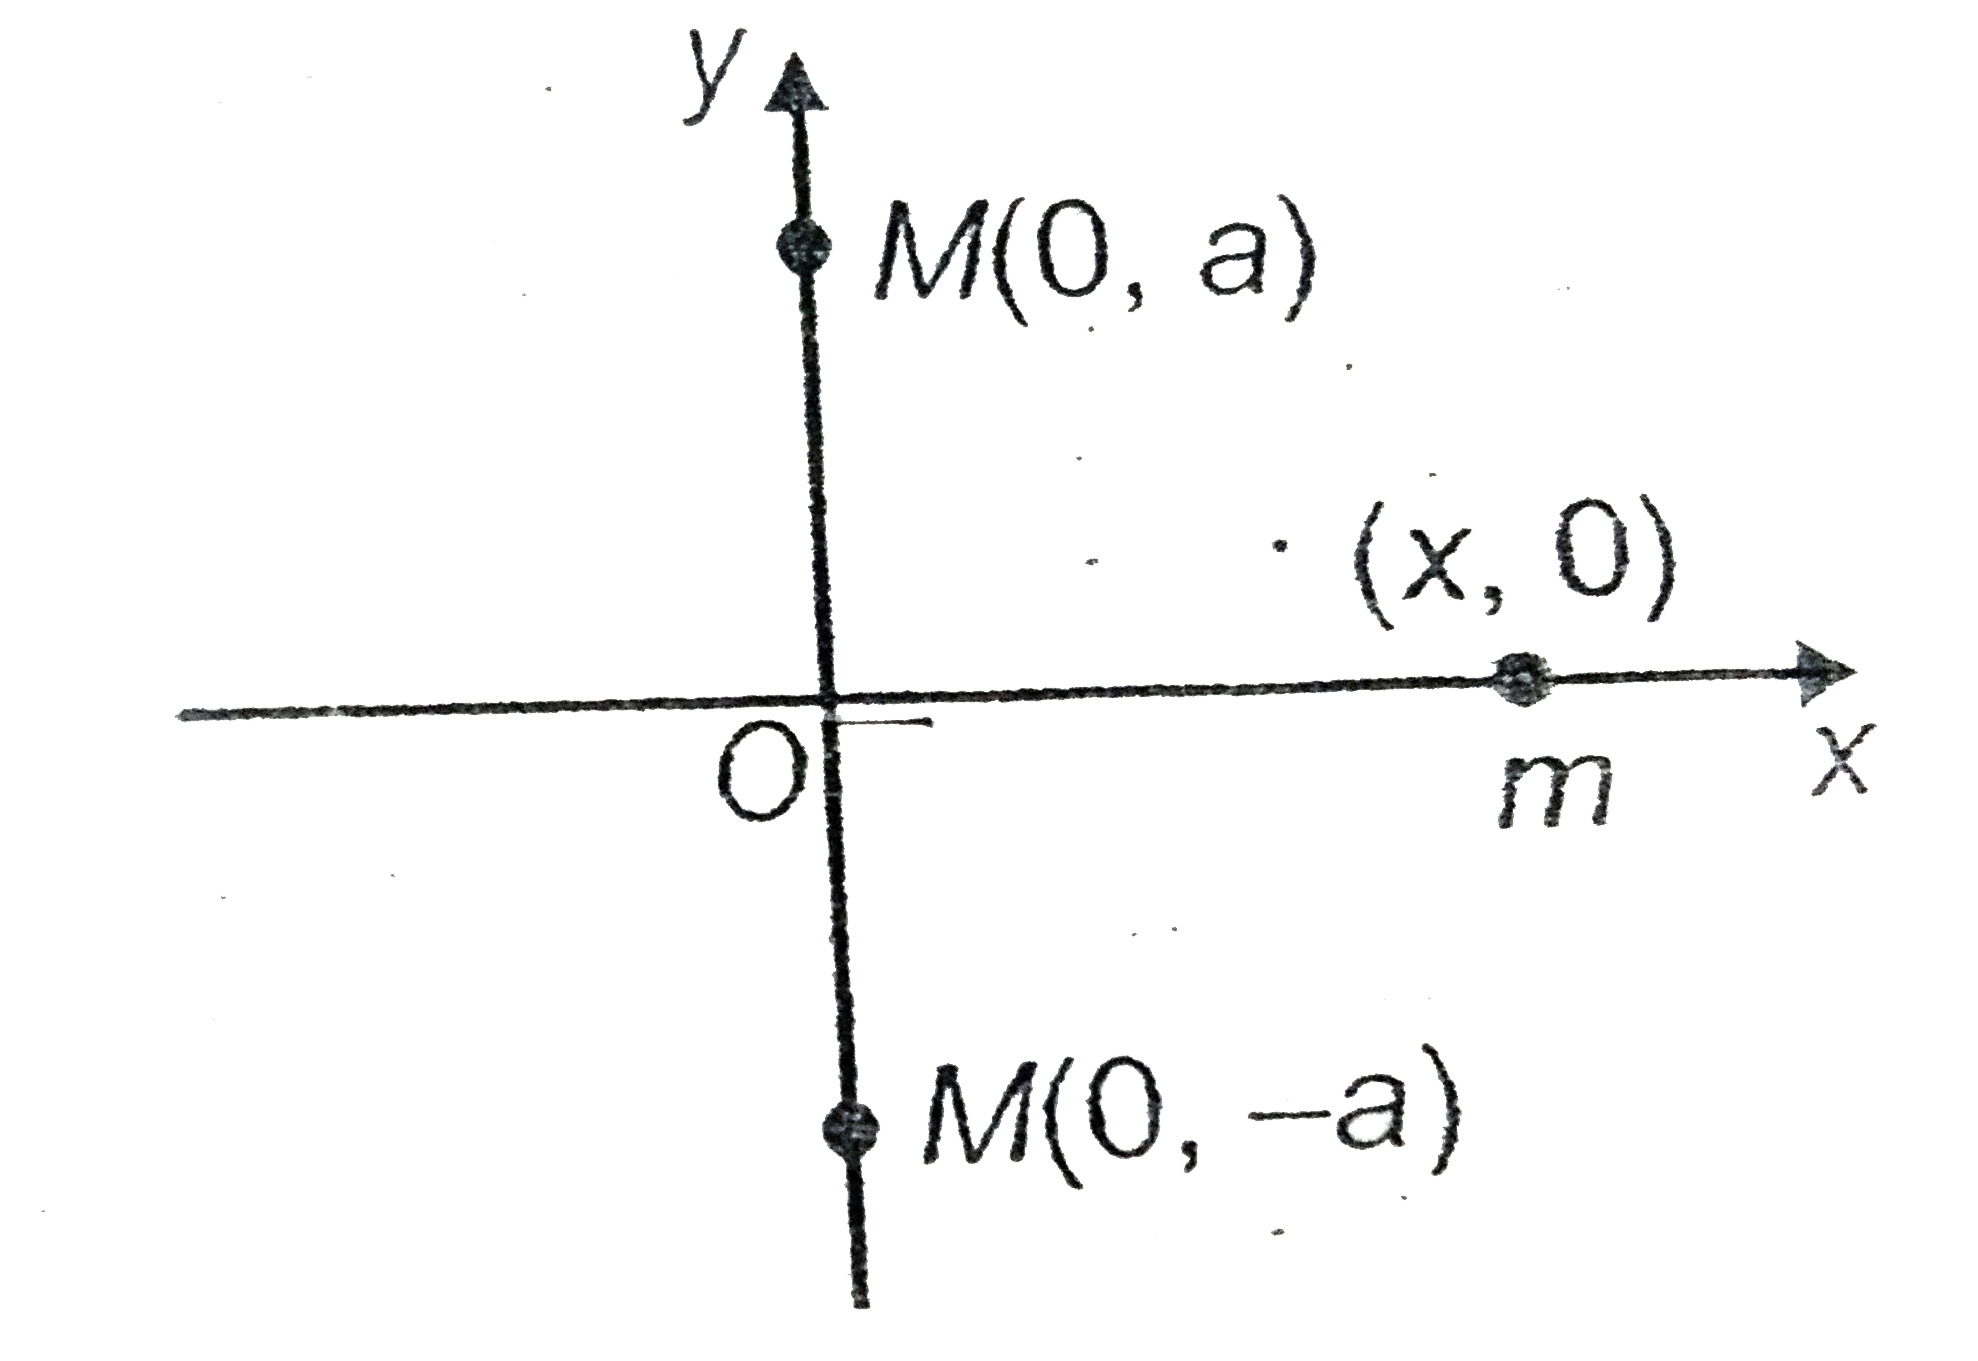
In this system two point masses of mass M each are placed at y-axis at a distance a from origin and these masses are fixed. If a third point mass of mass m is released at a distance x from origin on x-axis, then answer the following questions.
Which of the following graphs best represents the variation of force on mass m with distance x ?
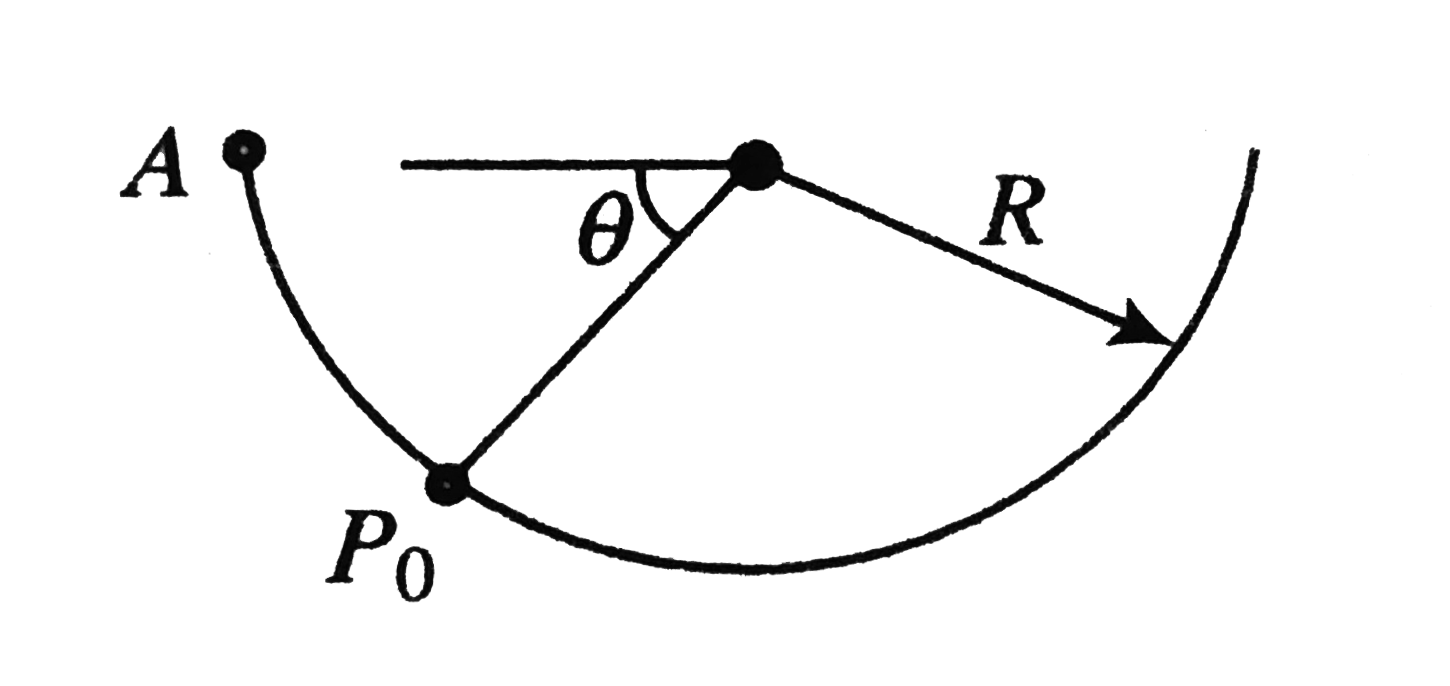
View SolutionA bead of mass m is released from rest at A to move along the fixed smooth circular track as shown in figure. The ratio of magnitudes of centripetal force and normal reaction by the track on the bead at any point P0 described by the angle θ(≠0) would
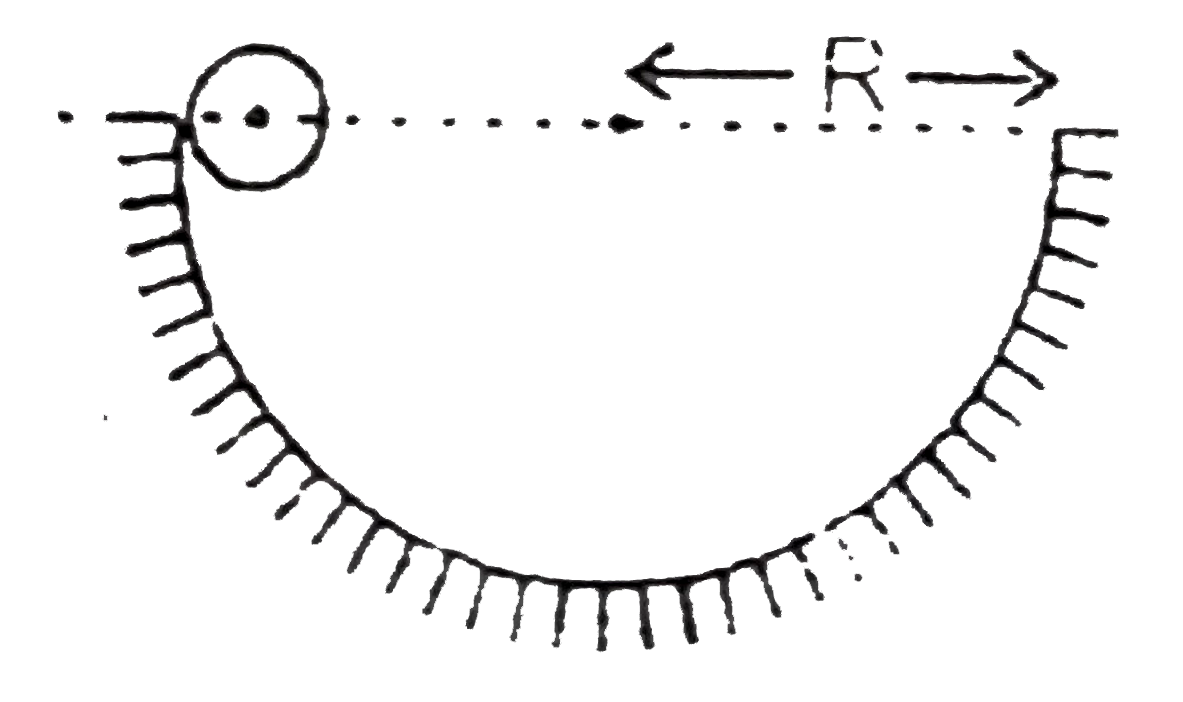
View SolutionIn the figure shown, a small ball of mass 'm' can move witgout sliding in a fixed semicircular track of radius R in vertical planet. It is released from the top. The resultant force on the ball at the lowest of the track is
View SolutionA ladder is leaned against a smooth wall and it is allowed to slip on a frictionless floor. Which figure represents the track of its centre of mass ?
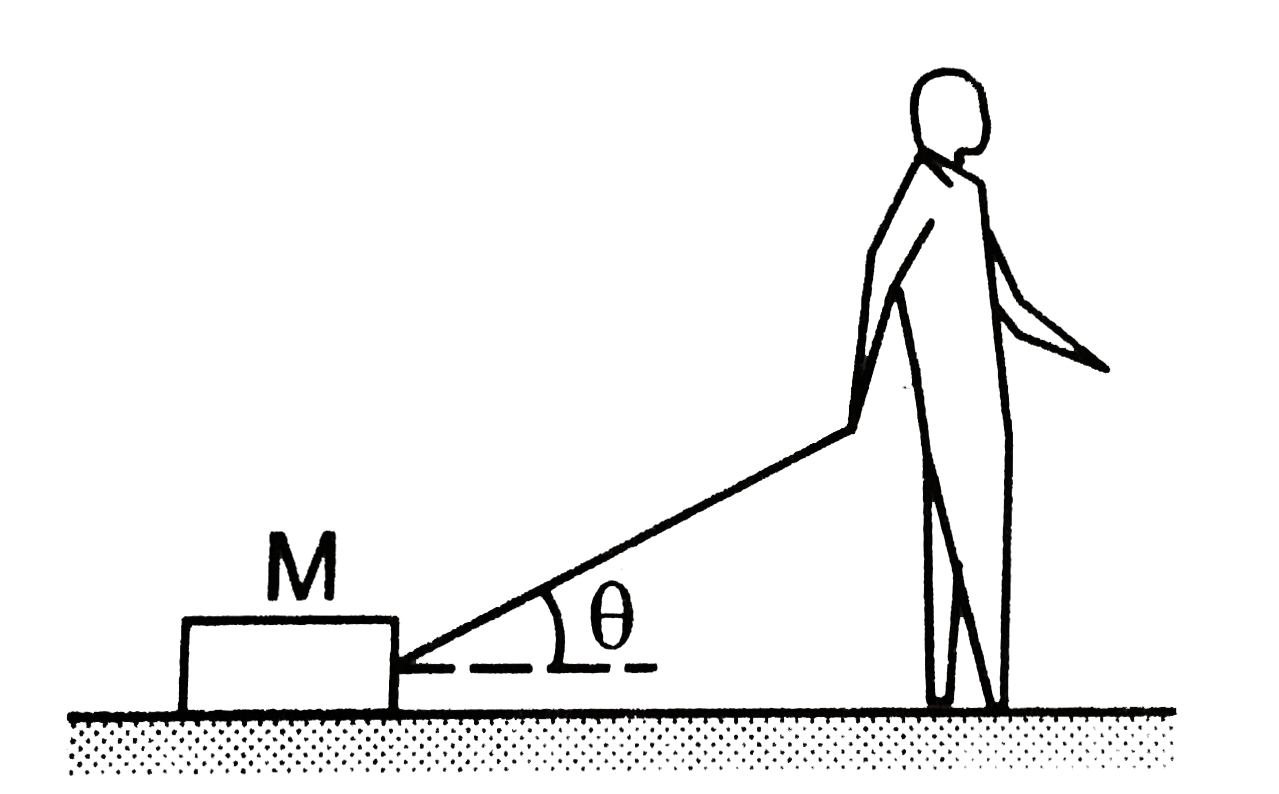
View SolutionA block of mass M is pulled on a smooth horizontal table by a string making an angle θ with the horizontal as shown in figure. If the acceleration of the block is a find the force applied by the string and by the table N on the block.
View Solution

