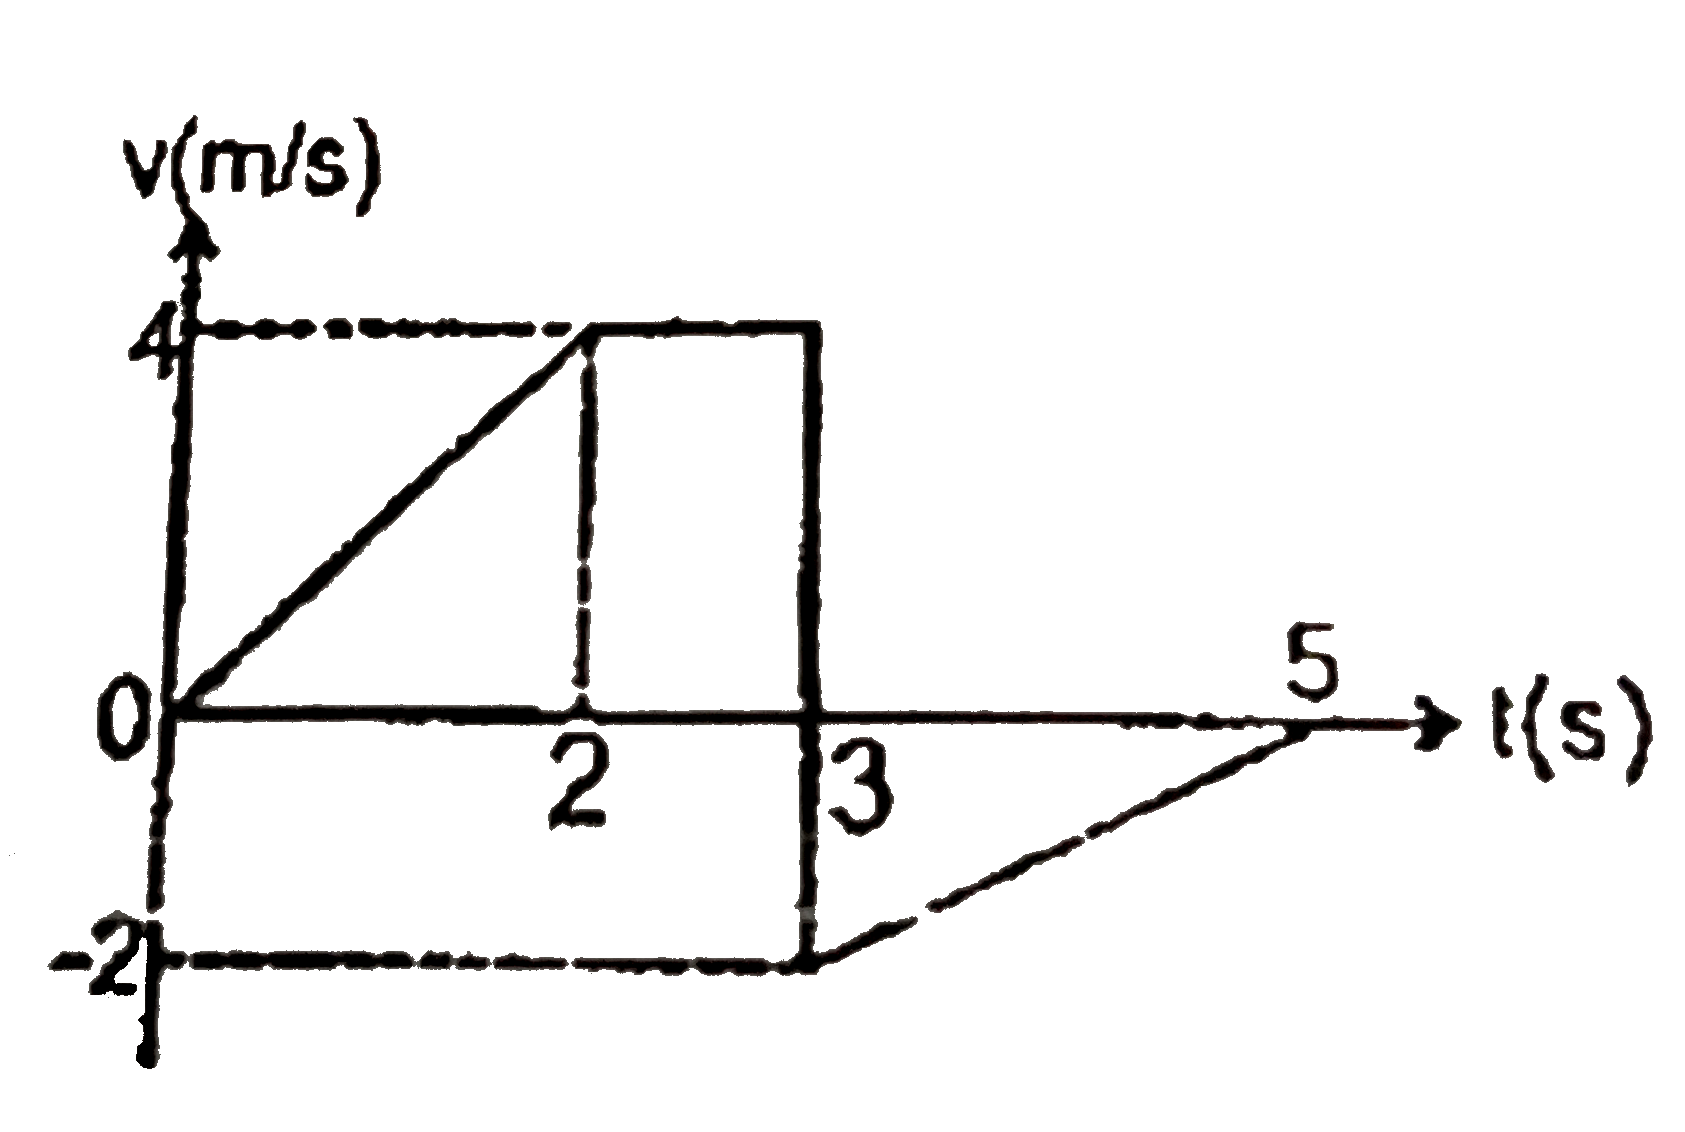
A particle moves along a horizontal line and its velocity changes with time as shown in the figure.
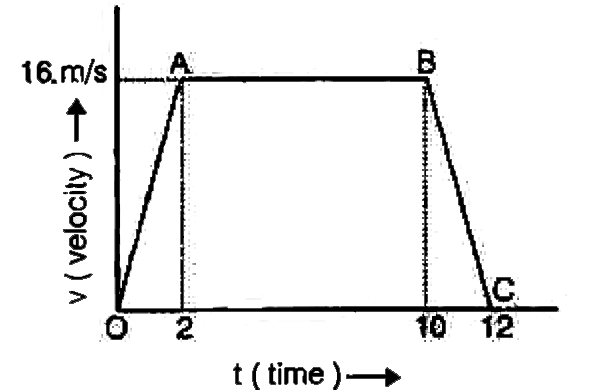
Calculate (i)initial acceleration, (ii)total distance described . Plot the x-t graph of the motion.
Step by step video & image solution for A particle moves along a horizontal line and its velocity changes with time as shown in the figure. Calculate (i)initial acceleration, (ii)total distance described . Plot the x-t graph of the motion. by Physics experts to help you in doubts & scoring excellent marks in Class 11 exams.
Updated on:21/07/2023Topper's Solved these Questions
Similar Questions
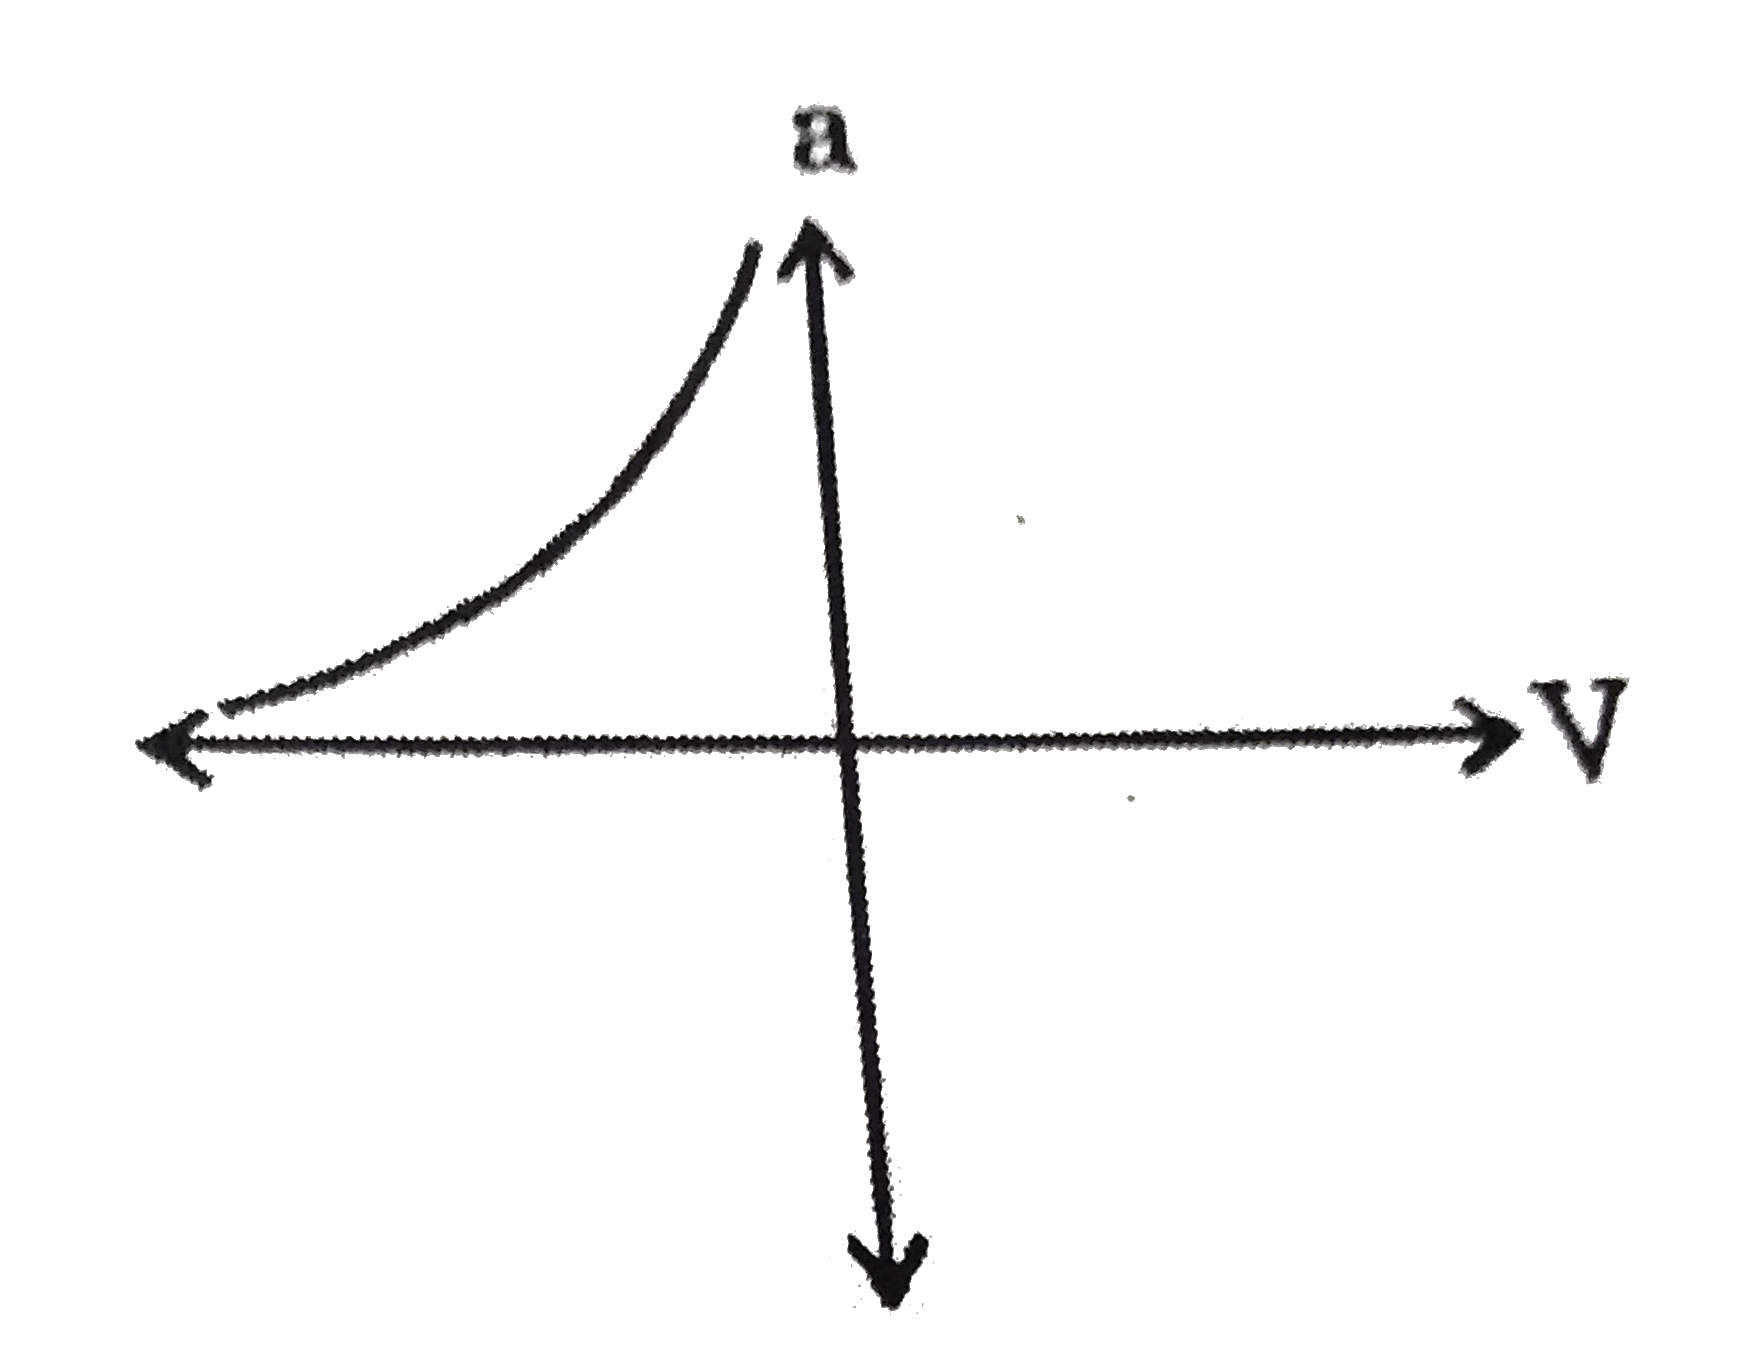
A particle moves in straight line. Acceleration of particle changes with velocity as showns in graph:
View SolutionA particle moves on straight line according to the velocity-time graph shown in fig. Calculate -
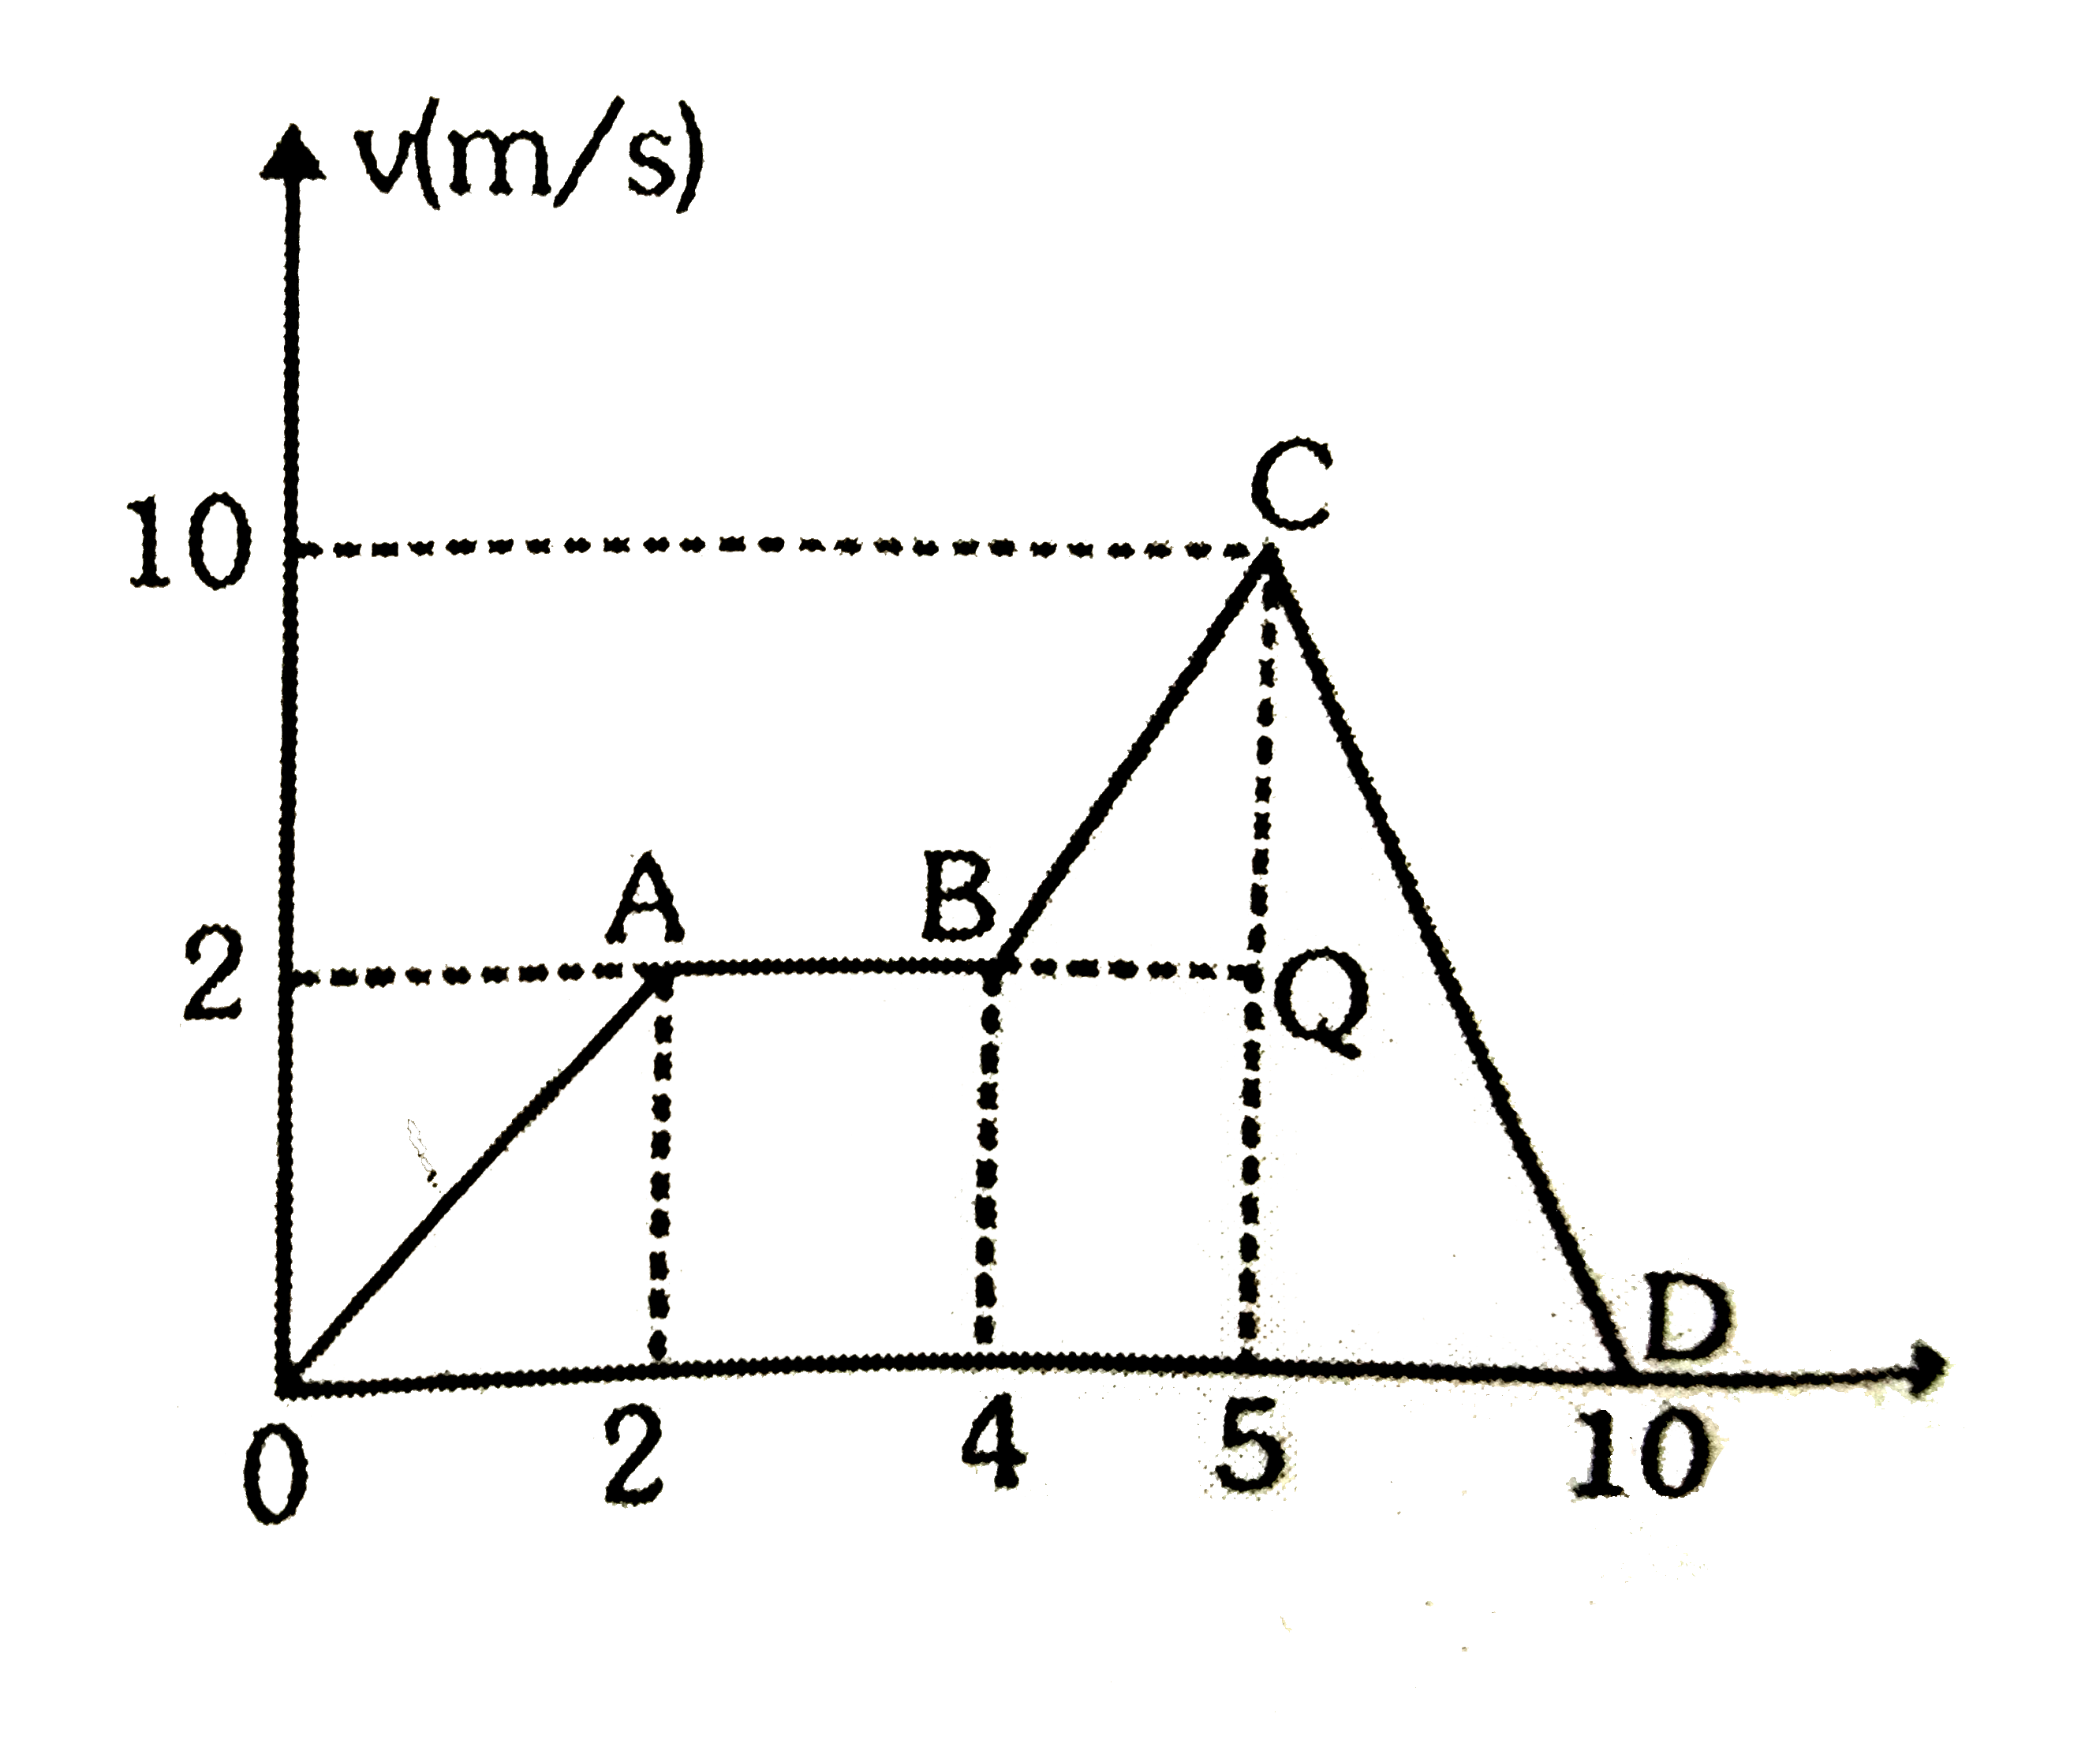
(i) Total distance covered
(ii) Average speed
(iii) In which part of the graph the acceleration is maximum and also find its value.
(iv) Retardation
View Solution
Knowledge Check
A particle moves along a horizontal straight line with a velocity-time relationship as shown in the figure-1.129. The total distance moved by the particle is :
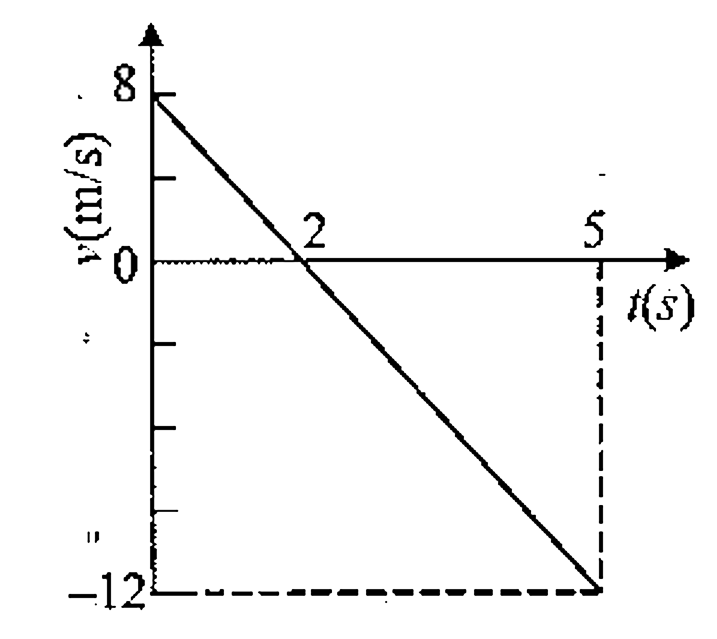 A39 mB13 mC26 mD2.6 m
A particle is moving on a straight line such that square of its velocity is directly proportional to distance as shown in graph. What is the acceleration of the particle ?
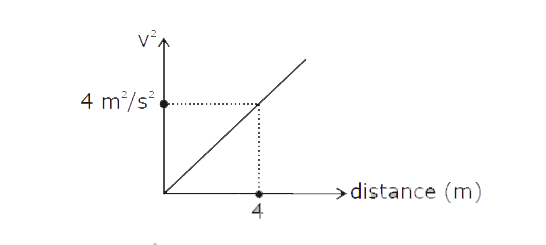 A14m/s2B1m/s2C2m/s2D12m/s2
The v-x graph for a particle moving along a straight line is shown in the figure. At which of the points marked, the acceleration is negative?
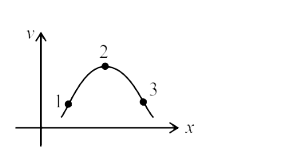 A1B3C1 and 2D3 and 2
The velocity of a particle moving along a straight line varies with time as shown in the Figure. Find the total distance covered and the total displacement between 0 and 20 seconds.
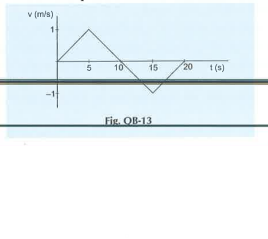
View SolutionFor a particle moving in a straight line, the velocity-time graph is as shown in the figure. Find the acceleration at time t=1s2.5s and 5s. Sketch the acceleration time graph.
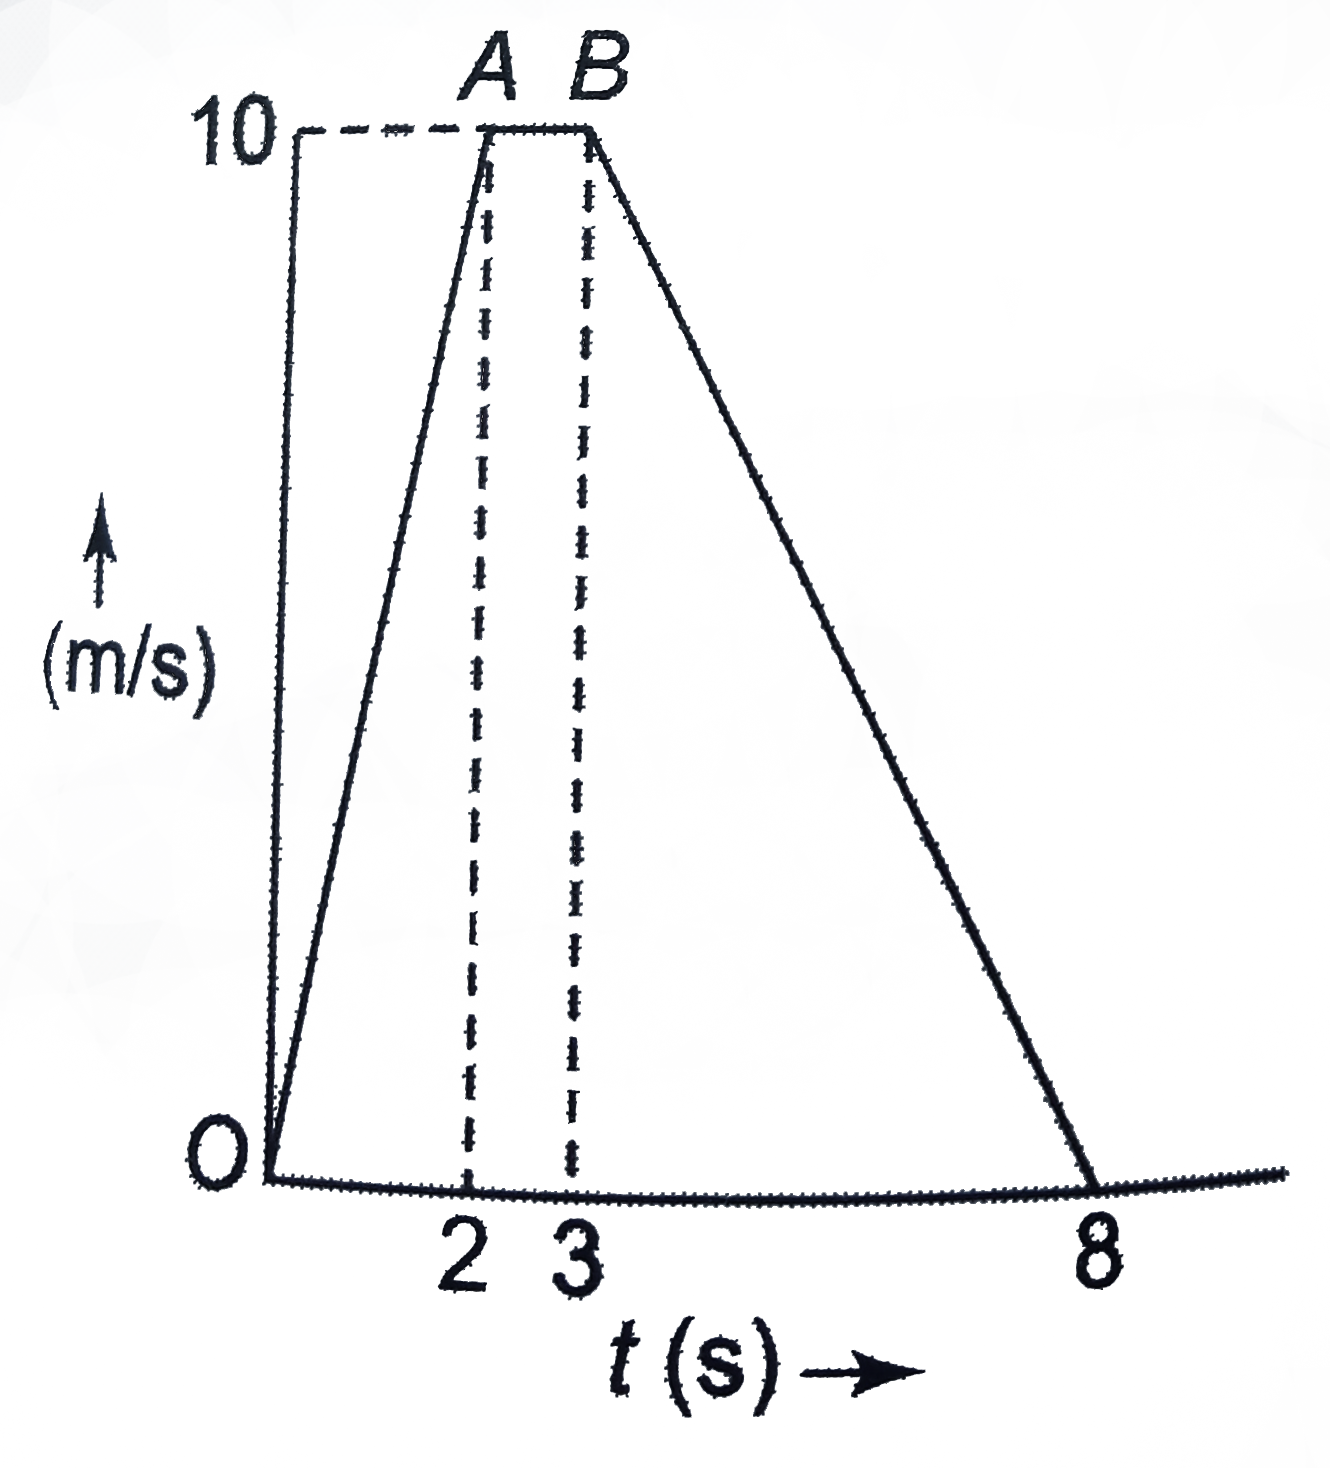
View SolutionA material particle is moving along a straight line in such a manner that its velocity varies as shown in the figure. At which moment in time numbered successively on the time axis will the acceleration of the particle be maximal? How should one use the graph to determine the average velocity of motion over the time interval from t1 to t2 ?
View SolutionFor a particle moving along x-axis, velocity-time graph is as shown in figure. Find the displacement of the particle?
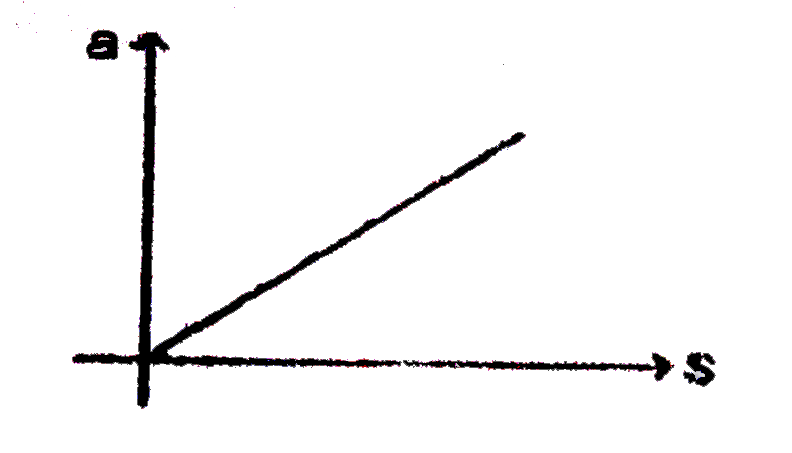
View SolutionAcceleration (a) -displacement (s) graph of a particle moving in a straight line is as shown in the figure. The initial velocity of the particle is zero. The v−s graph of the particle would be
View Solution

