
the graph above that summarizes a survey of a group of 250 people who were randomly selected when leaving a multiplex movie threater and asked what type of movie they had seen.
Q. The percent of the people surveyed saw either an action or a science fiction movie?
The correct Answer is:44
Step by step video, text & image solution for the graph above that summarizes a survey of a group of 250 people who were randomly selected when leaving a multiplex movie threater and asked what type of movie they had seen. Q. The percent of the people surveyed saw either an action or a science fiction movie? by Maths experts to help you in doubts & scoring excellent marks in Class 12 exams.
Updated on:21/07/2023Topper's Solved these Questions
- PROBLEM SOLVING AND DATA ANALYSISBook:ENGLISH SATChapter:PROBLEM SOLVING AND DATA ANALYSISExercise:Multiple Choice
Explore 128 Videos
- PROBLEM SOLVING AND DATA ANALYSISBook:ENGLISH SATChapter:PROBLEM SOLVING AND DATA ANALYSISExercise:EXERICSE
Explore 80 Videos
- PROBLEMS IN CONTEXT Book:ENGLISH SATChapter:PROBLEMS IN CONTEXT Exercise:PRACTICE TEST
Explore 10 Videos
Similar Questions
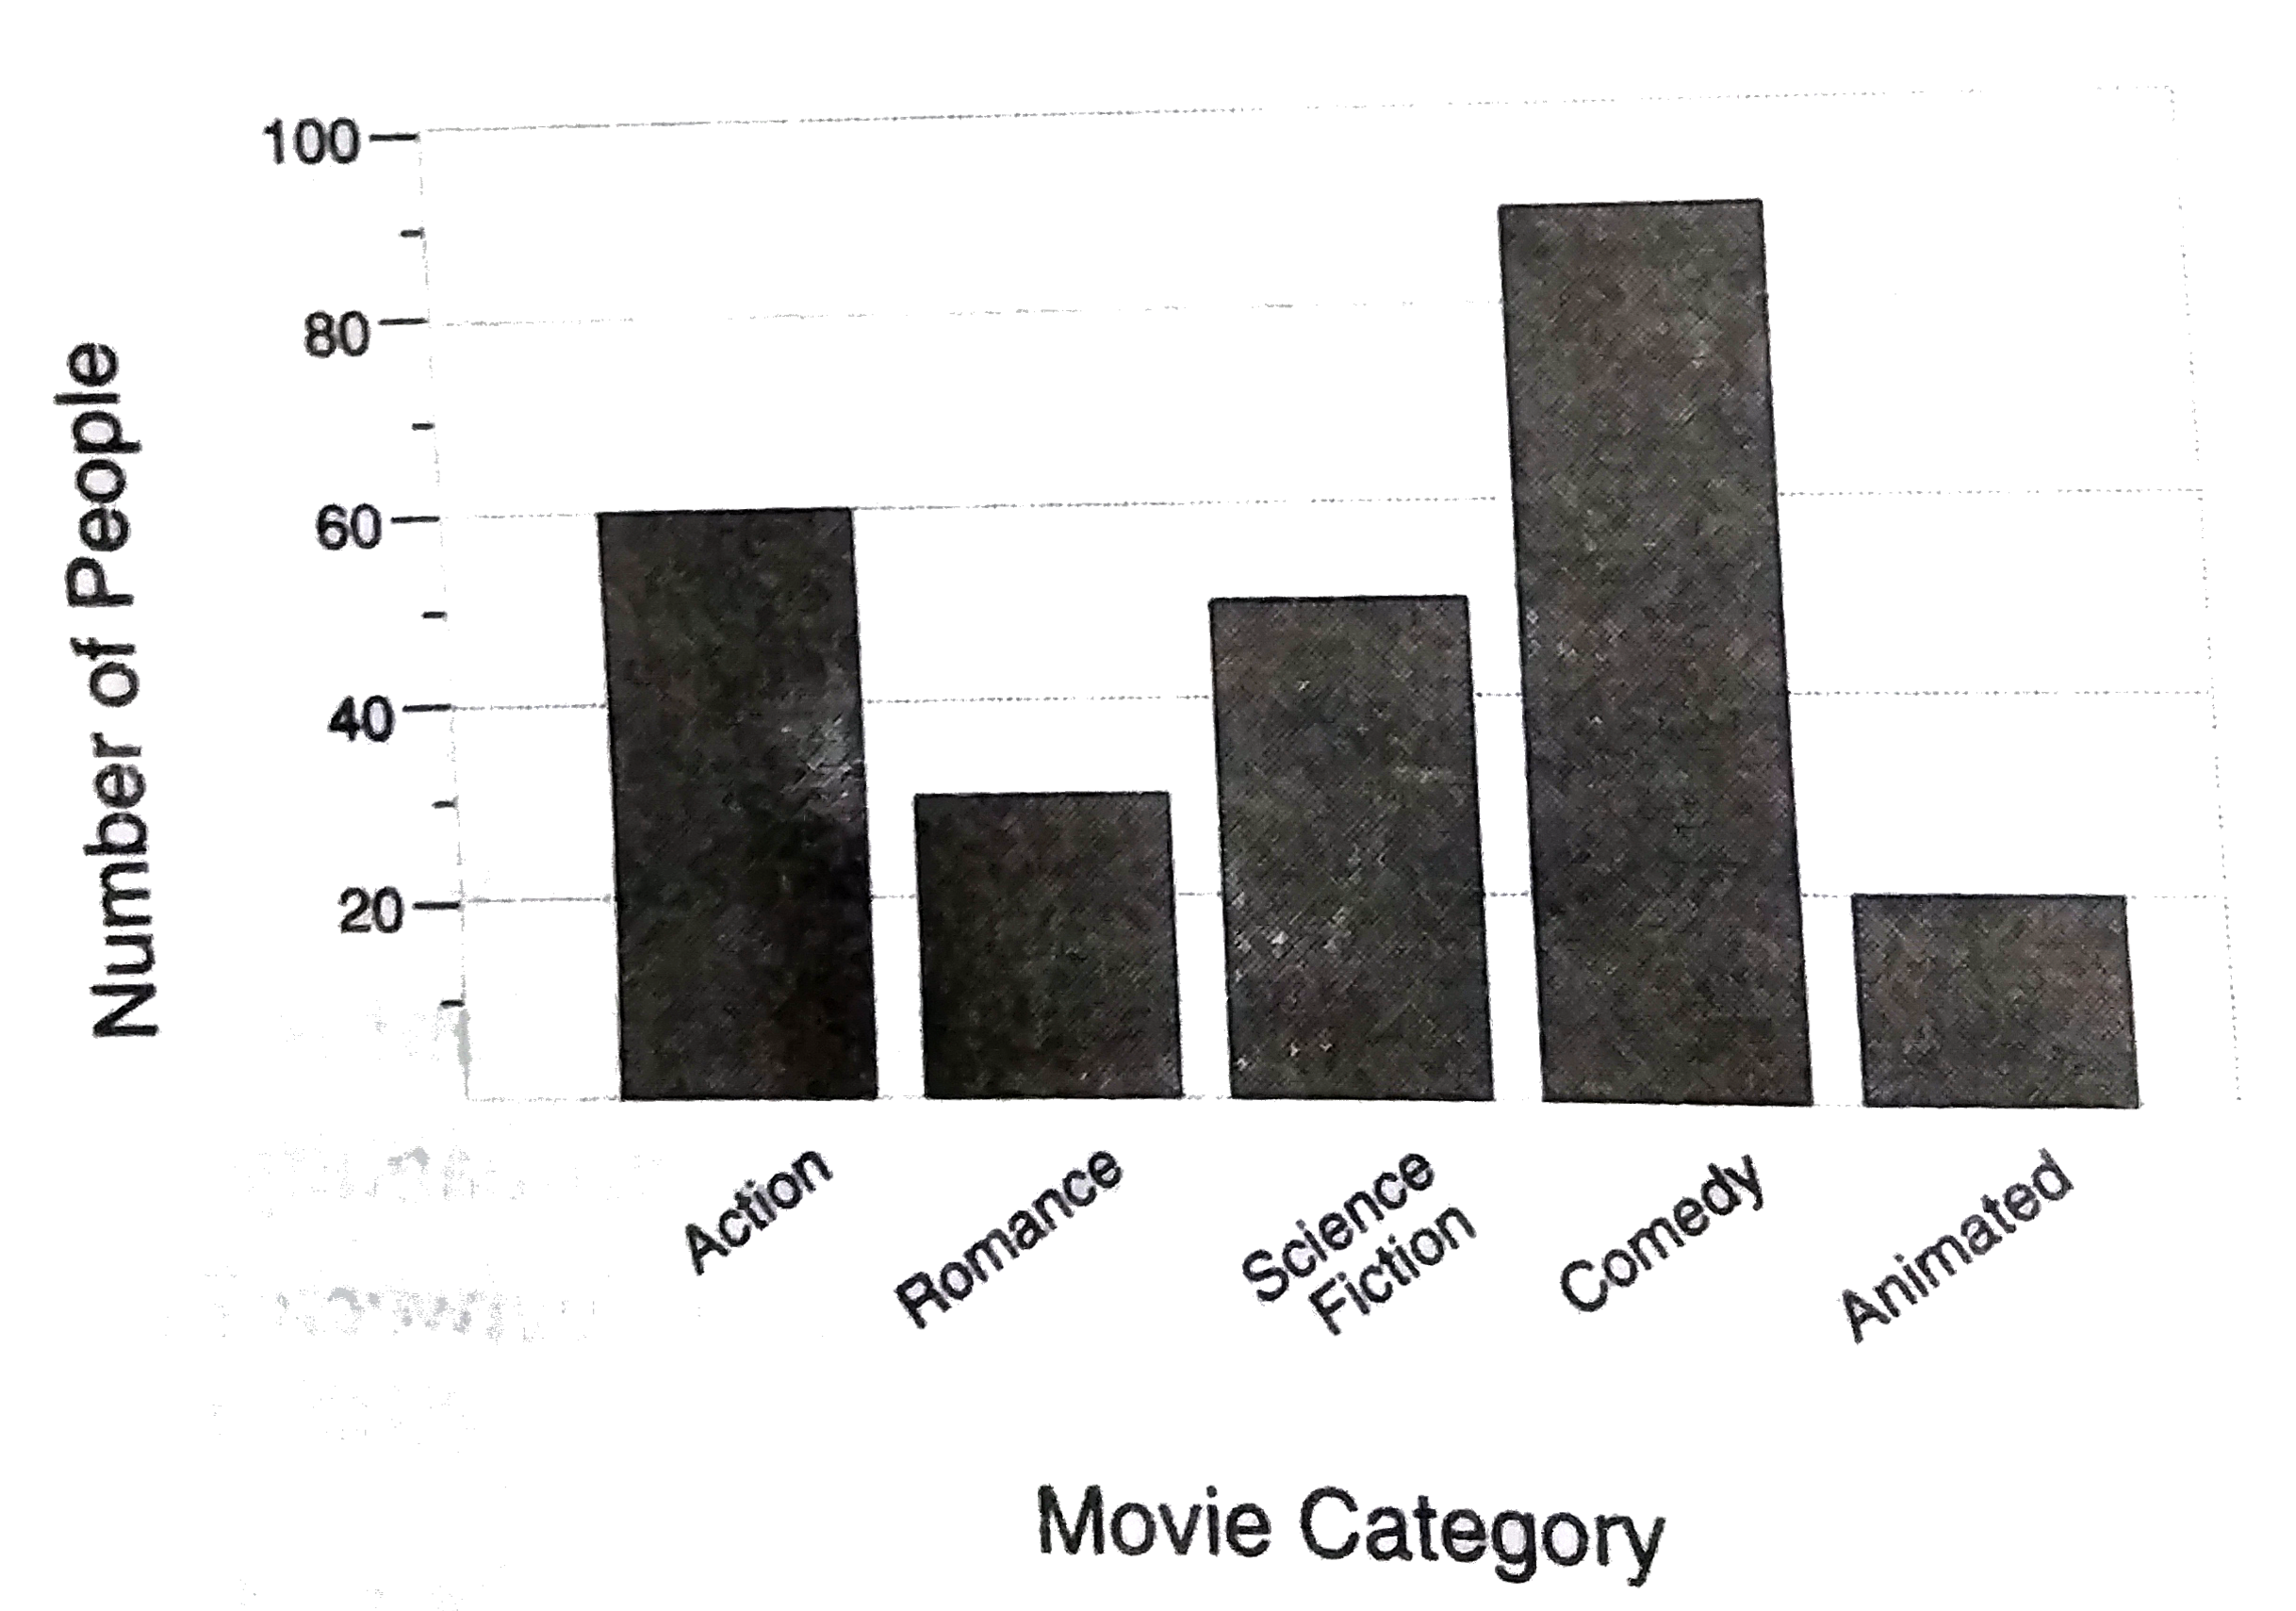
Question 1 and 2 refer to the graph above that summarizes a survey of a group of 250 people who were randomly selected when leaving a multiplex movie threater and asked what type of movie they had seen.
Q. If a total of 1,700 tickets were sold for the five types movies represented in the histogram, what is the best estimate for the number of tickets sold to the Ramance movie?
View Solution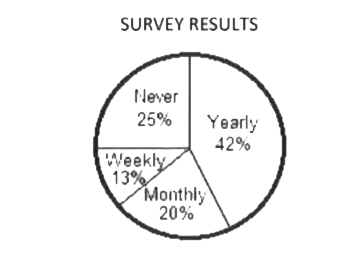
The circle graph abvoe shows the distribution of responses to a survey in which a group of people were asked how often they donate to charity. What fraction of those surveyed reported that they donate at least yearly?
View Solution
Knowledge Check
A market researcher selected 200 people at random from a group of people who indicated that they liked a certain book. The 200 people were shown a movie based on the book and then asked whether they liked or disliked the movie. Of those surveyed, 95% said they disliked the movie. Which of the following inferences can appropriately be drawn from this survey result?
AAt least 95% of people who go see movies will dislike this movie.BAt least 95% of people who read books will dislike this movie.CMost people who dislike this book will like this movie.DMost people who like this book will dislike this movie.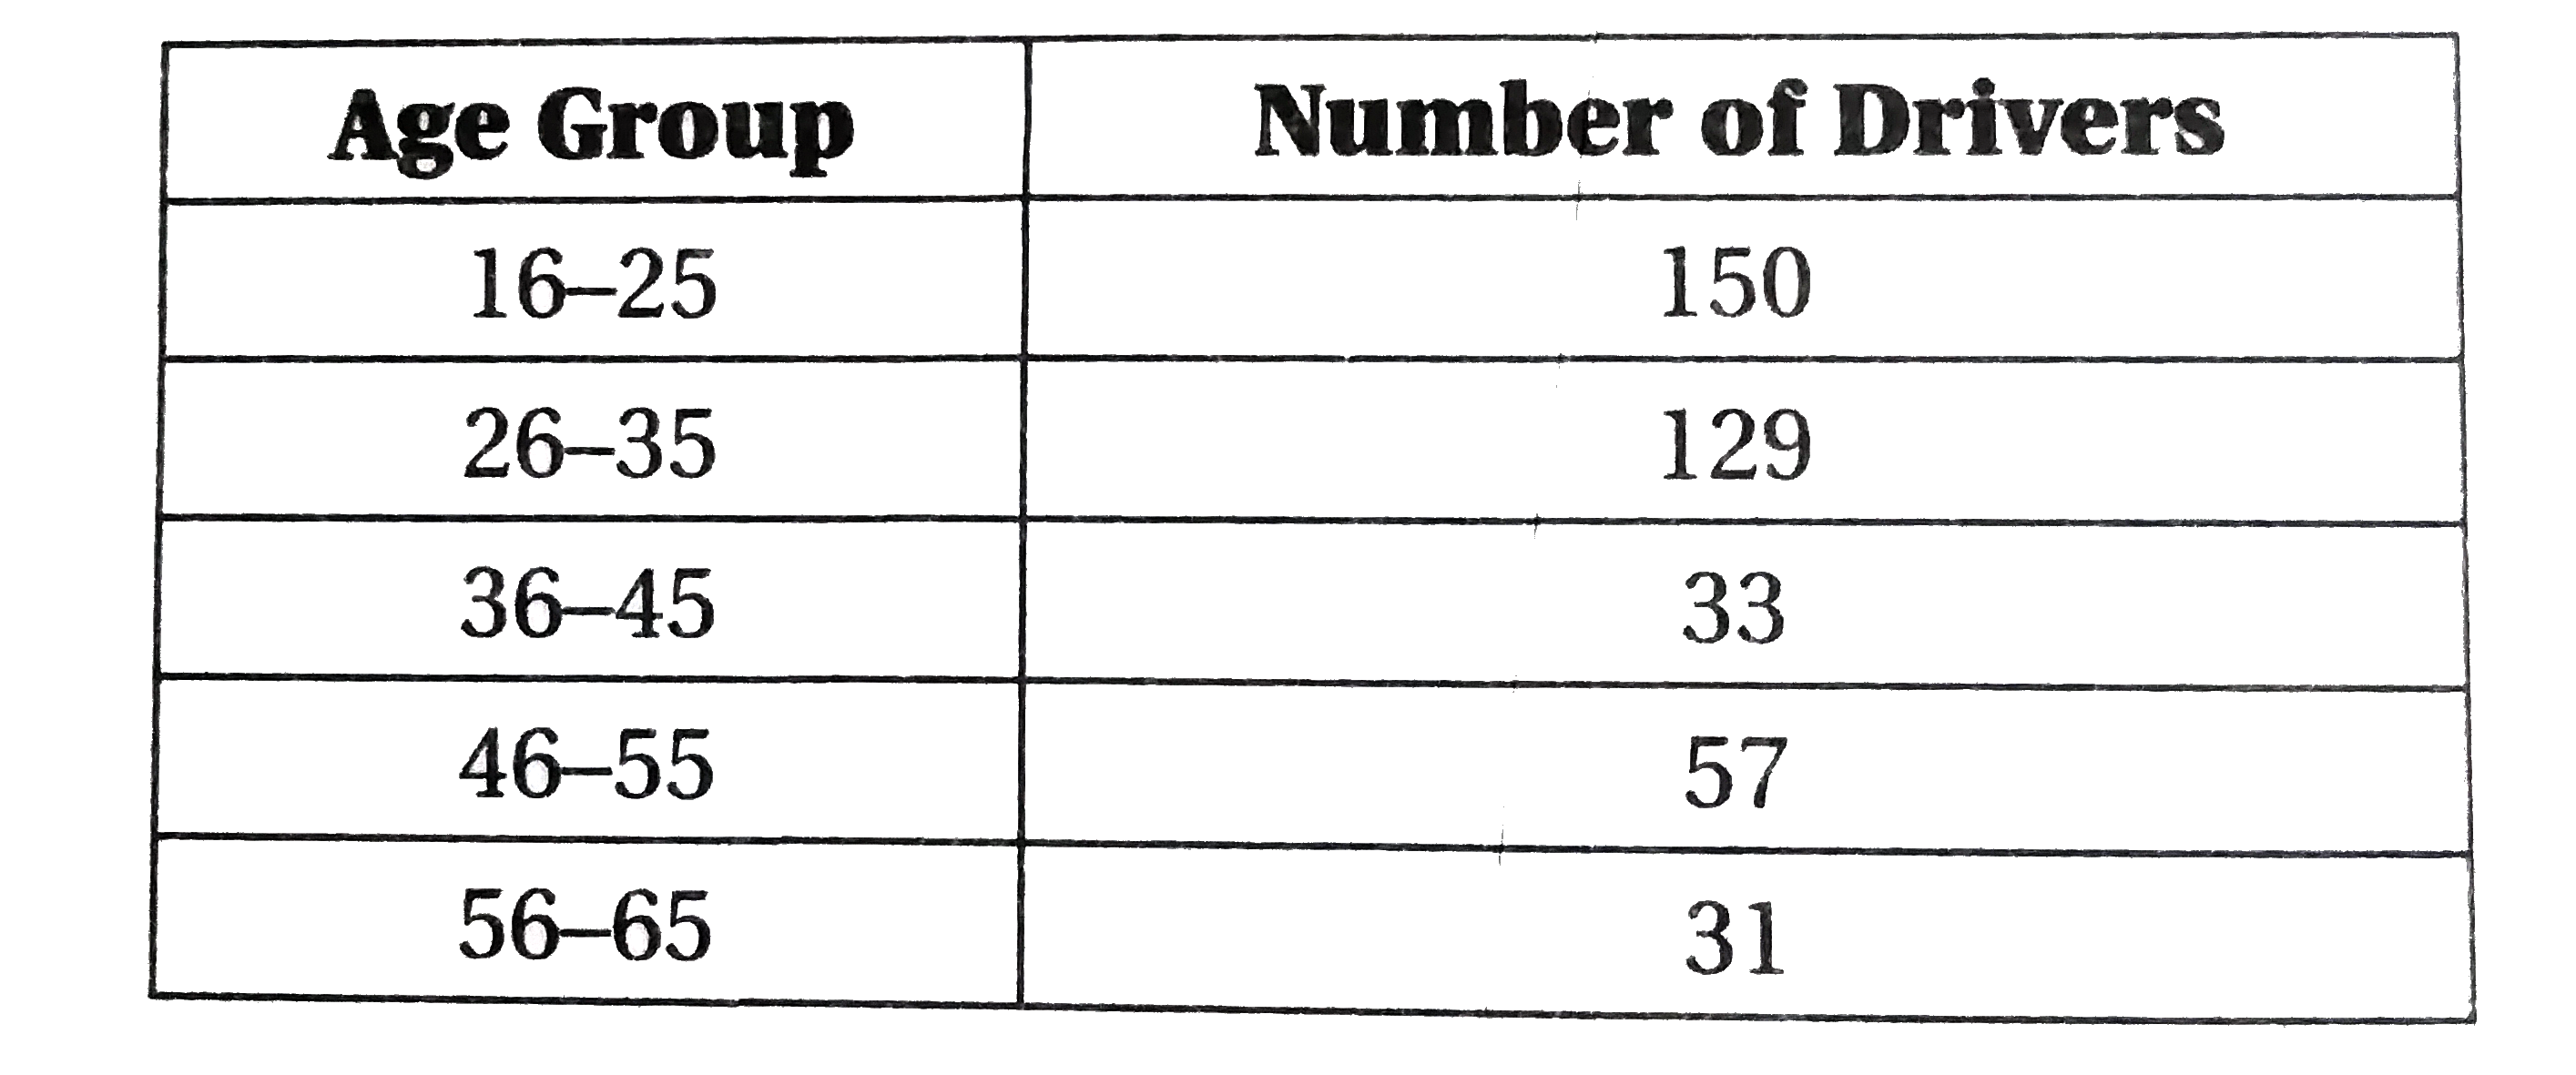
The table above summarizes the number of people by age group who were included in a survey of driving habits. Which of the following statements is true?AThe survey was not biased since different age groups were included.BThe survey was biased becouse individuals 36 and older were underrespresented.CThe survey was biased because it did not differentiate between males and femalesDThe survey was not biased since a large number of drivers were polled.The table below shows the results of a survey of 250 people who were asked whether they like to read and whether they play a musical instrument.
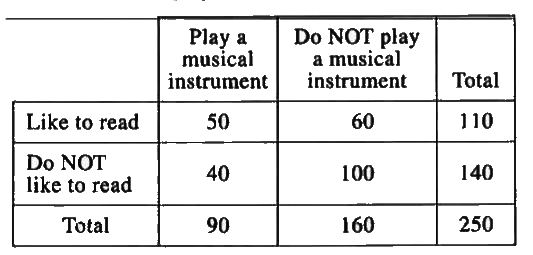
According the the results, what is the probability that a randomly selected person who was surveyed likes to read, given that the person plays a musical instrument?A15B59C511D925

The table above summarizes the result of a survey taken at the end of last year's flu seson. What fraction of the people who got the flu were unvaccinnated?
View SolutionA psychology student randomly selected 300 people from a group of people who indicated that they preferred to work alone. Those 300 people were given a task to work on individually and then asked whether they were happy or unhappy while doing the task. OF those surveyed ,5% stated they are unhappy while doing the task. Which of the following inferences can appropriately be drawn from this survey result?
View SolutionWas the Hoax a Hoax?
For an hour on the evening of October 30, 1938, Orson Welles and other performers from the Mercury Theatre flooded the airwaves with alarming “news bulletins” about a Martian invasion supposedly occurring in Grover’s Mill, New Jersey. They were performing a radio play adapted from The War of the Worlds, a science fiction novel by H. G. Wells. The next day, a front-page 34 headline in the New York Times declared–––––––––––––––––––––––––––––––––––––––––––––, “Radio Listeners in Panic, Taking War Drama as Fact.” 35 The Times article claimed that people had fled their homes and that police stations had been swamped with calls–––––––––––––––––––––––––––––––––––––––––––––––––––––––––––––––––––––––––––––––––––––––––––––––––––––––––––––––––––––––––. This version of events persisted, and the legend became that Welles’s broadcast had as many as twelve million people 36who feared–––––––––––– that Martians had invaded Earth.
Recently, however, scholars have questioned the accuracy of this legend, suggesting the degree of public hysteria has been grossly exaggerated. The authors of an article published in October 2013 go 37 so far–––––– to assign blame for the distortion to the newspaper industry 38 At this time–––––––––––––, Jefferson Pooley and Michael Socolow, both professors of communication studies, argue that the newspaper industry sought to discredit the newly emerging technology of radio, which was cutting into newspapers’ 39 profits. The newspaper industry tried to do this by portraying––––––––––––––––––––––––––––––––––––––––––––––––––––––––––––––––––– the new medium as irresponsible
[1] Proof of ulterior motives is scarce,
40 consequently weakening Pooley and Socolow’s argument.–––––––––––––––––––––––––––––––––––––––––––––––––––––––––––––– [2] For instance, the C. E. Hooper ratings indicate that a mere 2 percent of households had tuned in to the broadcast. [3] Pooley and Socolow also call into question the validity of an oft-cited report that was based on a survey conducted six weeks after the broadcast. [4] Just because some people found the broadcast unsettling, the authors contend, doesn’t mean they believed it and reacted with real terror. [5] According to this report, one million people indicated that they had been “frightened” by the broadcast. [6] Ratings, however, reveal that 41 far fewer than––––––––––––––– a million people had been listening to the broadcast. [7] Furthermore, Pooley and Socolow note that this survey conflated being ‘frightened,’ ‘disturbed,’ or ‘excited’ by the program with being ‘panicked.’” 42
Pooley and Socolow describe a more likely scenario: most people who heard the broadcast understood they were listening to a piece of fiction, but 43 some being–––––––––––– influenced by the sensationalized news coverage afterward, later “remembered” being more afraid than they had been. The researchers also suggest that, 44 not unlike––––––––––– people who got caught up in the excitement of the story when reading about it in the newspaper, the American public may have been willing to embrace the legend because of its appeal to the imagination.
Which choice best establishes the main idea of the paragraph?
View SolutionWas the Hoax a Hoax?
For an hour on the evening of October 30, 1938, Orson Welles and other performers from the Mercury Theatre flooded the airwaves with alarming “news bulletins” about a Martian invasion supposedly occurring in Grover’s Mill, New Jersey. They were performing a radio play adapted from The War of the Worlds, a science fiction novel by H. G. Wells. The next day, a front-page 34 headline in the New York Times declared–––––––––––––––––––––––––––––––––––––––––––––, “Radio Listeners in Panic, Taking War Drama as Fact.” 35 The Times article claimed that people had fled their homes and that police stations had been swamped with calls–––––––––––––––––––––––––––––––––––––––––––––––––––––––––––––––––––––––––––––––––––––––––––––––––––––––––––––––––––––––––. This version of events persisted, and the legend became that Welles’s broadcast had as many as twelve million people 36who feared–––––––––––– that Martians had invaded Earth.
Recently, however, scholars have questioned the accuracy of this legend, suggesting the degree of public hysteria has been grossly exaggerated. The authors of an article published in October 2013 go 37 so far–––––– to assign blame for the distortion to the newspaper industry 38 At this time–––––––––––––, Jefferson Pooley and Michael Socolow, both professors of communication studies, argue that the newspaper industry sought to discredit the newly emerging technology of radio, which was cutting into newspapers’ 39 profits. The newspaper industry tried to do this by portraying––––––––––––––––––––––––––––––––––––––––––––––––––––––––––––––––––– the new medium as irresponsible
[1] Proof of ulterior motives is scarce,
40 consequently weakening Pooley and Socolow’s argument.–––––––––––––––––––––––––––––––––––––––––––––––––––––––––––––– [2] For instance, the C. E. Hooper ratings indicate that a mere 2 percent of households had tuned in to the broadcast. [3] Pooley and Socolow also call into question the validity of an oft-cited report that was based on a survey conducted six weeks after the broadcast. [4] Just because some people found the broadcast unsettling, the authors contend, doesn’t mean they believed it and reacted with real terror. [5] According to this report, one million people indicated that they had been “frightened” by the broadcast. [6] Ratings, however, reveal that 41 far fewer than––––––––––––––– a million people had been listening to the broadcast. [7] Furthermore, Pooley and Socolow note that this survey conflated being ‘frightened,’ ‘disturbed,’ or ‘excited’ by the program with being ‘panicked.’” 42
Pooley and Socolow describe a more likely scenario: most people who heard the broadcast understood they were listening to a piece of fiction, but 43 some being–––––––––––– influenced by the sensationalized news coverage afterward, later “remembered” being more afraid than they had been. The researchers also suggest that, 44 not unlike––––––––––– people who got caught up in the excitement of the story when reading about it in the newspaper, the American public may have been willing to embrace the legend because of its appeal to the imagination.
To make this paragraph most logical, sentence 4 should be placed
View Solution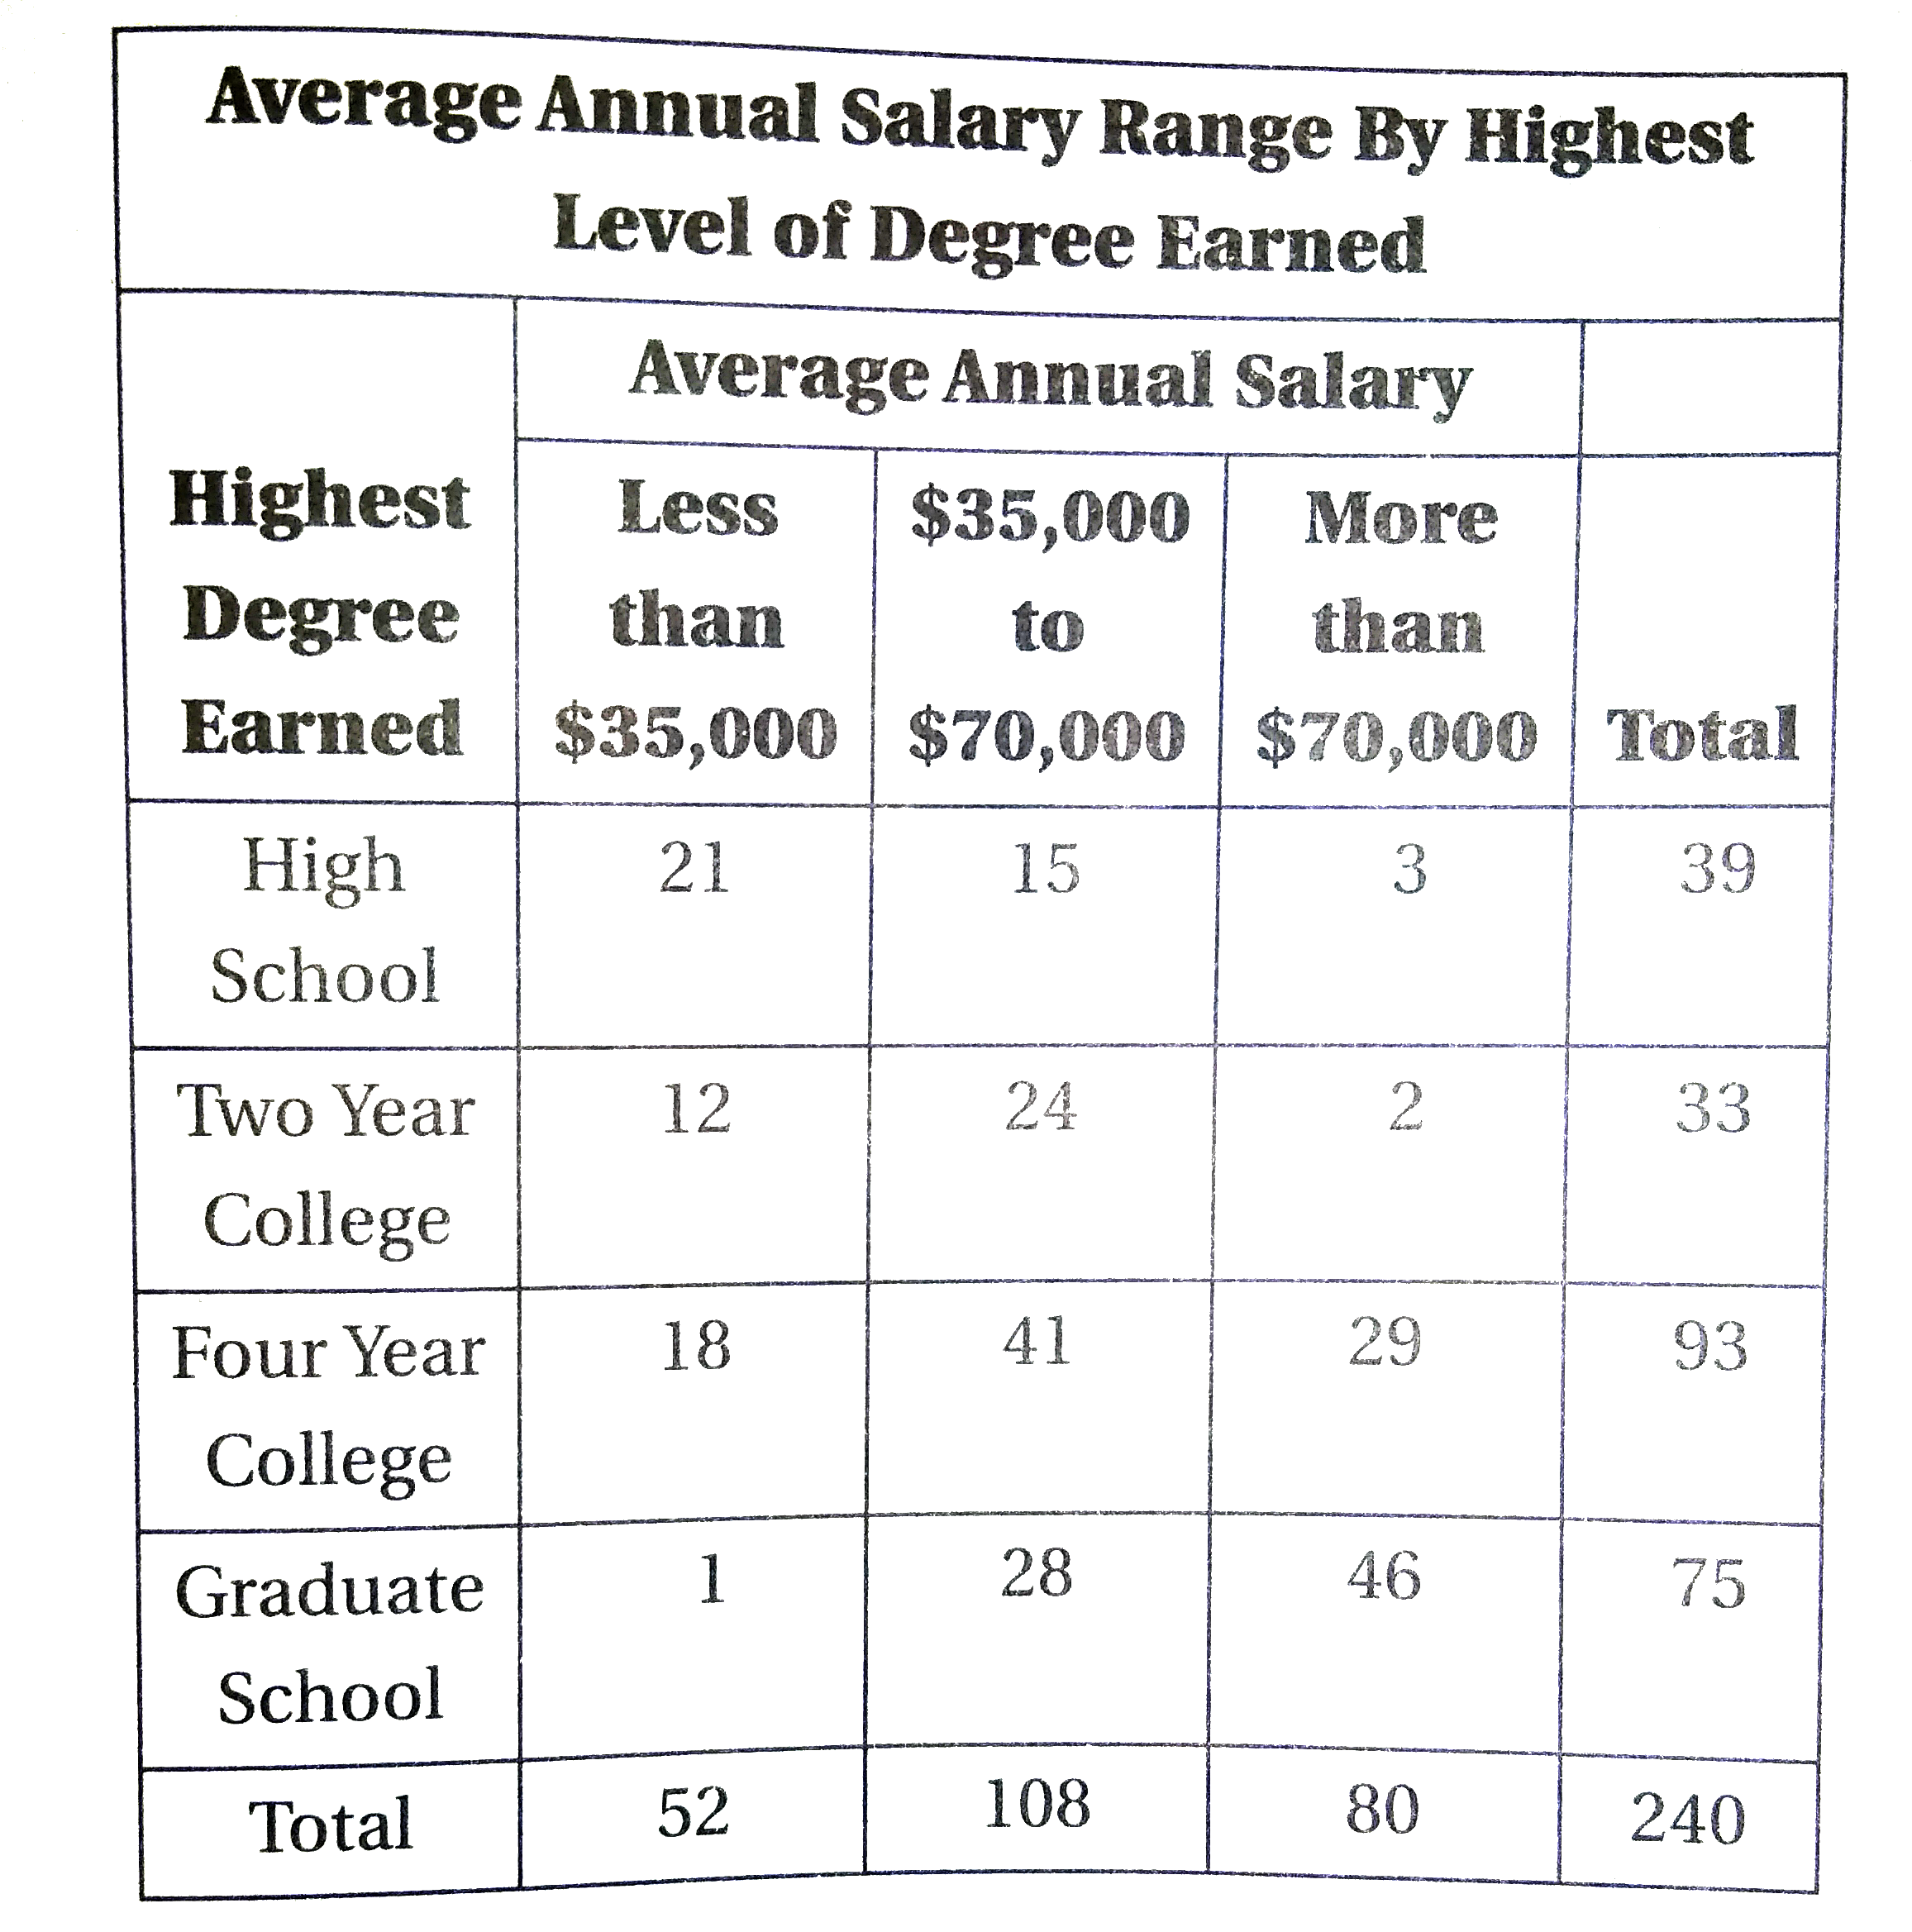
The table above summarizes the result of a survey taken in which 240 adults were asked about their education level and current annual salary. If a participant who reported earning $35,000 or more per year is selected at random, what is the best estimate of the probability that the person does not have a graduate school degreee?
View Solution

