The median of the following date is 525 . Find the valuse of x and y , the total frequencey is 100 . Here , C.I stands for class interval and fr for frequency .
Solution in Telugu
The correct Answer is:x = 9 , y = 15
Step by step video, text & image solution for The median of the following date is 525 . Find the valuse of x and y , the total frequencey is 100 . Here , C.I stands for class interval and fr for frequency . {:(CI,"Fr"),(0-100,2),(100-200,5),(200-300,x),(300-400,12),(400-500,17),(500-600,20),(600-700,y),(700-800,9),(800-900,7),(900-1000,4):} by Maths experts to help you in doubts & scoring excellent marks in Class 10 exams.
Updated on:21/07/2023Topper's Solved these Questions
- STATISTICSBook:VGS PUBLICATION-BRILLIANTChapter:STATISTICSExercise:THINK & DISCUSS
Explore 8 Videos
- STATISTICSBook:VGS PUBLICATION-BRILLIANTChapter:STATISTICSExercise:Do THESE
Explore 5 Videos
- SIMILAR TRIANGLES Book:VGS PUBLICATION-BRILLIANTChapter:SIMILAR TRIANGLES Exercise:CREATIVE BITS FOR CCE MODEL EXAMINATION
Explore 90 Videos
- SUMMATIVE ASSESSMENTBook:VGS PUBLICATION-BRILLIANTChapter:SUMMATIVE ASSESSMENTExercise:SUMMATIVE ASSESSMENT
Explore 61 Videos
Similar Questions
The mean value can be calculated from both ungrouped and grouped date . Which one you think is more accurate ? Why ?
View SolutionFind the mode of the following data.
5 ,6, 9 ,10 , 6,12 ,3,6, 11,10 , 4 , 6 , .
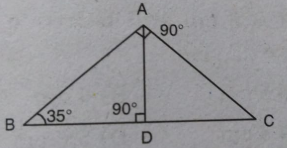
View SolutionFrom the figure ,∠DAC……….

View SolutionRamu says, "If log10x=0, value of x=0". Do you agree with him ? Give reason.
View SolutionFind the mean deviation about the mean for the data : Income 0-100 100-200 200-300 300-400 400-500 500-600 600-700 700-800per dayNumber 4 8 9 10 7 5 4 3of persons
View SolutionThe median of the following data is 525. Find the values of x and y , if the total frequency is 100 Class interval Frequency 0 100 2 100 200 5 200 300 x 300 400 12 400 500 17 500 600 20 600 700 y 700 800 9 800 900 7 900 1000 4
View SolutionThe median of the following data is 525. Find the missing frequency, if it is given that there are 100 observations in the data: Class interval Frequency Class interval Frequency 0 100 2 500 600 20 100 200 5 600 700 f2 200 300 f1 700 800 9 300 400 12 800 900 7 400 500 17 900 1000 4
View SolutionThe following table gives the life time of 400 neon lamps: Life time (in hours 300-400 400-500 500-600 600-700 700-800 800-900 900-1000 No. of lamps: 14 56 60 86 74 62 48 A bulb is selected at random. Find the probability that the life time of the selected bulb is : less than 400 between 300 to 800 hours at least 700 hours.
View SolutionFind the mean deviation from the mean for the following data: Classes 0-100 100-200 200-300 300-400 400-500 500-600 600-700 700-800 Frequencies 4 8 9 10 7 5 4 3
View SolutionSolve : 100x+200y=700
200x+100y=800
View Solutionनिम्न का पद विचलन विधि ( लघु विधि) से माध्य विचलन ज्ञात करो
वर्ग 0−100100−200200−300300−400400−500500−600600−700700−800fi 4 8 9 10 7 5 4 3
View SolutionFind the values of x and y which are the mean 525 of the following data and the sum of the constellations in the data is 100. (In the table CI stands for Class Spacing, Fr stands for Frequency).
View SolutionThe median of the following data is 525. Find the values of x and y , if the total frequency is 100. Here, CI stands for class interval and Fr for frequency.

View SolutionThe median of the following data is 525. Find the values of x and y , if the total frequency is 100. Here, CI stands for class interval and Fr for frequency.

View SolutionThe median of the following data is 525. Find the values of x and y , if the total frequency is 100. Classinterval0−100100−200200−300300−400400−500500−600600−700700−800800−900900−1000 Frequency 0 100 2 100 200 5 200 300 x 300 400 12 400 500 17 500 600 20 600 700 y 700 800 9 800 900 7 900 1000 4
View Solution

