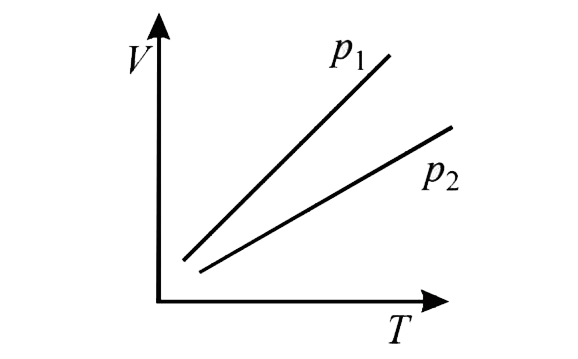
For V versus T curves at constant pressure P1andP2 for and ideal gas shown in figure-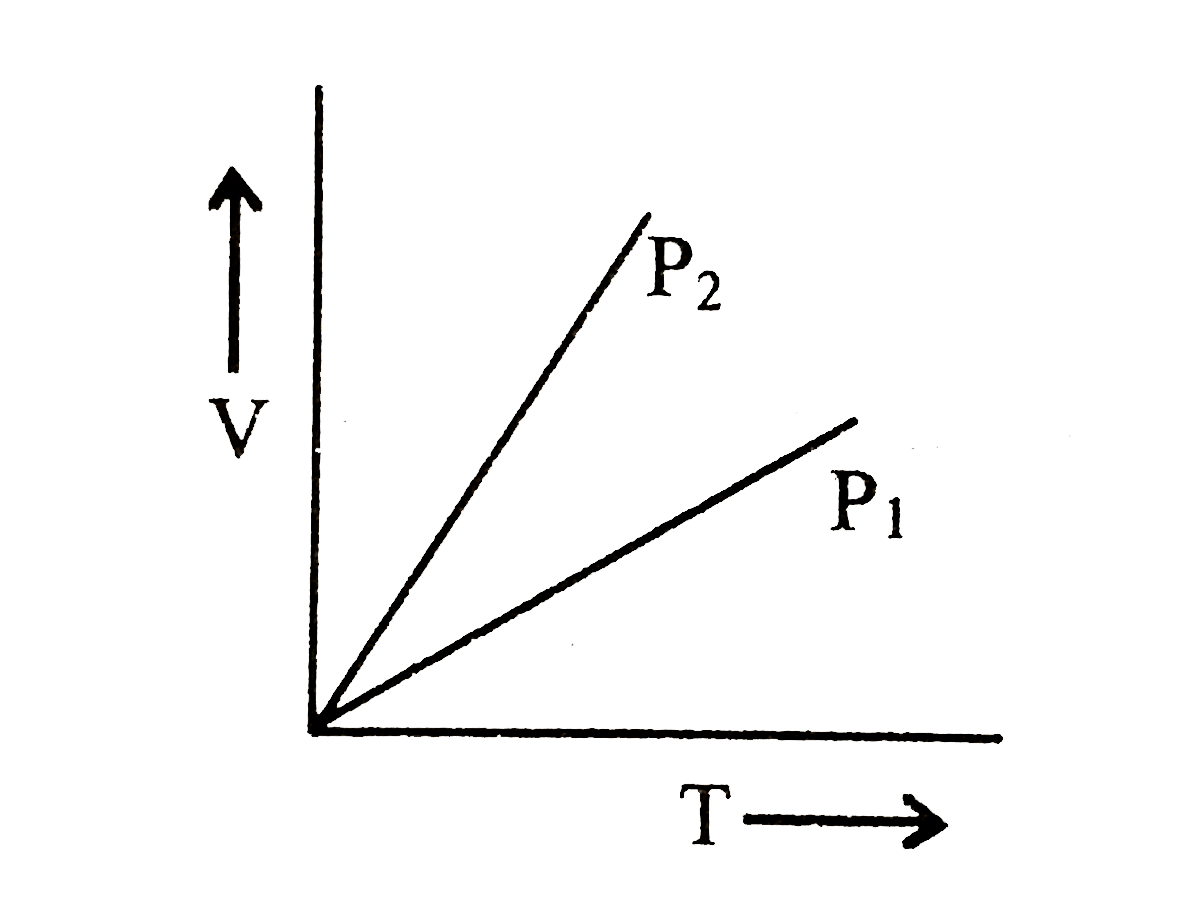
P1>P2
P1<P2
P1=P2
P1P2
The correct Answer is:A
Slope =nRP
P increases, slop decreases
Topper's Solved these Questions
- BOOK - BANSALCHAPTER - KINETIC THEORY OF GASESEXERCISE - Exercise-24videos
KINETIC THEORY OF GASES
- BOOK - BANSALCHAPTER - KINETIC THEORY OF GASESEXERCISE - Reasoning Type1videos
KINETIC THEORY OF GASES
- BOOK - BANSALCHAPTER - KINETIC THEORY OF GASESEXERCISE - Practice Exercise3videos
KINETIC THEORY OF GASES
- BOOK - BANSALCHAPTER - HEAT TRANSFEREXERCISE - Exercise89videos
HEAT TRANSFER
- BOOK - BANSALCHAPTER - UNIT DIMENSION, VECTOR & BASIC MATHSEXERCISE - Exercise10videos
UNIT DIMENSION, VECTOR & BASIC MATHS
Similar Questions
V vs T curves at different pressures P1 and P2 for an ideal gas are shown below:

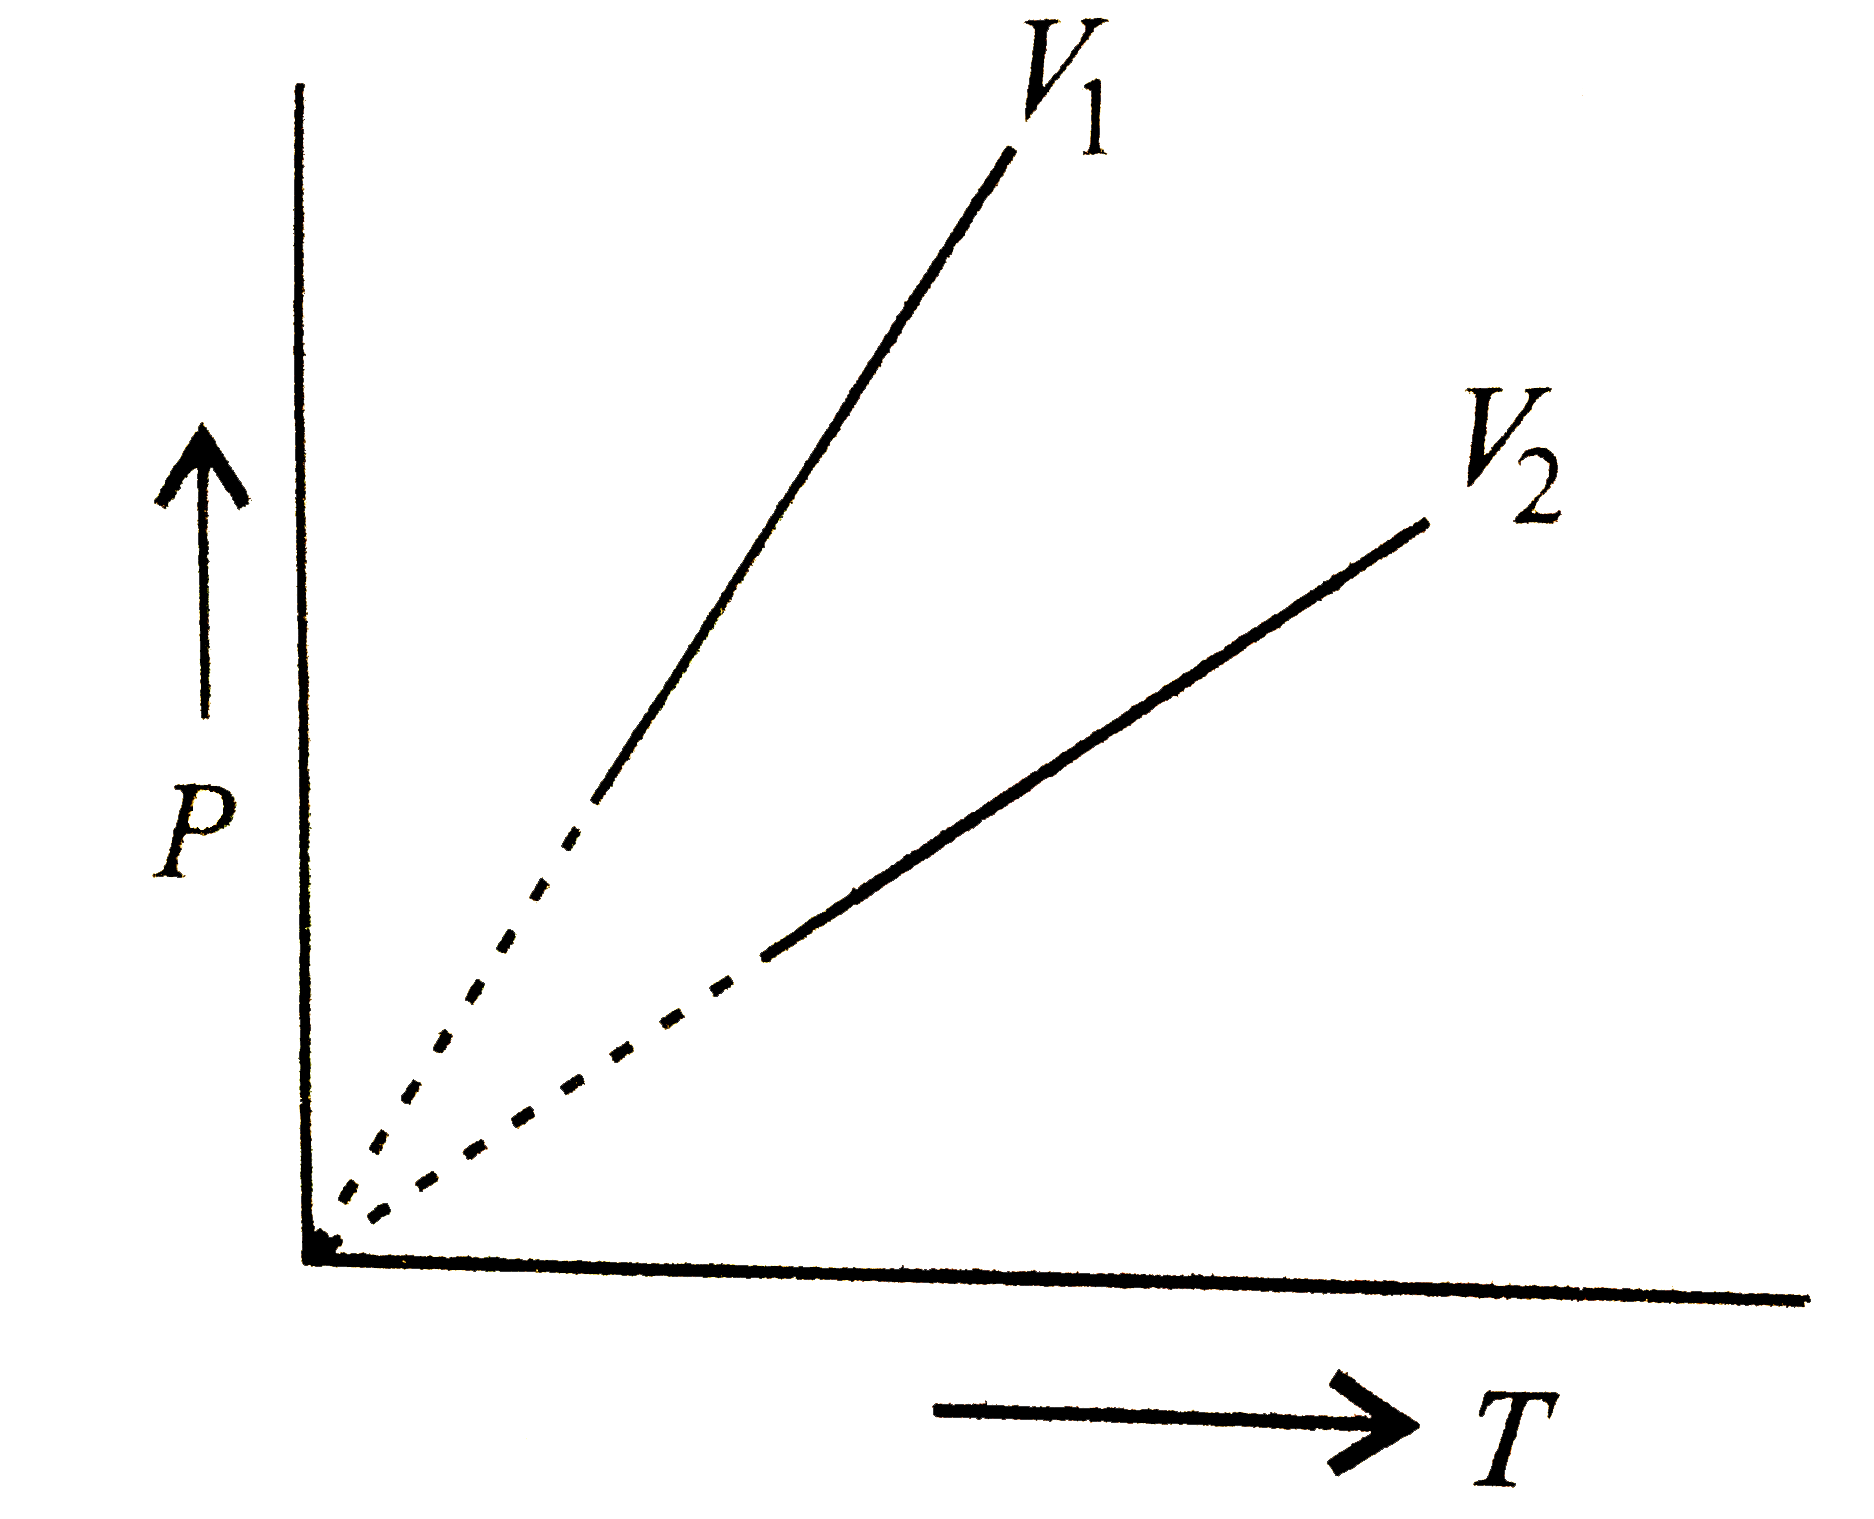
Which one of the following is correct?View SolutionA plot of P vs T for a given mass of gas at constant volume is a straight line . P vs T at constant volumes V1 and V2 for an ideal gas are shown below :
Which of the following is correct ?
 View Solution
Knowledge Check
- Question 1 - Select One
V vs T curves at constant pressure P1 and P2 for an ideal gas are shown below
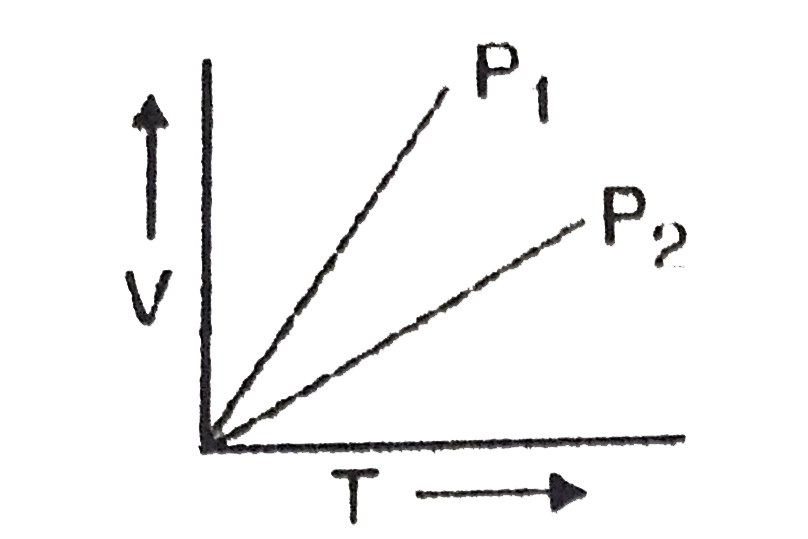
Which is correct ?AP1>P2BP1<P2CP1=P2DAll of the above - Question 2 - Select One
For an ideal gas V−T curves at constant pressure P1 & P2 are shown in figure, from the figure
_E01_061_Q01.png) AP1>P2BP1<P2CP1=P2DP1≤P2
AP1>P2BP1<P2CP1=P2DP1≤P2 - Question 3 - Select One
Pressure versus density graph of an ideal gas is shown in figure
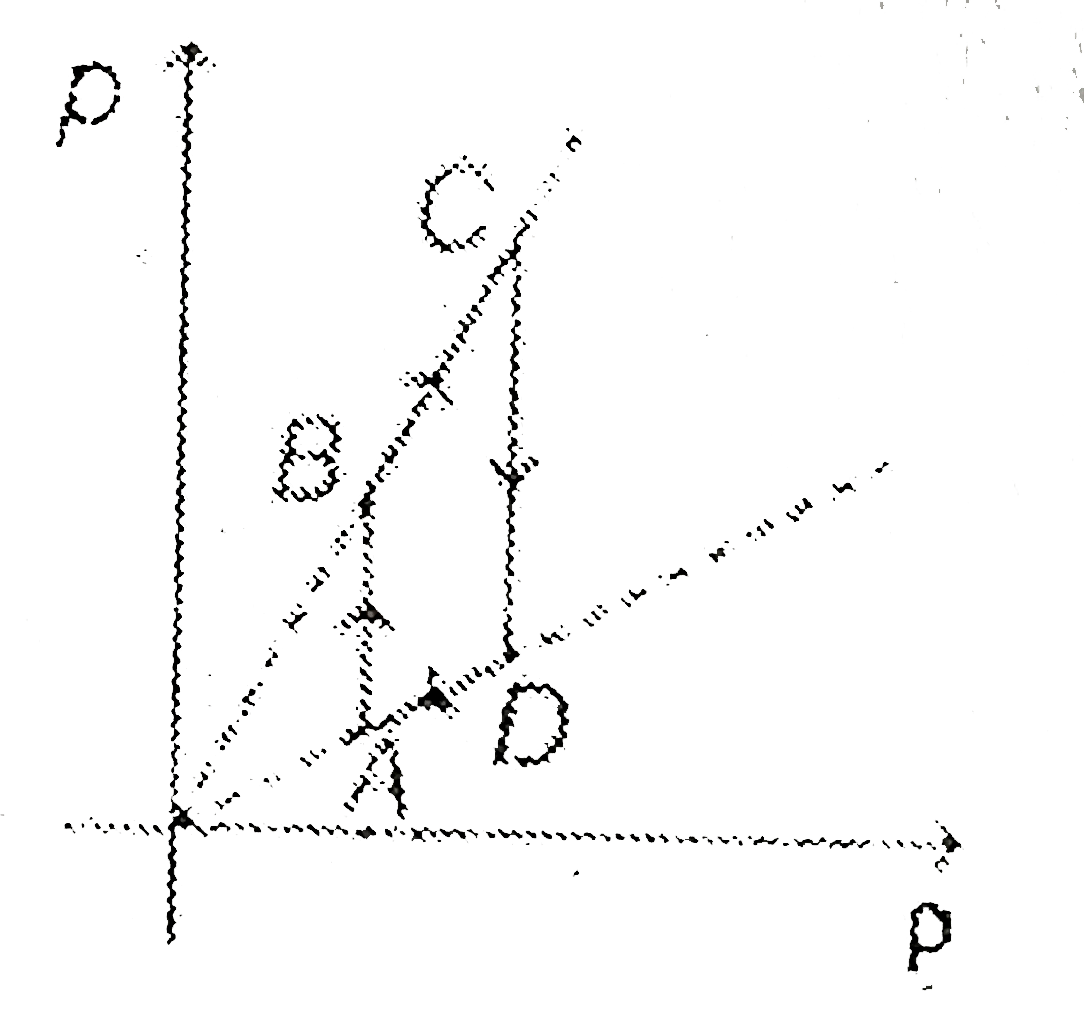 Aduring the process AB work done by the gas is positiveBduring the process AB work done by the gas is negativeCduring the process BC internal energy of the gas is increasingDNone of the above
The volume V versus temperature T graphs for a cetain amount of a perfect gas at two pressure p1andp2 are as shown in Fig. It follows from the graphs that p1 is greater than p2.
 View Solution
For one mole of an ideal gas the slope of V versus T curve at constant pressure of 2 atm is X lit mol−1K−1. The value of the ideal universal gas constant 'R' in terms of X is ___________.
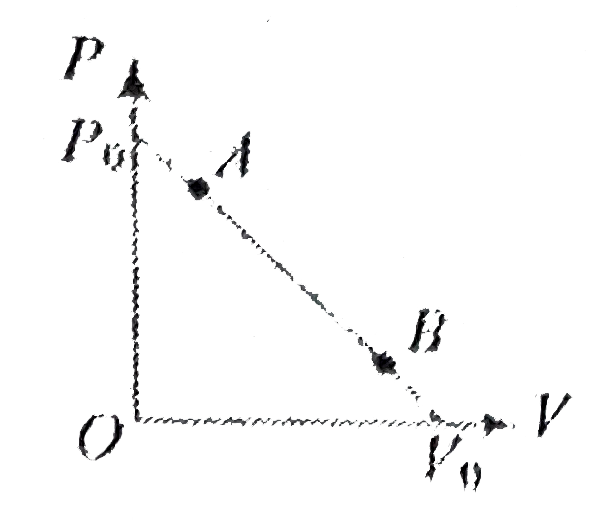
View SolutionOne mole of an ideal monatomic gas undergoes a linear process from A to B , in which is pressure P and its volume V change as shown in figure .
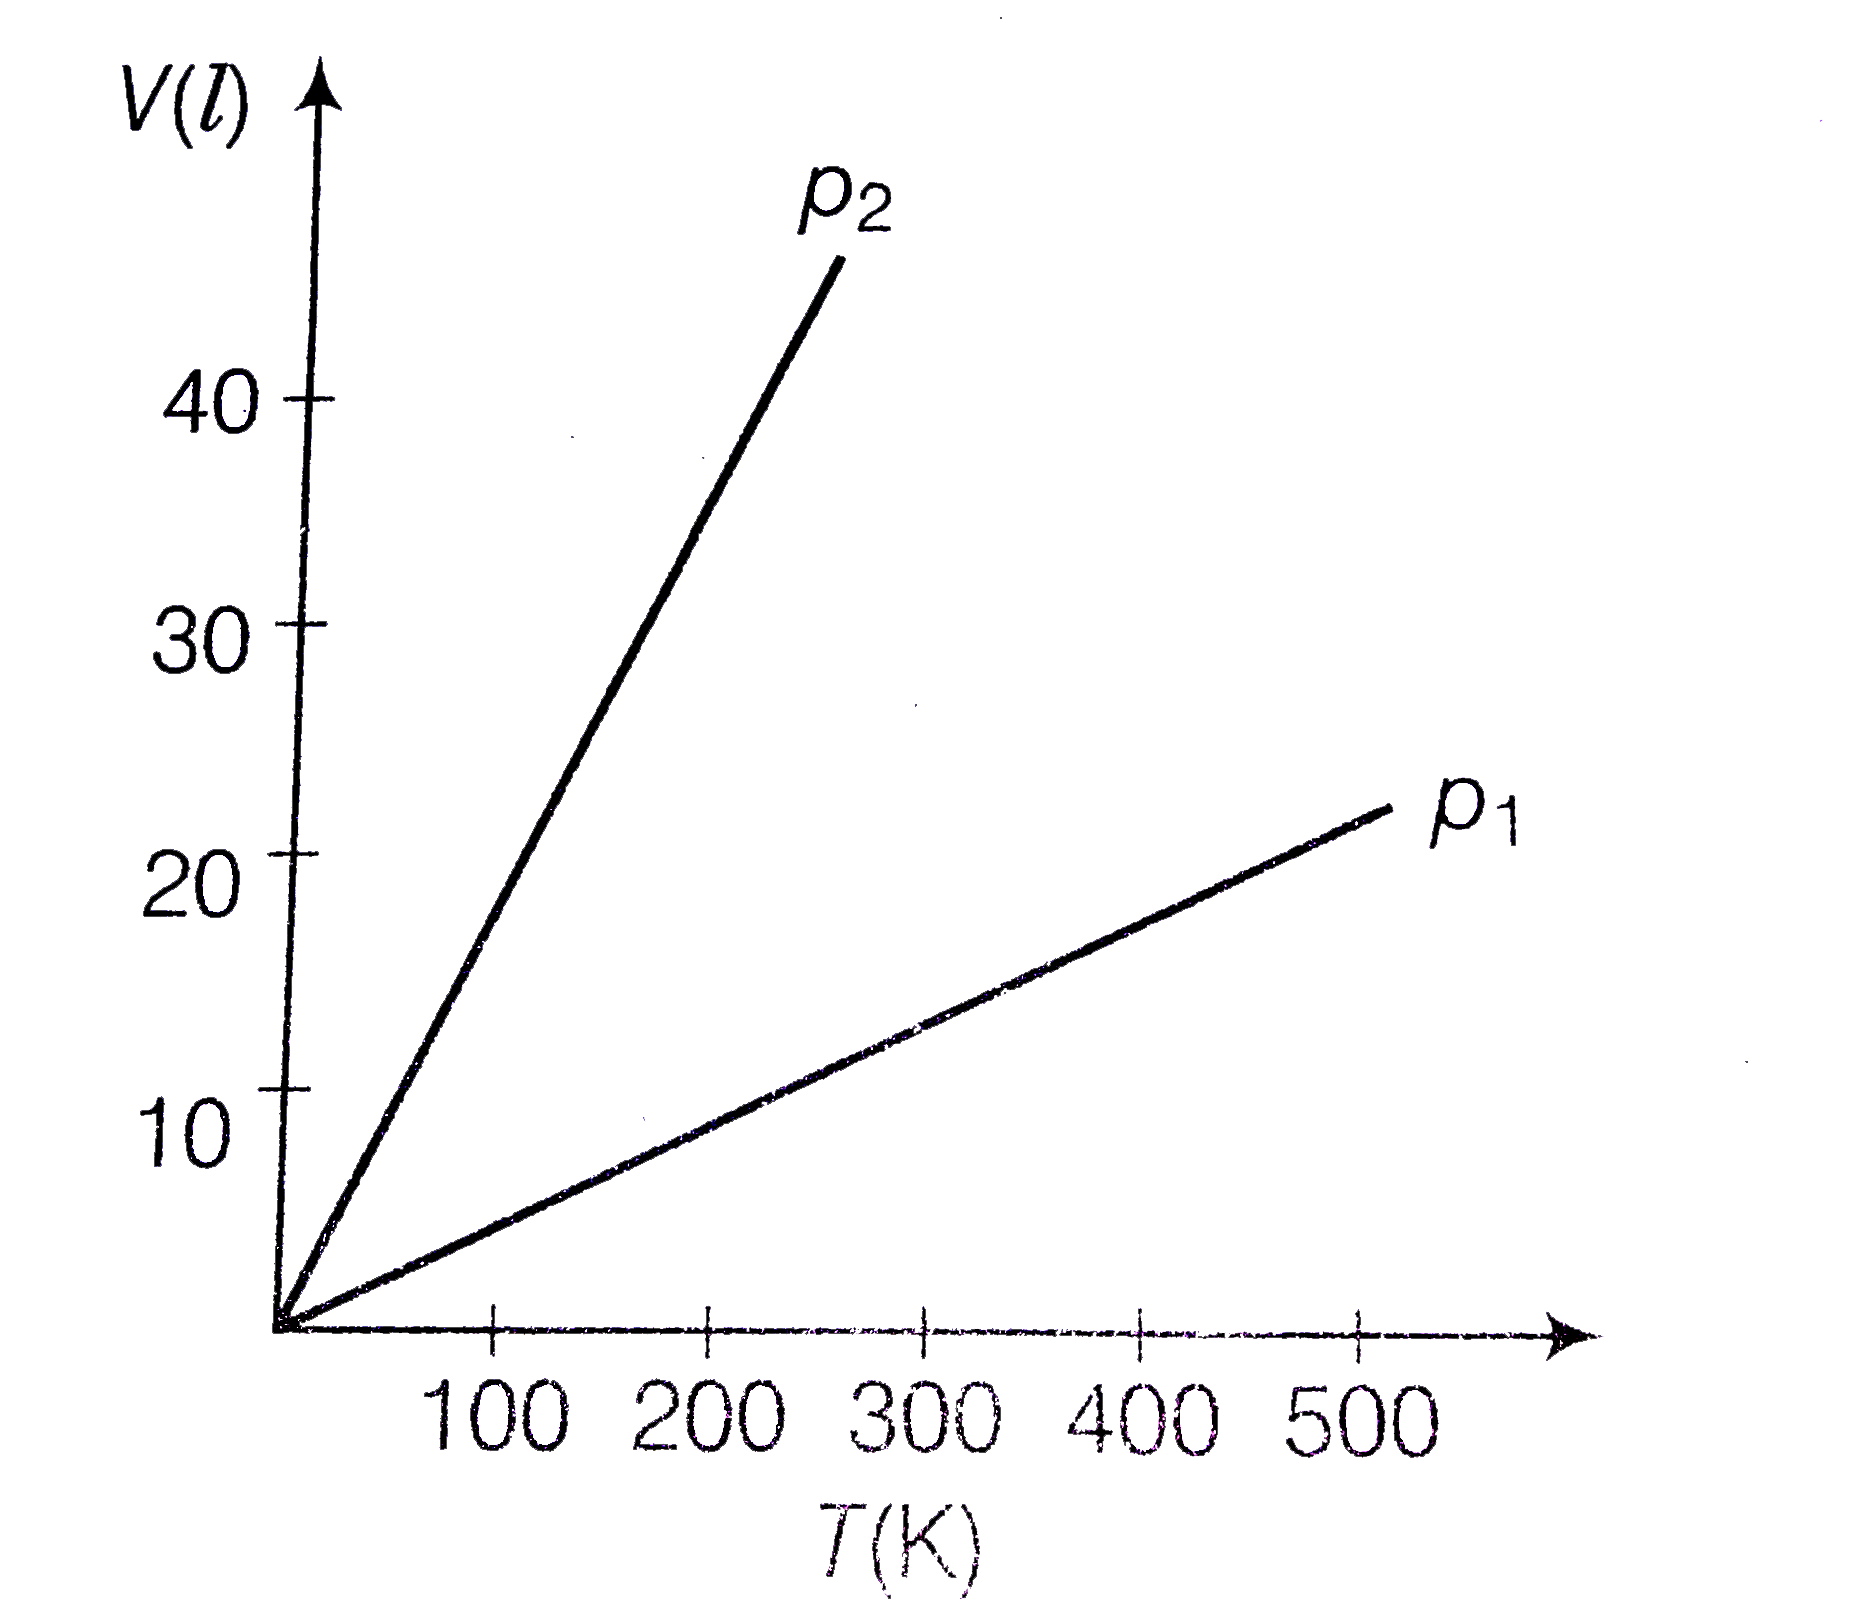
The absolute temperature T versus volume V for the given process isView SolutionVolume versus temperature graphs for a given mass of an ideal gas are shown in figure. At two different values of constant pressure. What can be inferred about relation between P1 and P2 ?
 View Solution
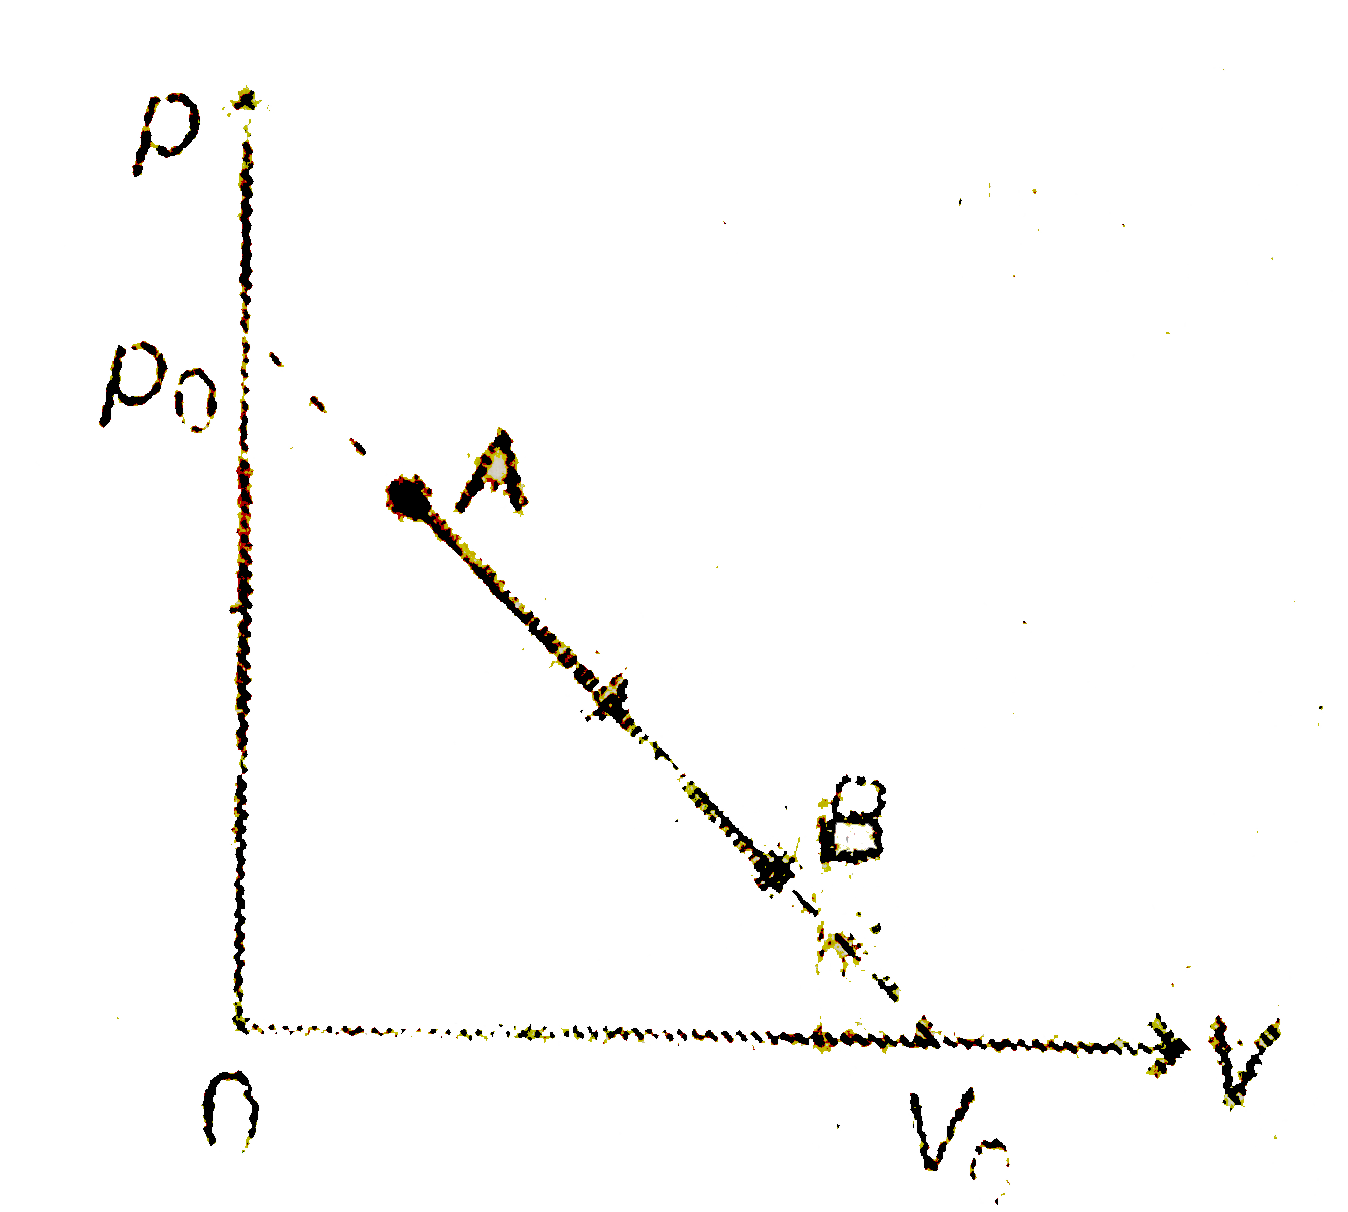
One mole of an ideal monotomic gas undergoes a linear process from A to B in which its pressure p and its volume V change as shown in figure.
The absolute temperature T versus volume V for the given process isView Solution

