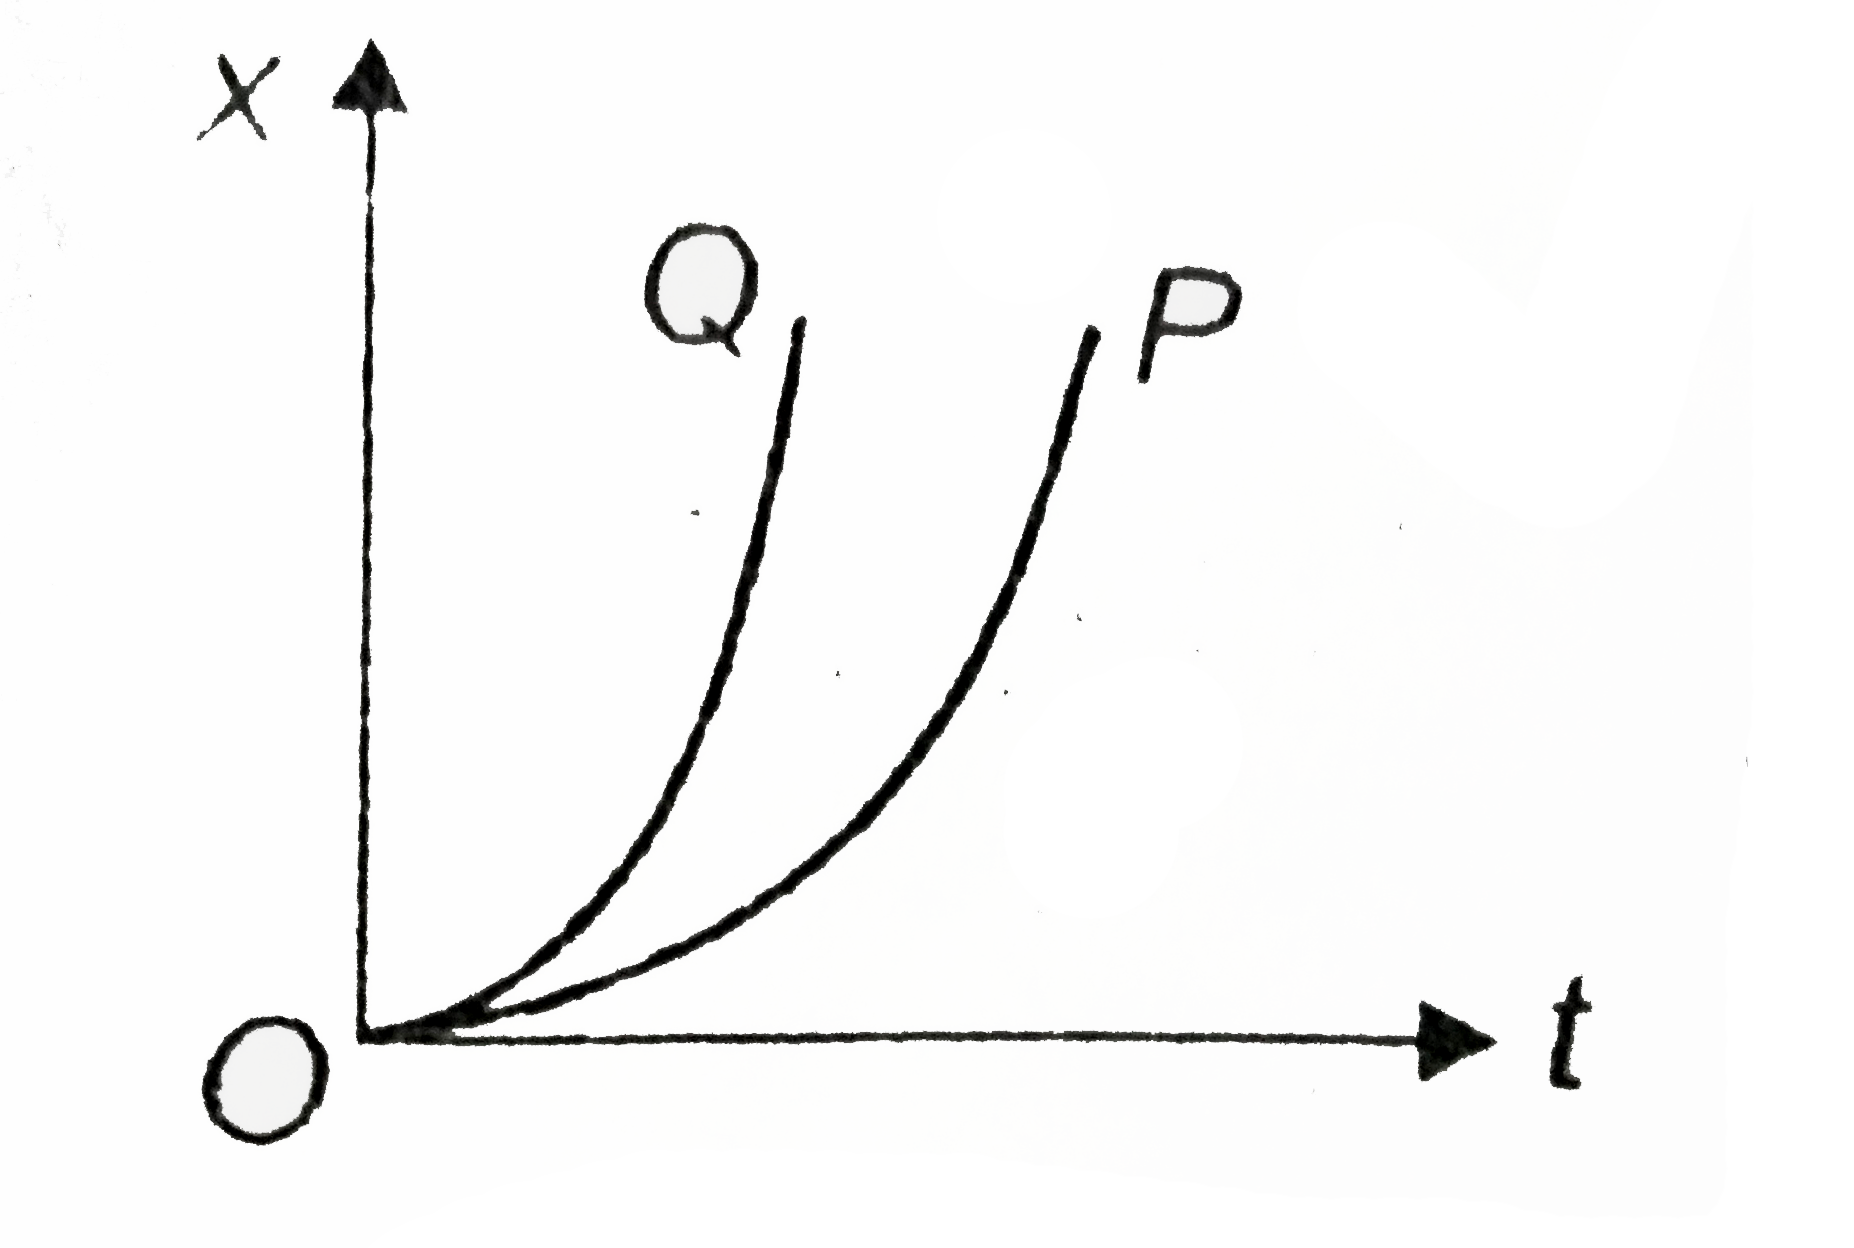
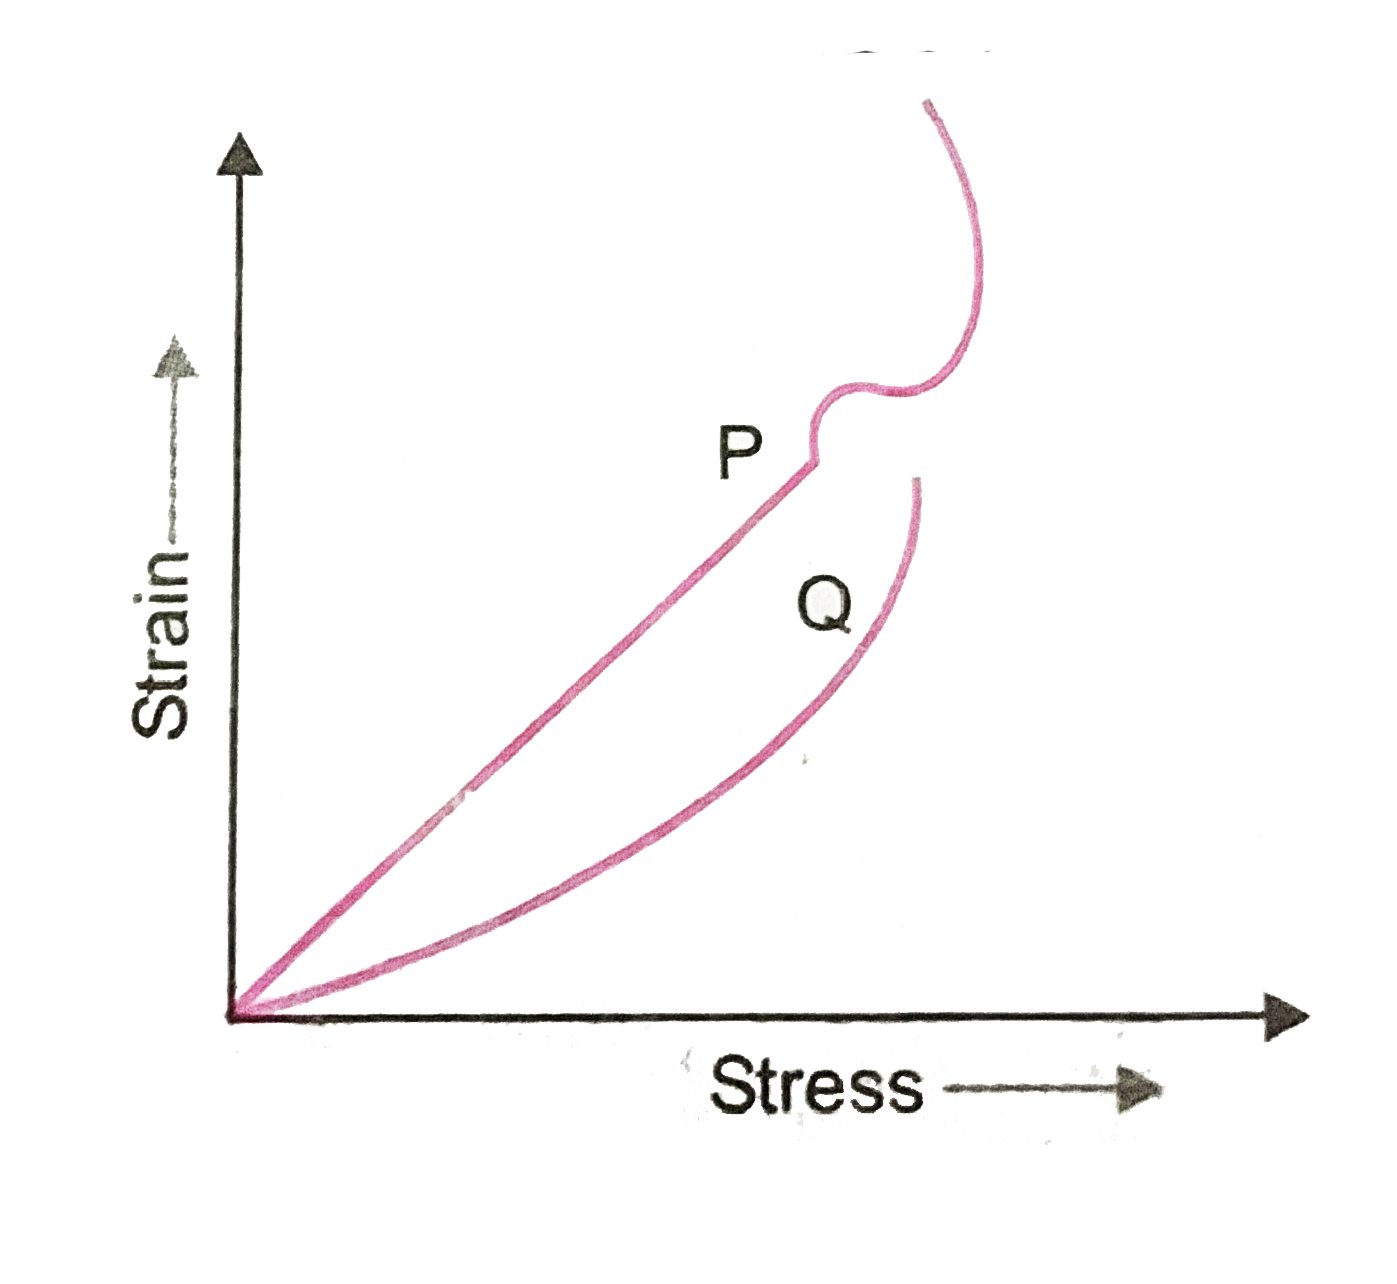
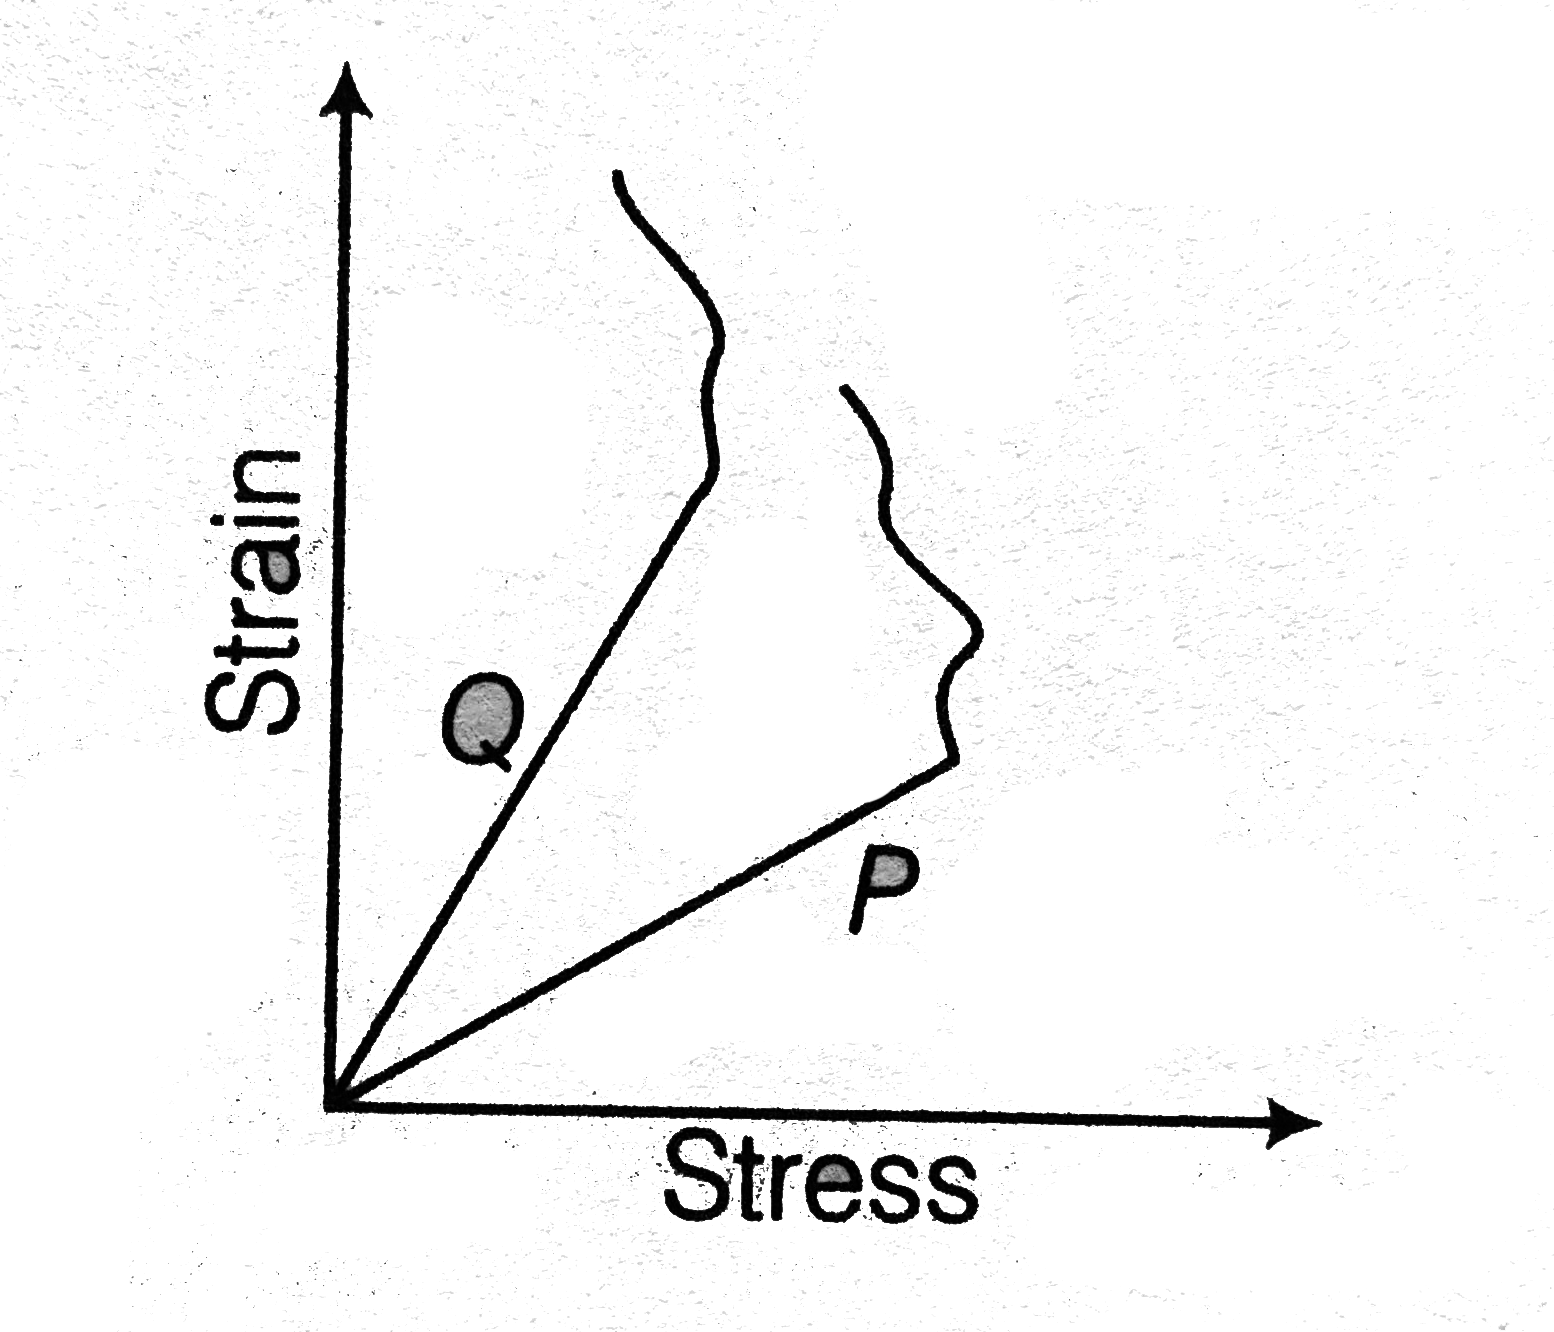
In plotting stress versus strain curves for two materials P and Q, a student by mistake puts strain on the y-axis and stress on the x-axis as shown in the figure. Then the correct statement(s) is (are)
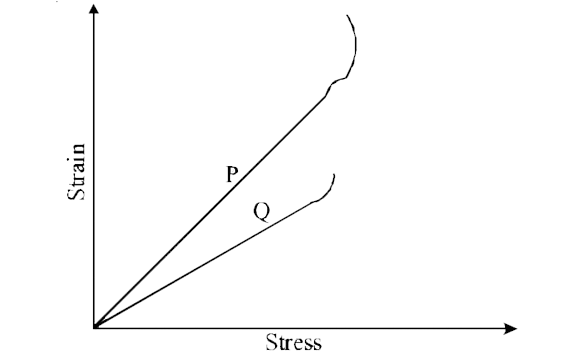
P has more tensile strength than Q
P is more ductile than Q
P is more brittle than Q
The Young's modulus of P is more than that of Q.
The correct Answer is:A, B
Breaking stress of P is more than Q so P is more ductile
strain =1Y stress
YP<YQ
Topper's Solved these Questions
- ELASTICITY AND VISCOCITYBook:RESONANCEChapter:ELASTICITY AND VISCOCITYExercise:Exercise- 3 PART - IV
Explore 9 Videos
- ELASTICITY AND VISCOCITYBook:RESONANCEChapter:ELASTICITY AND VISCOCITYExercise:Advanced Level Problems
Explore 9 Videos
- ELASTICITY AND VISCOCITYBook:RESONANCEChapter:ELASTICITY AND VISCOCITYExercise:Exercise- 2 PART - III
Explore 11 Videos
- DAILY PRACTICE PROBLEMSBook:RESONANCEChapter:DAILY PRACTICE PROBLEMSExercise:dpp 92 illustration
Explore 2 Videos
- ELECTROMAGNETIC INDUCTIONBook:RESONANCEChapter:ELECTROMAGNETIC INDUCTIONExercise:Exercise
Explore 43 Videos
Similar Questions
Knowledge Check
In plotting stress versus strain curves for two material P and Q, a student by mistake puts strain on the y-axis stress on ther x-axis as shown in the figure. Then the correct statement is/are
 AP has more tensile sile strrength than QBP is more ductile than QCP is more brittle QDThe young's modulus of P is more than that of Q
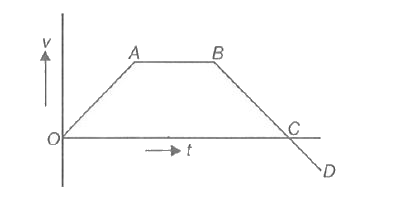
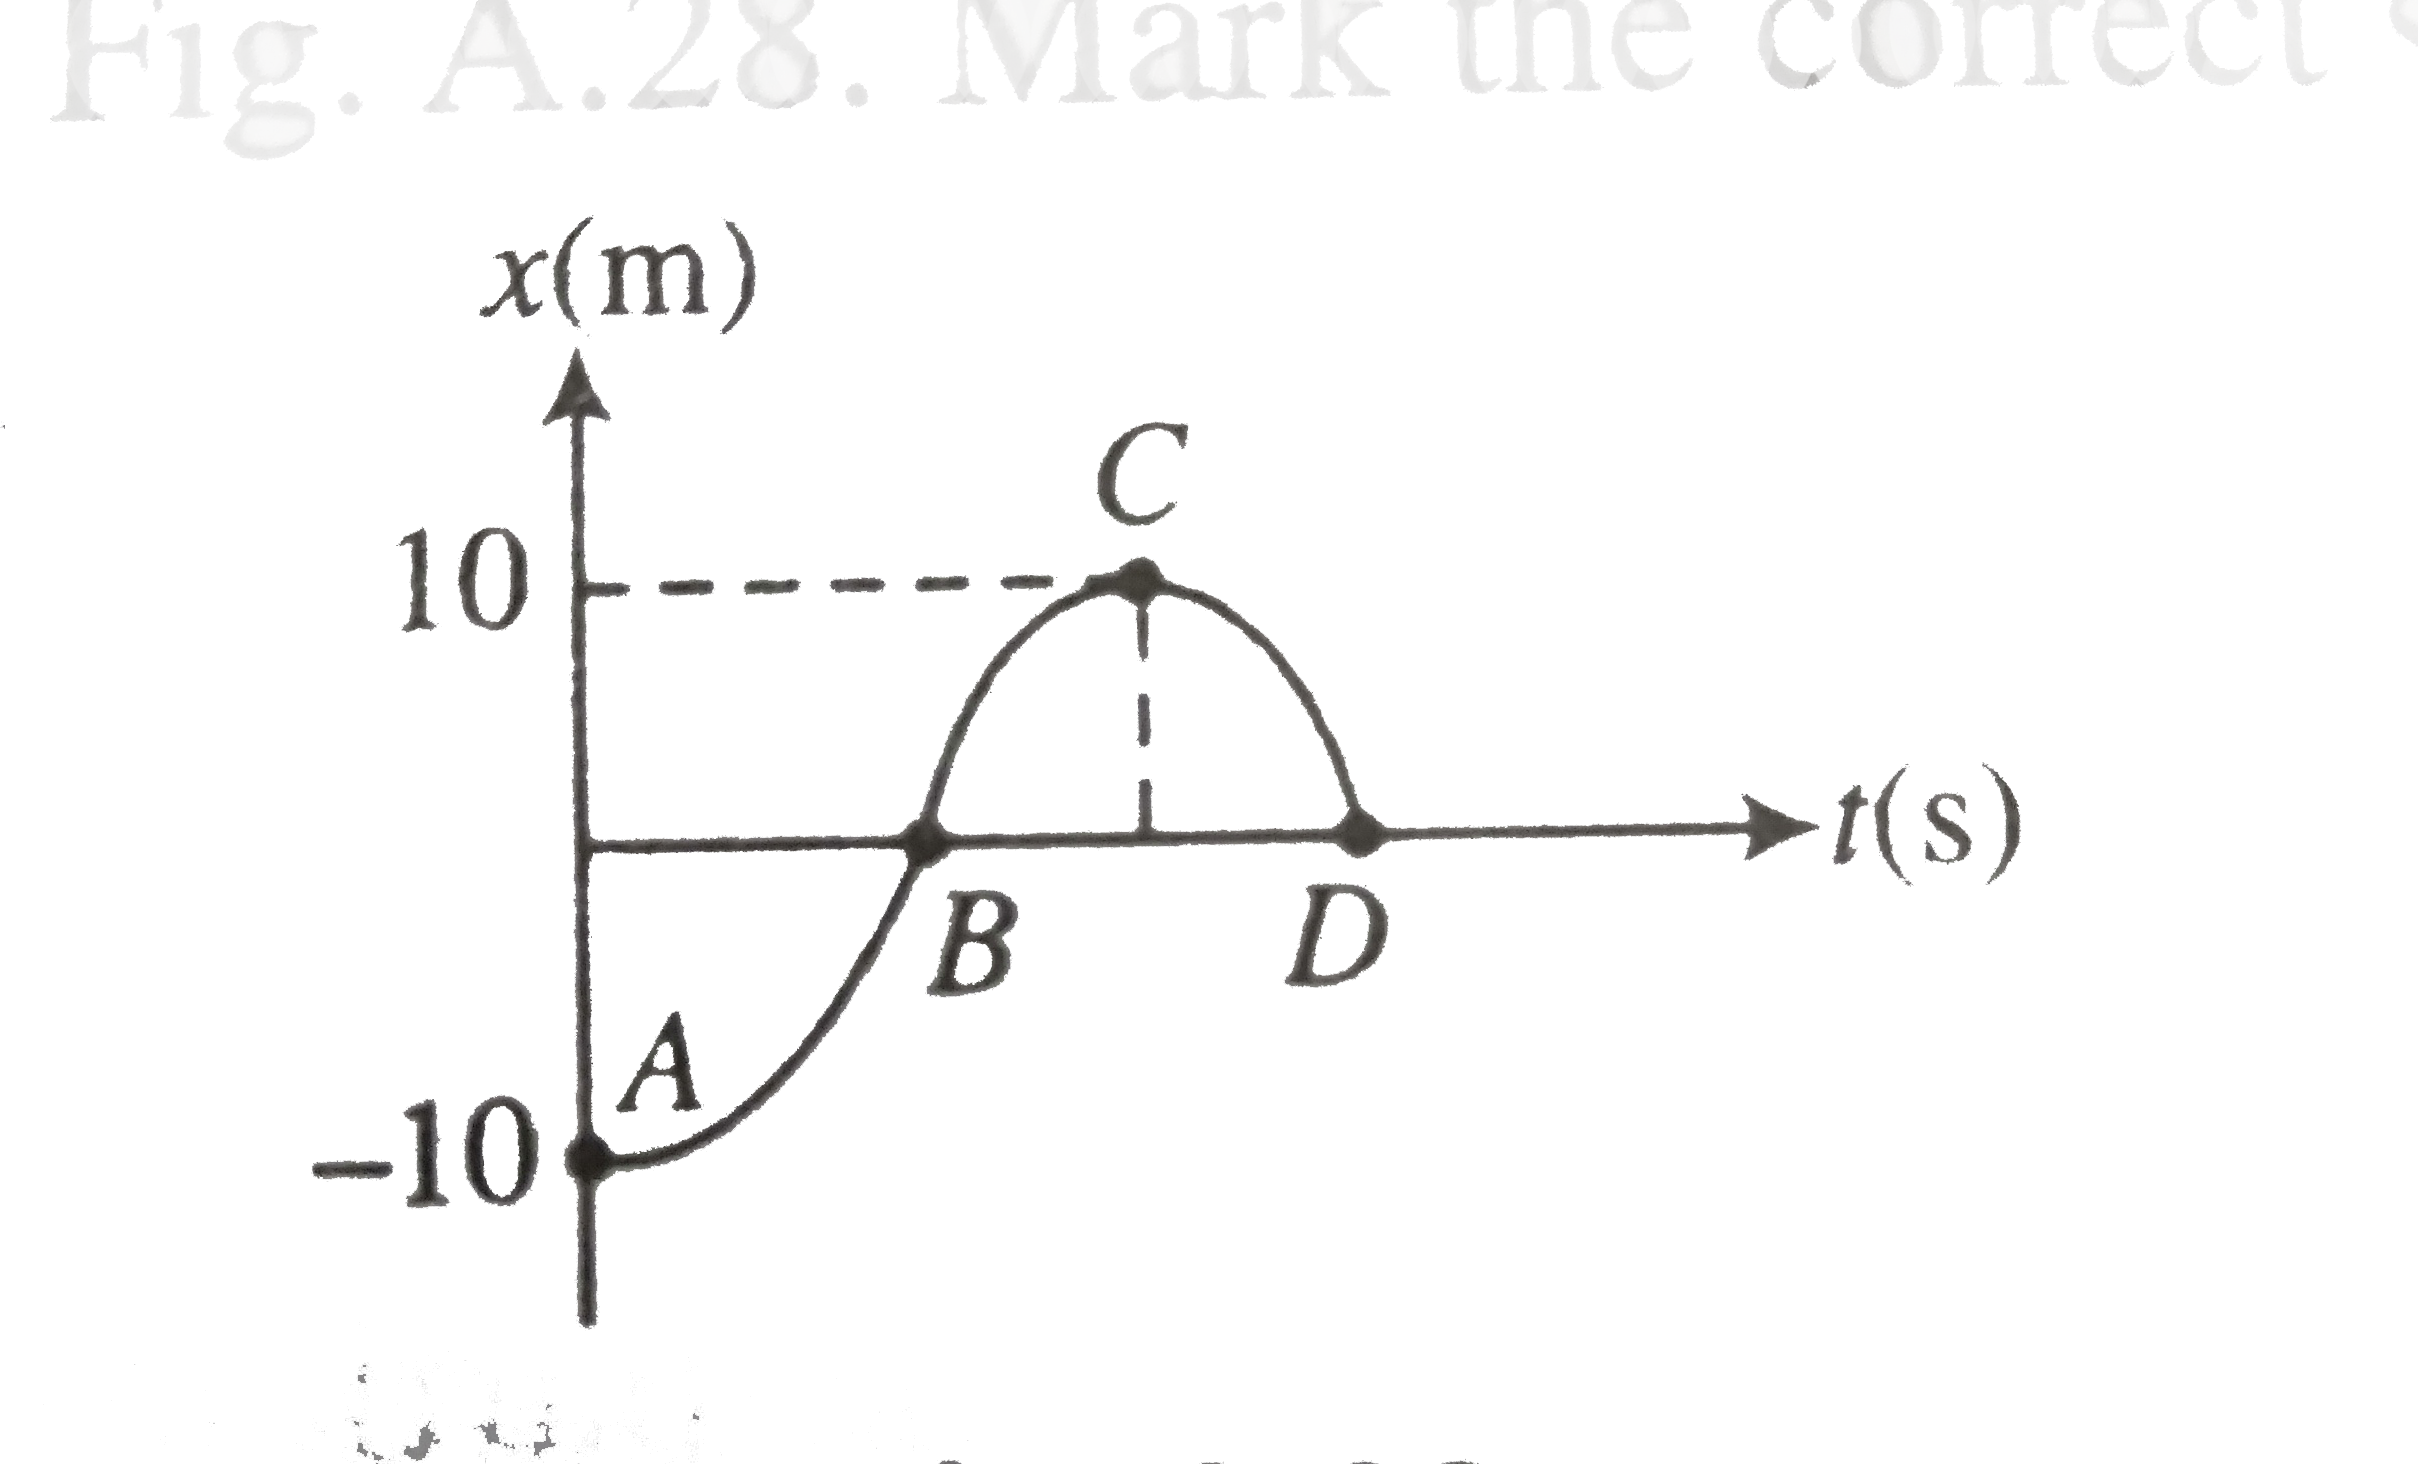
For a particle moving along x-axis, a scaled x-6 graph is shown in figure. Mark the correct statement (s).
 ASpeed of the particle is greatest at C.BSpeed of the particle is greatest at B.CParticle is speeding up in region marked CD.DParticle is speeding up in region marked AB.
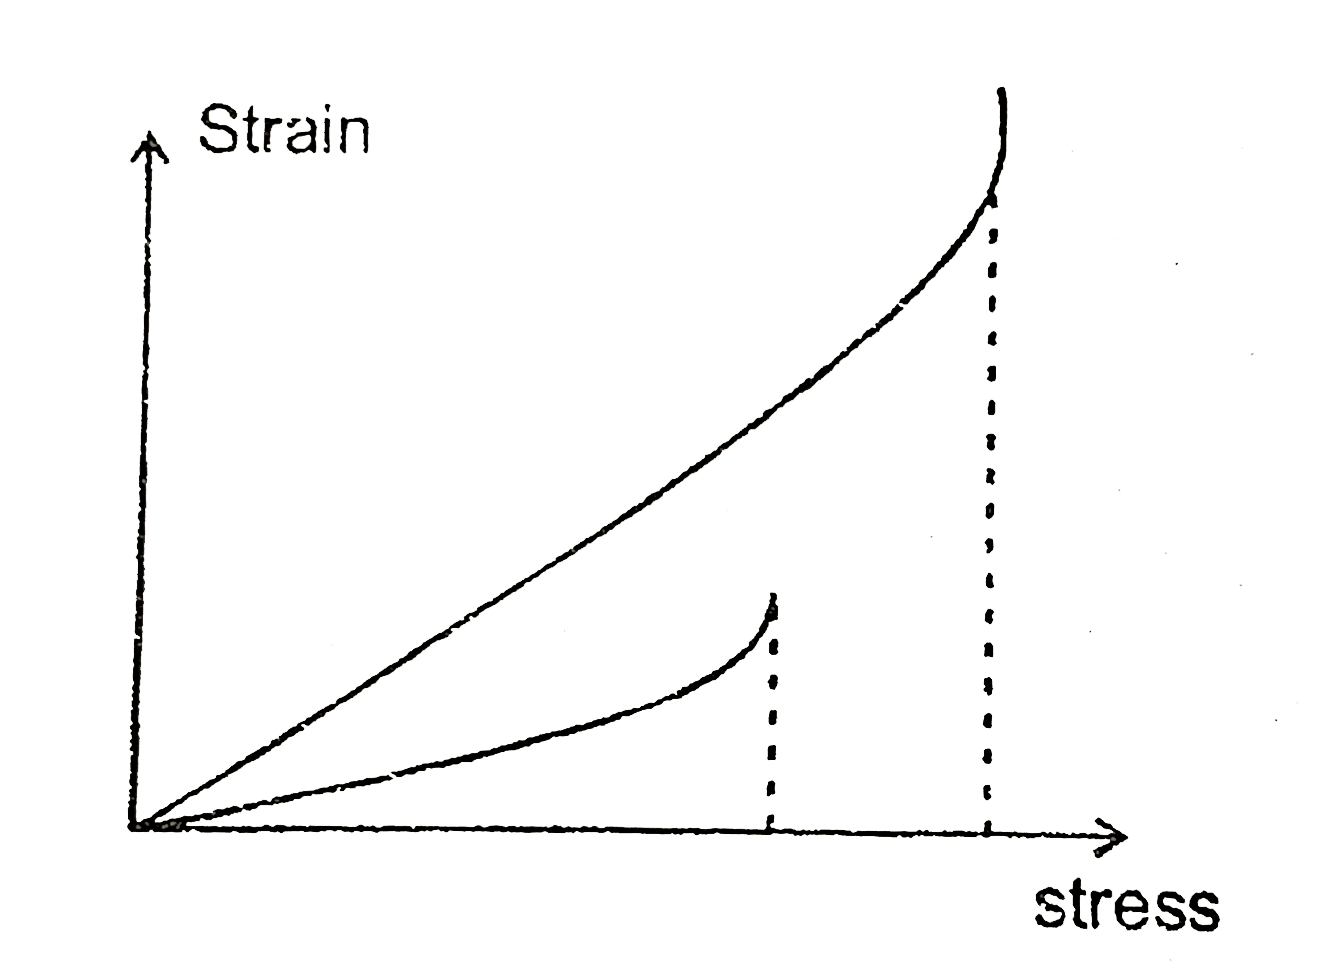
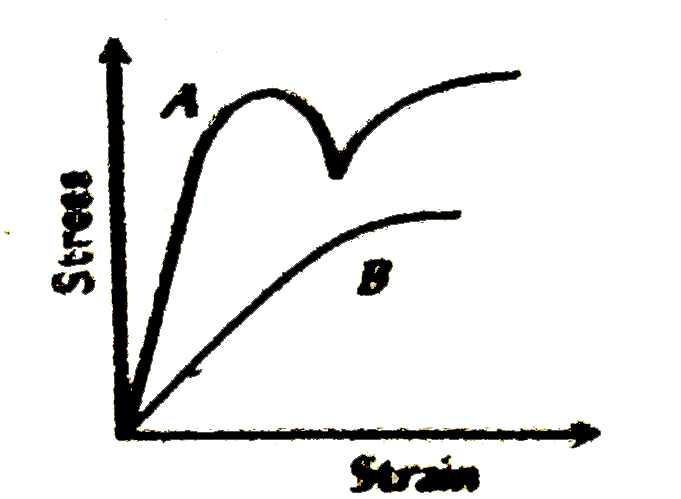
The diagram shows stress v/s strain curve for the materials A and B. From the curves we infer that
 AA is brittle but B is ductileBA is ductile and B is brittleCBoth A and B are ductileDBoth A and B are brittle
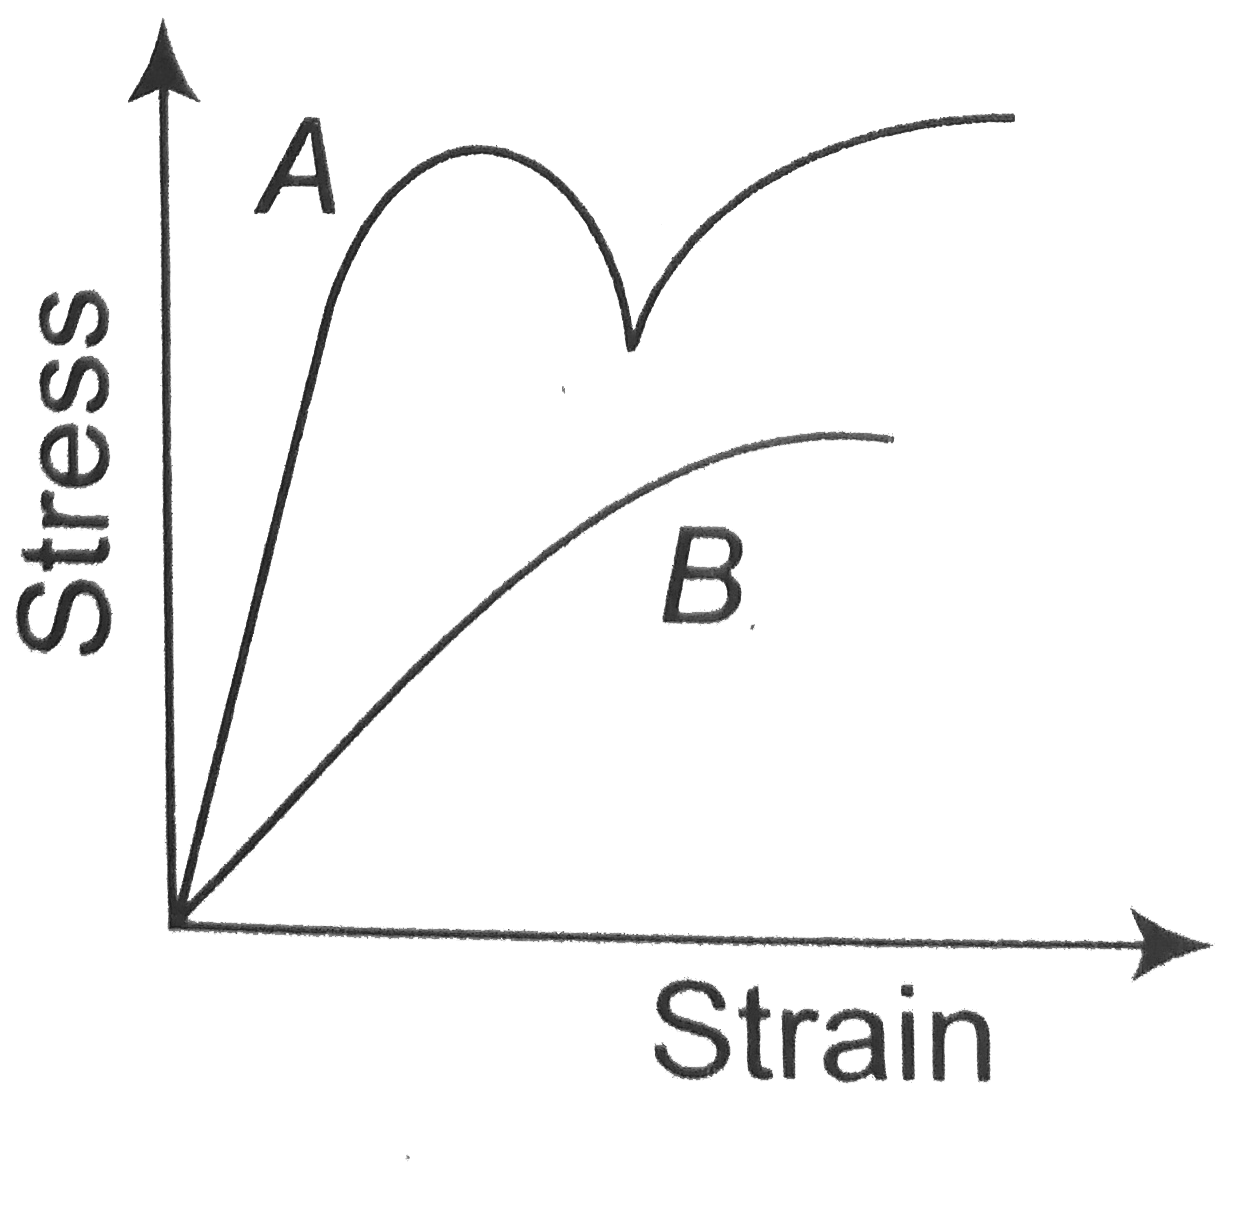
The diagram shoes stress v/s strain curve for the materials A and B. From the curves we infer that
View SolutionDisplacement versus time curve for a particle executing SHM is shown in figure. Choose the correct statements.
View SolutionFigure shows the stress-strain curve of two metals P and Q. From the graph, it can be concluded that
View Solution
The stress versus strain graphs for wires of two materials A and B are as shown in the figure. If YA and YB are the Young's moduli of the materials then
View SolutionWhich of the following stress versus strain curve representes cast iron?
View Solution


