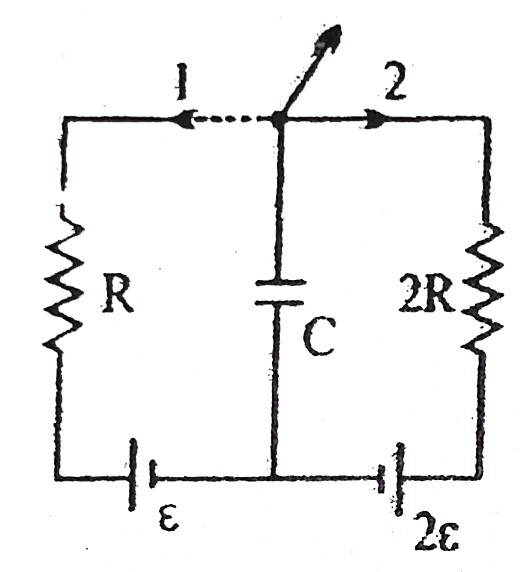
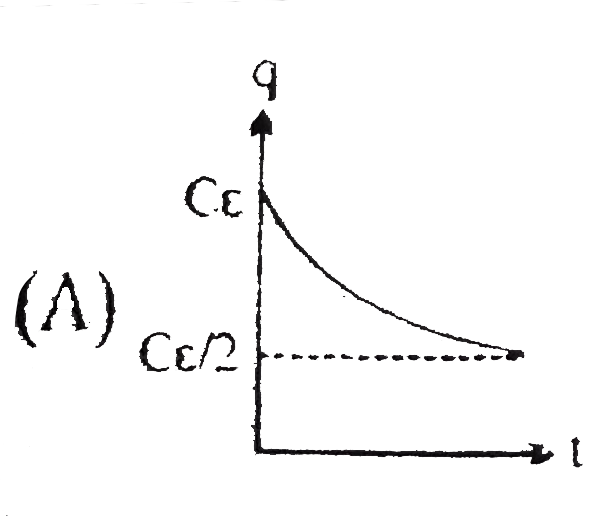
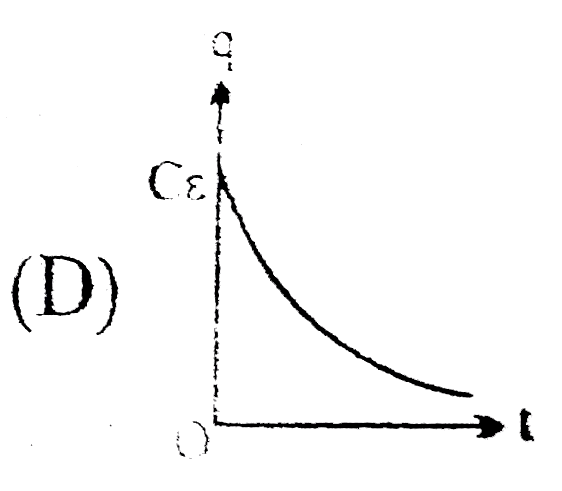
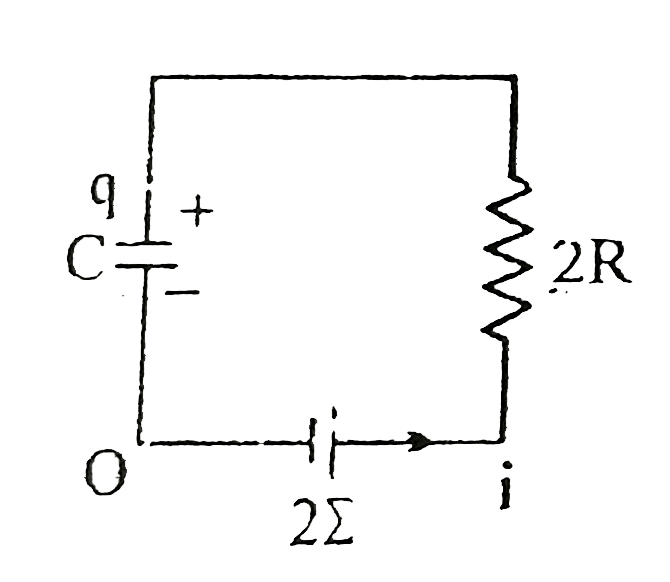
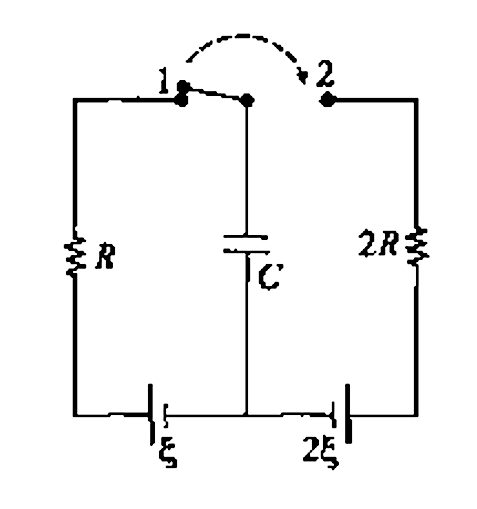
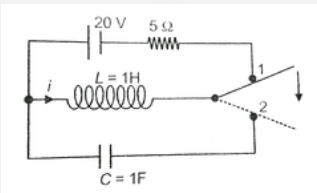
In the circuit shown, the switch is shifted from position 1rightarrow 2 at t=0. The switch was initially in position I since a long time. The graph between charge on capacitor C and time 't' is


The correct Answer is:B
also
Related Playlists
- BOOK - BANSALCHAPTER - MASTER PRACTICE PROBLEMEXERCISE - Comphrehension134videos
MASTER PRACTICE PROBLEM
- BOOK - BANSALCHAPTER - MASTER PRACTICE PROBLEMEXERCISE - Reasoning75videos
MASTER PRACTICE PROBLEM
- BOOK - BANSALCHAPTER - FLUID MECHANICSEXERCISE - PYQS AIEEE10videos
FLUID MECHANICS
- BOOK - BANSALCHAPTER - SEMICONDUCTORSEXERCISE - CBSE Question32videos
SEMICONDUCTORS
Knowledge Check
- Question 1 - Select One
In the circuit shown in figure-3.311, the switch is shifted from position I to 2 at time t = 0. The switch was initially in position I for a long time. The graph between charge on capacitor C and time tis best represented as
 A
A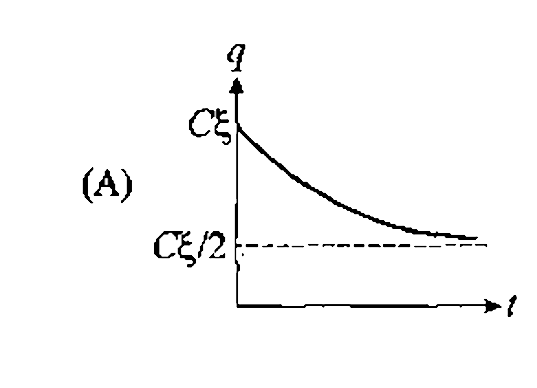 B
B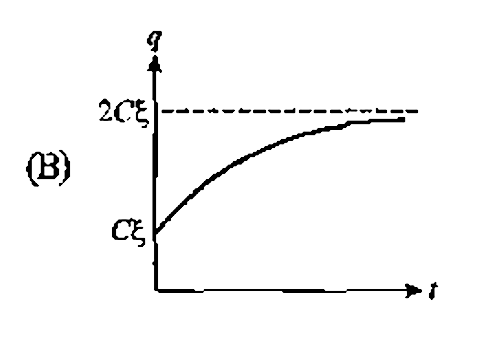 C
C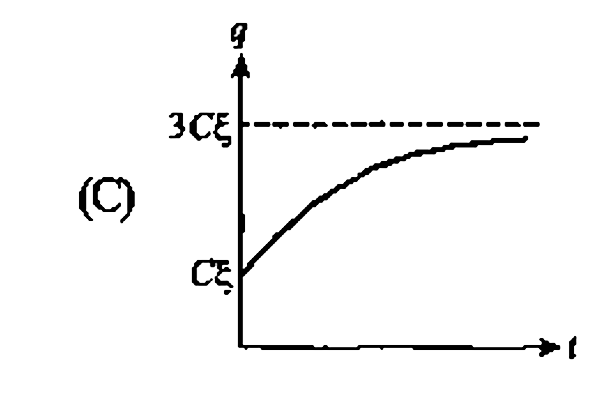 D
D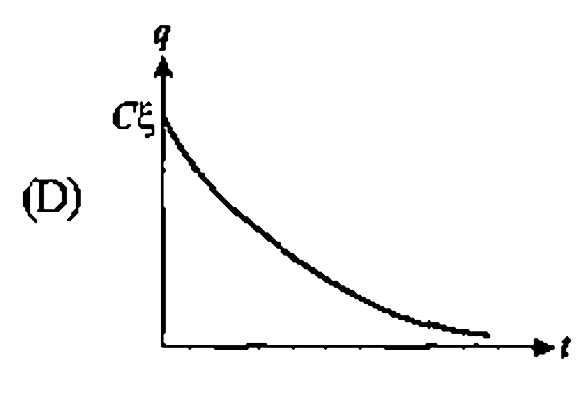
- Question 1 - Select One
In the circuit shows in Fig switch S is shifed to position 2 from position 1 at t=0, having been on position 1 for a long time. The current in the circuit just after shifting of switch will be (battery and both the inductors are ideal)
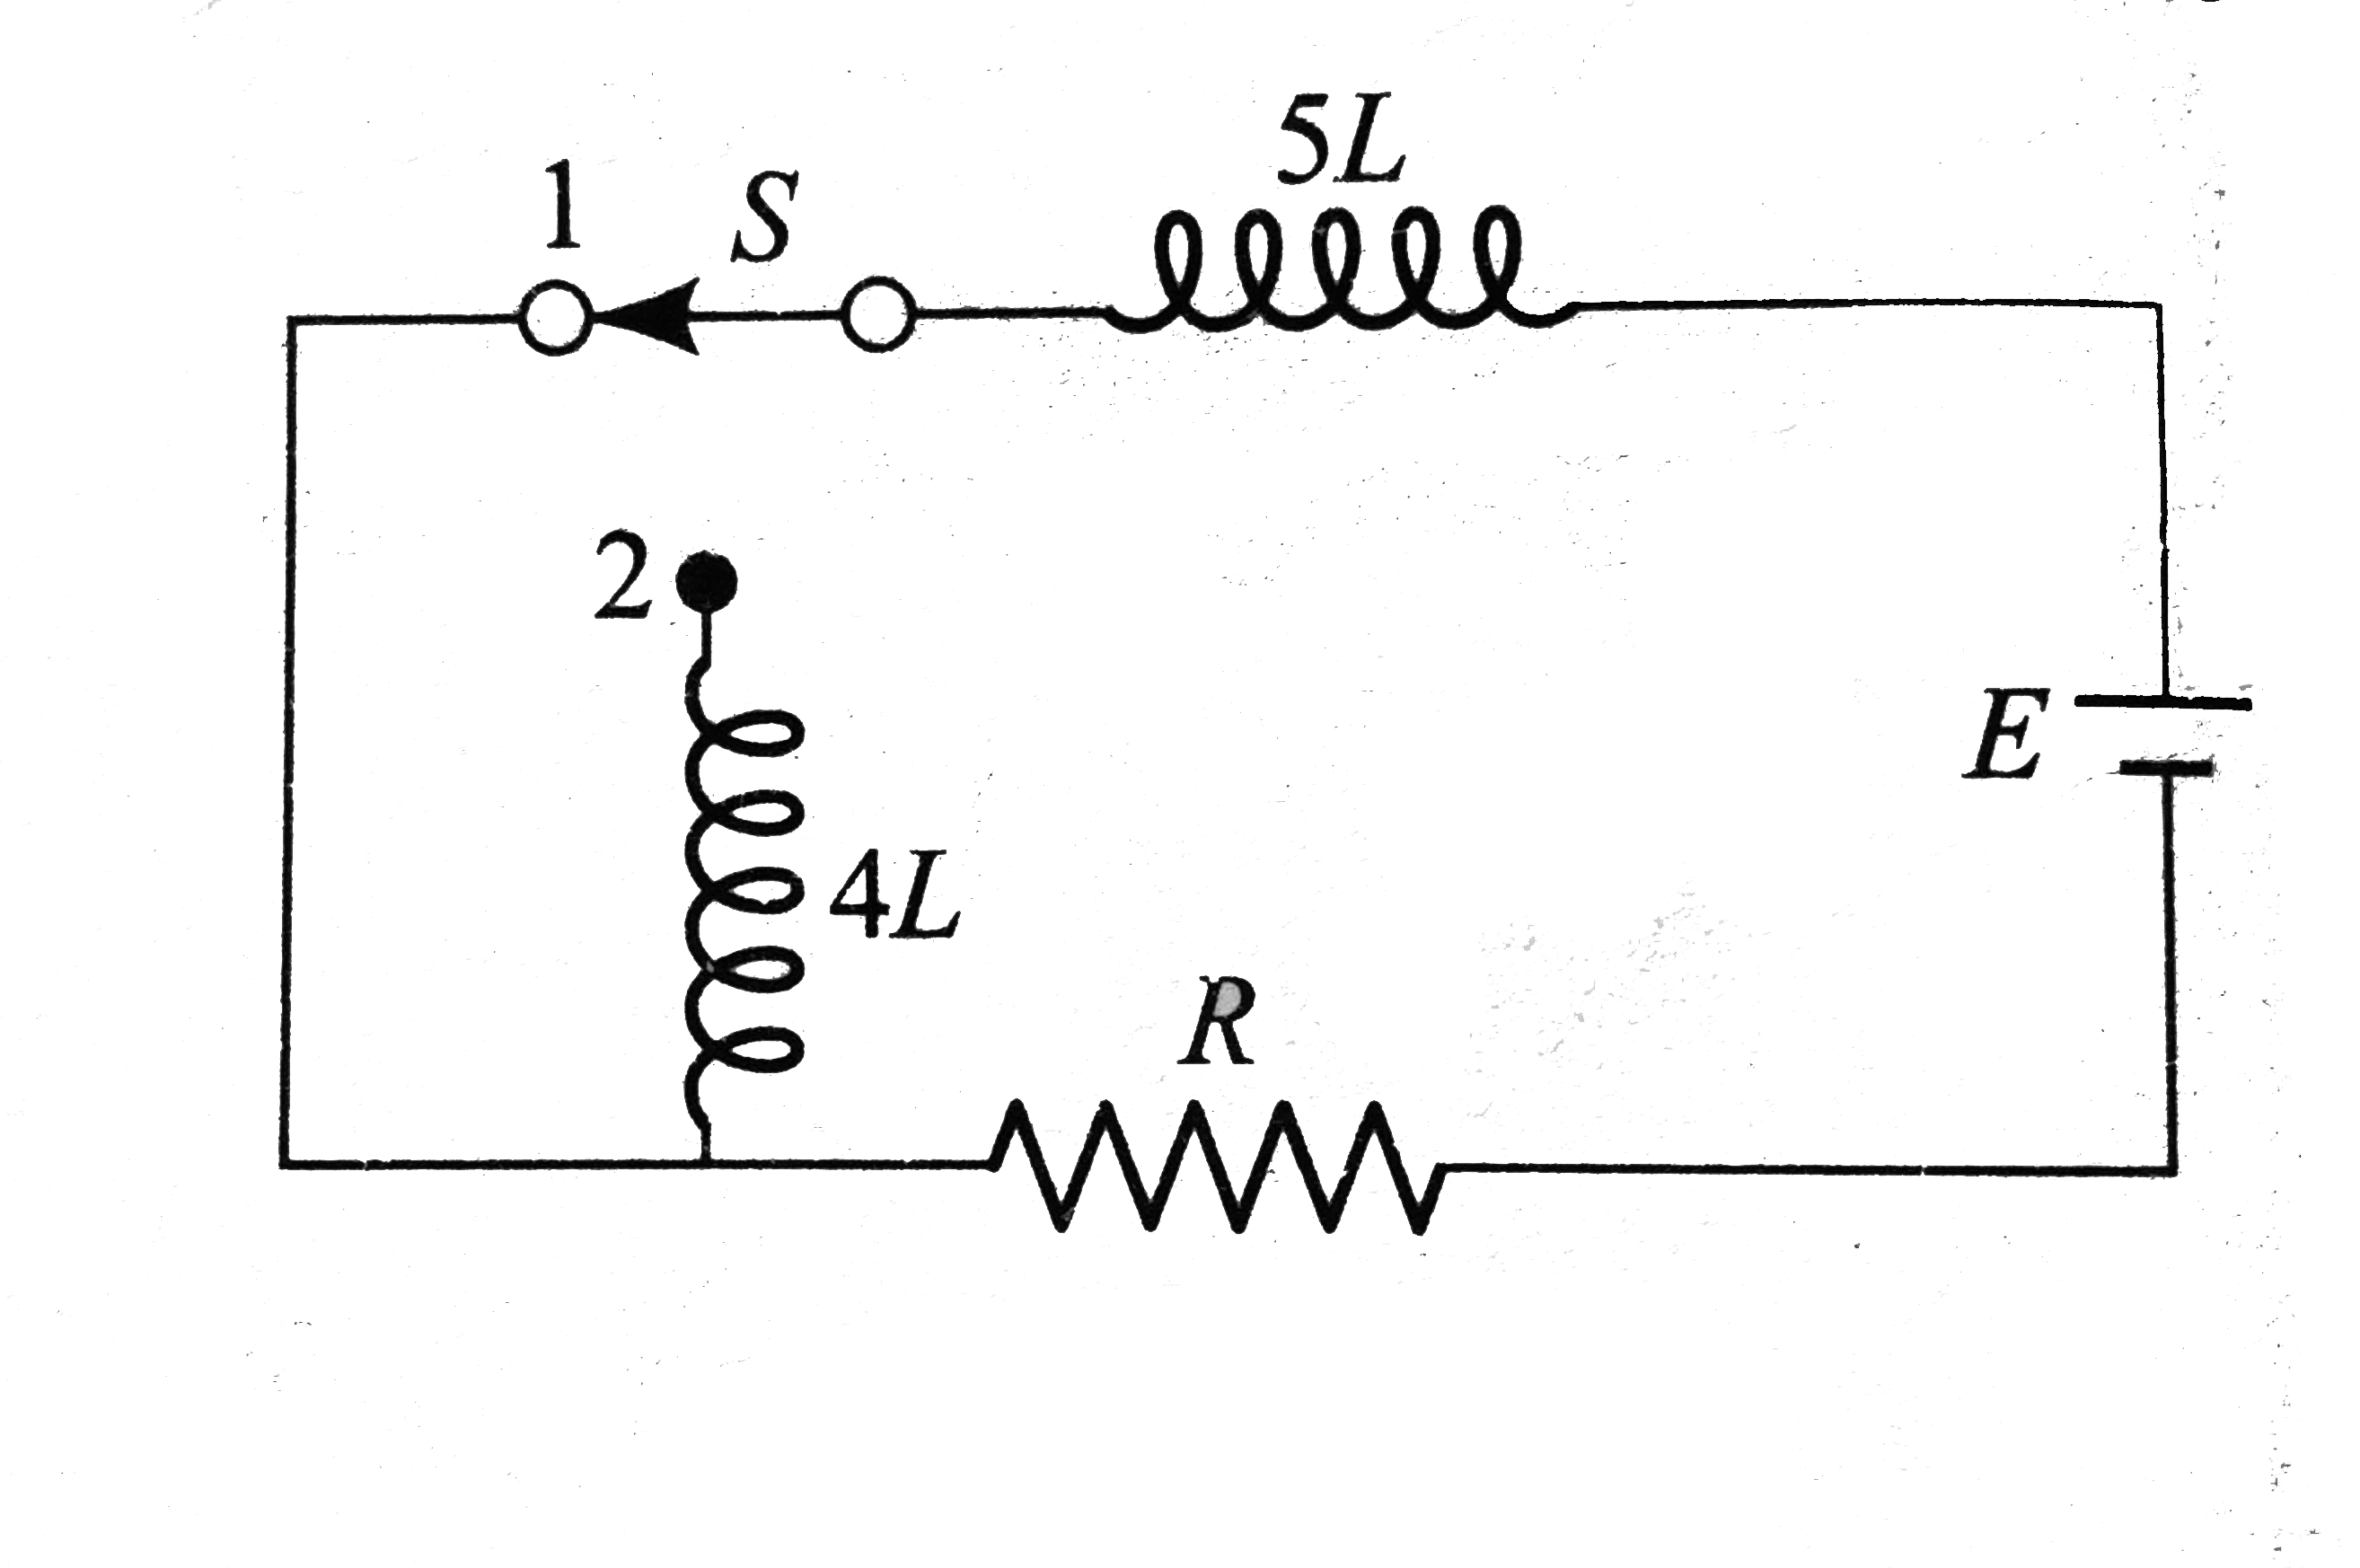 A45ERB54ERC59ERDER
 - Question 1 - Select One
Condsider
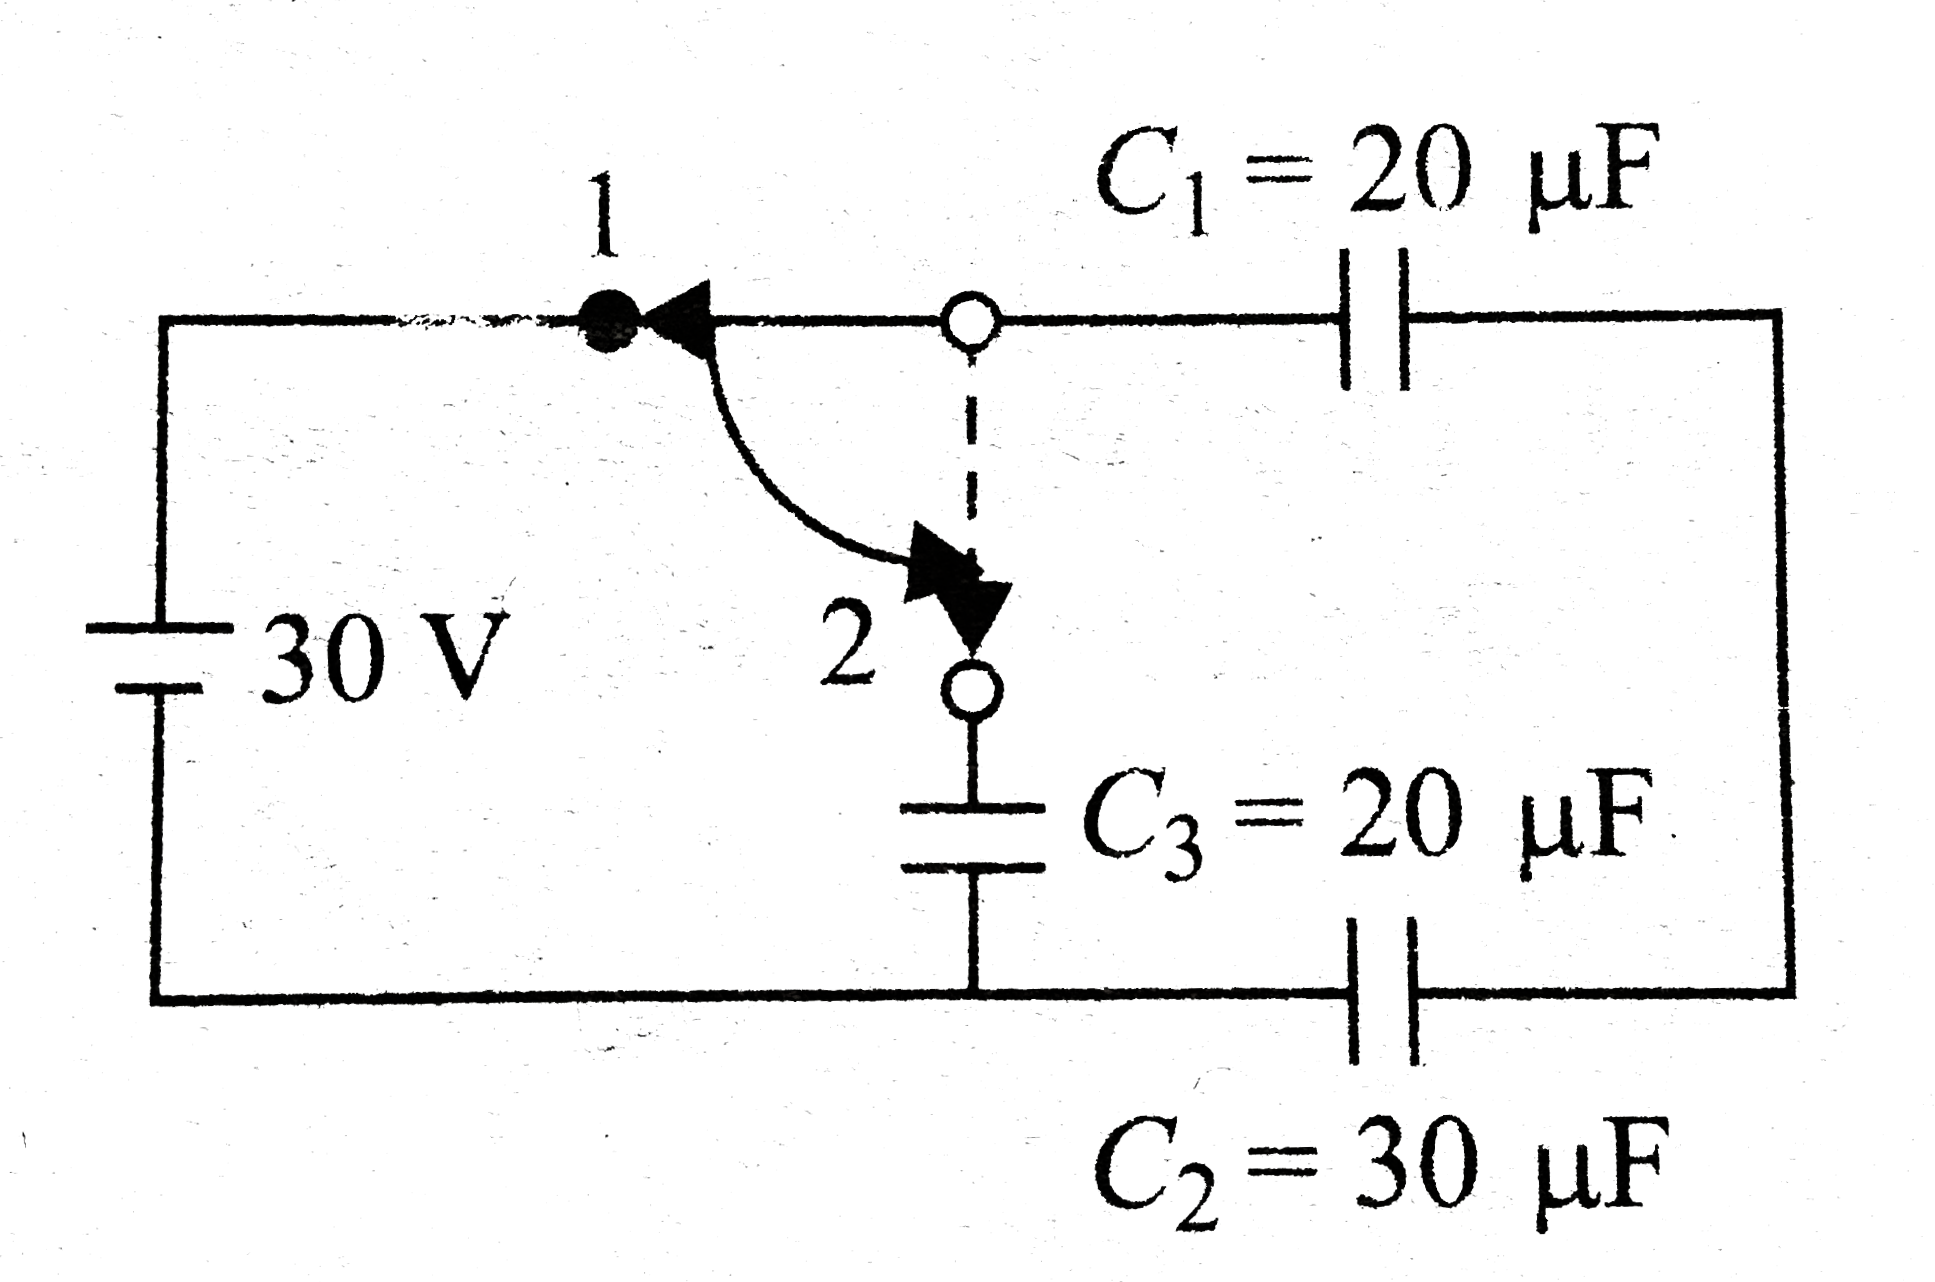 .
.
In the circuit shown is the switch can be shifted to positions 1 and 2 The charge on capacitor C1 when the switch is at position 1 is.A120μCB240μCC360μCD80μC
Similar Questions
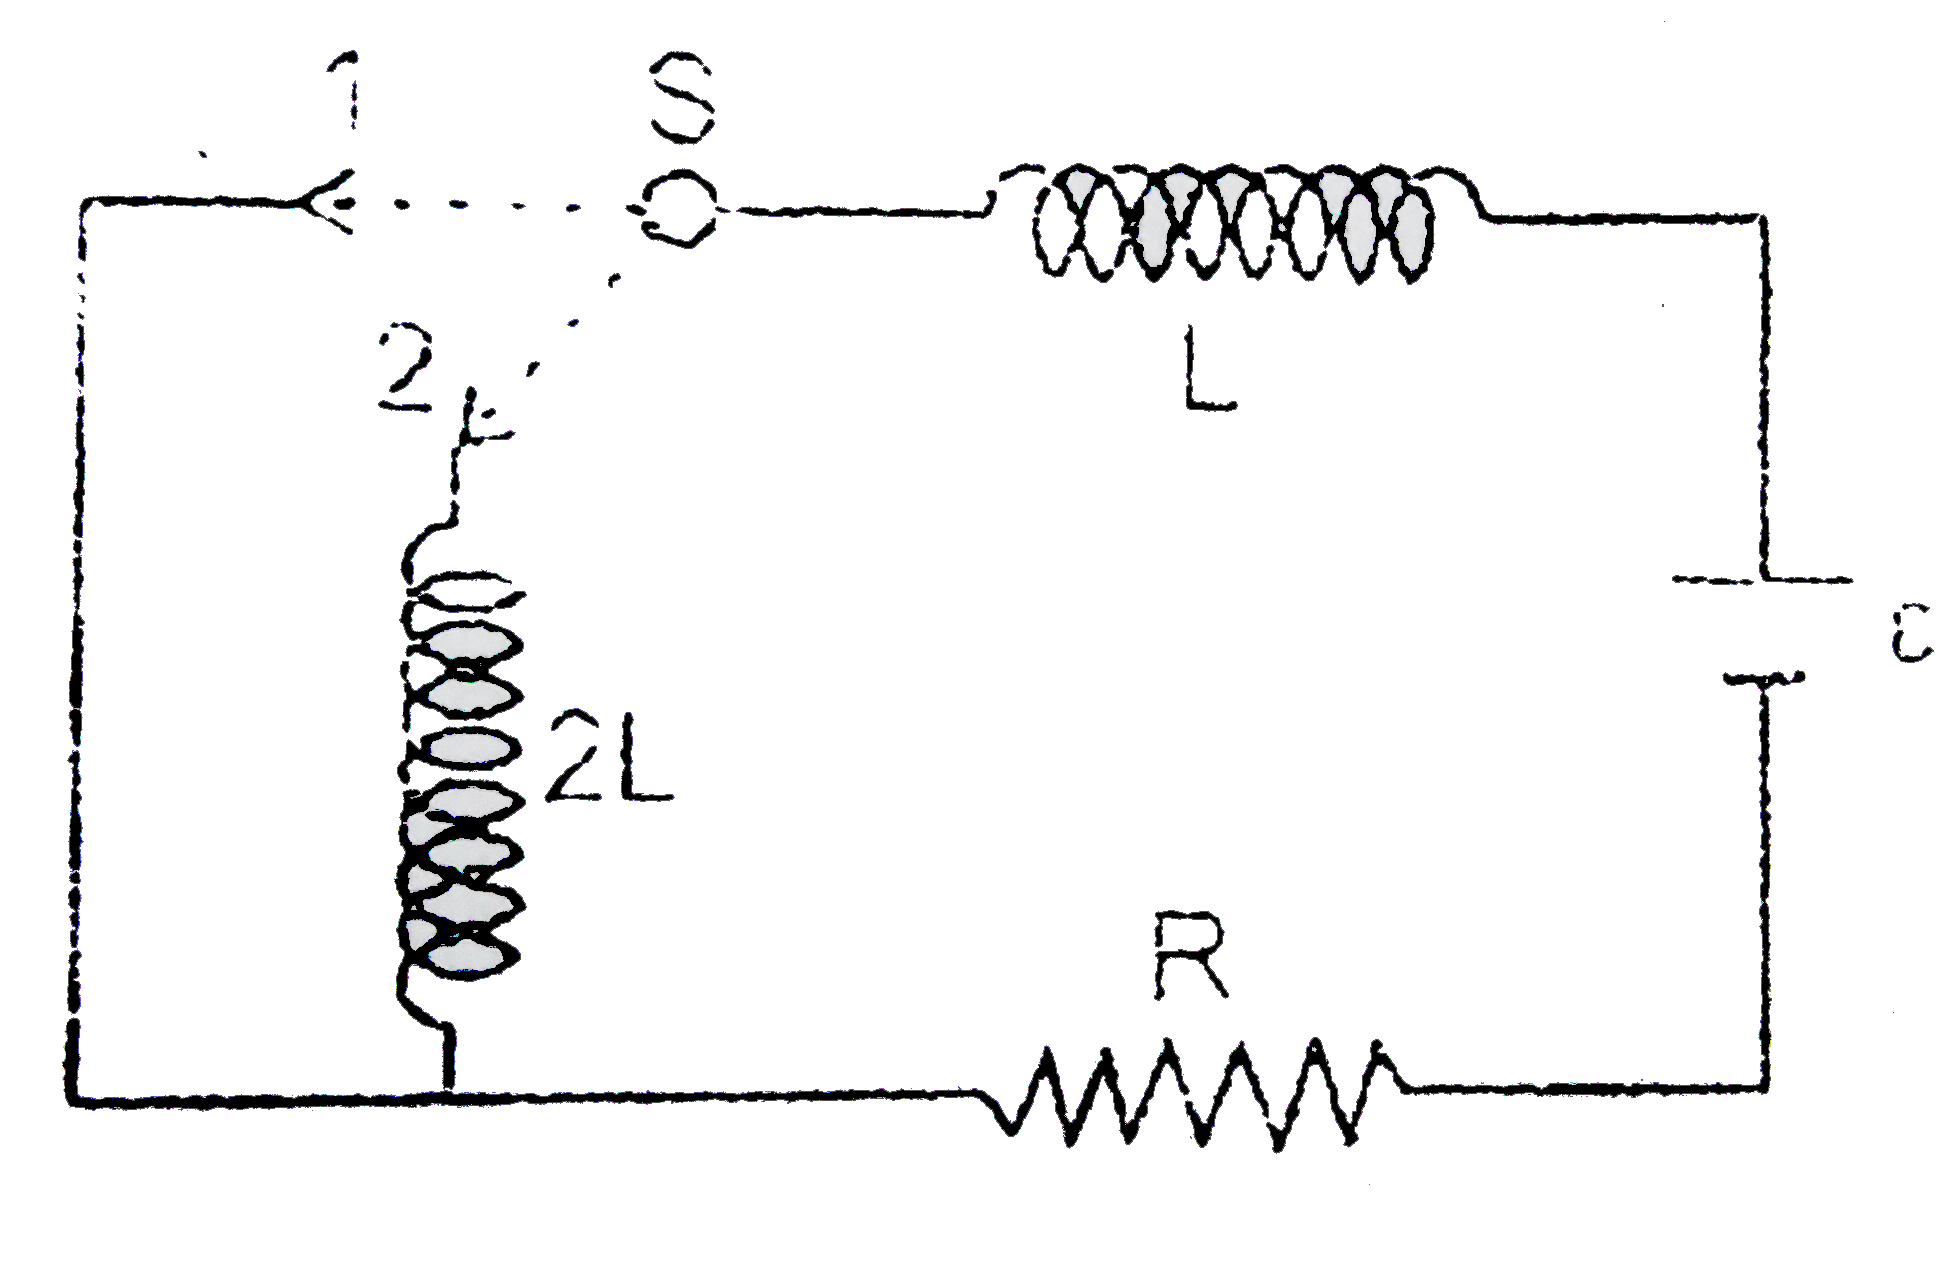
In the circuit shown, the switch S is shifted to position 2 from position 1 at t=0, having been in position 1 for a long time.Find the current in the circuit as a function of time.
 View Solution
In the circuit shown, the switch S is shifted to position 2 from position 1 at t=0, having been in position 1 for a long time.Find the current in the circuit as a function of time.
 View Solution
In the circuit shown, the switch S is shifted to position 2 from position 1 at t=0, having been in position 1 for a long time.Find the current in the circuit as a function of time.
 View Solution
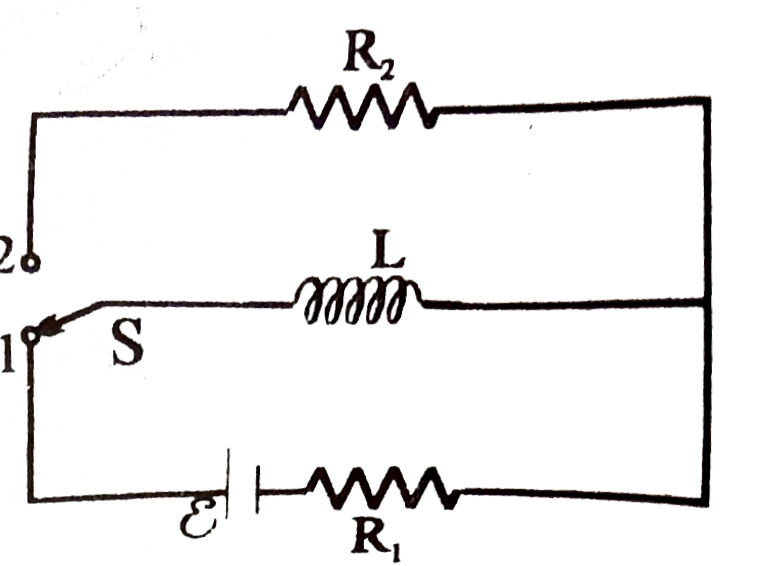
In the circuit shown, initially the switch is in position 1 for a long time. Then the switch is shifted to position 2 for a long time. Find the total heat produced in R2
 View Solution
In the circuit shows in Fig switch S is shifed to position 2 from position 1 at t=0, having been on position 1 for a long time. The current in the circuit just after shifting of switch will be (battery and both the inductors are ideal)
 View Solution
In the circuit shown, the switch has been in position 1 for a long time. Now the switch is shifted to position 2. If this instant is taken as t = 0, then at time t=π2
 View Solution
In the circuit shown, the switch has been in position 1 for a long time. Now the switch is shifted to position 2. If this instant is taken as t = 0, then at time t=π2
 View Solution

