The figure represents the voltage applied across a pure inductor. The diagram which correctly represents the variation of curent i with time t is given by
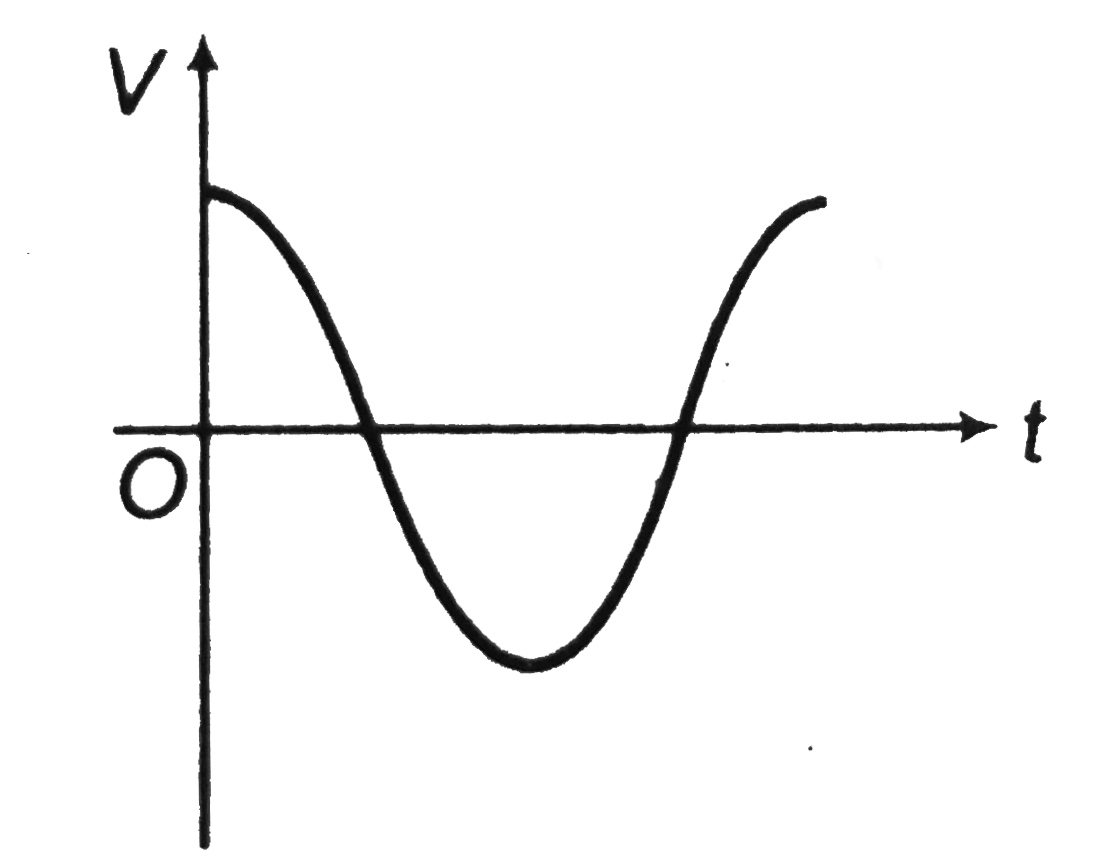 .
.
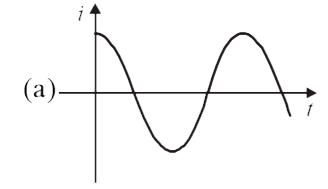
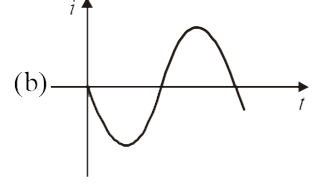
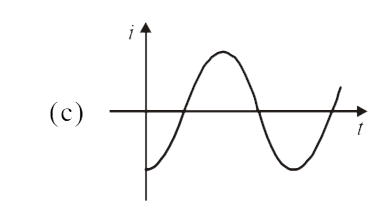
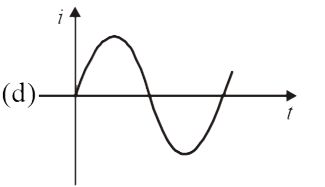
Step by step video & image solution for The figure represents the voltage applied across a pure inductor. The diagram which correctly represents the variation of curent i with time t is given by . by Physics experts to help you in doubts & scoring excellent marks in Class 12 exams.
Updated on:21/07/2023Topper's Solved these Questions
Similar Questions
Knowledge Check
Which of the following diagrams correctly represents the counter pattern ?
A B
B C
C D
D
The figure shows P - V diagram of a thermodynamic cycle
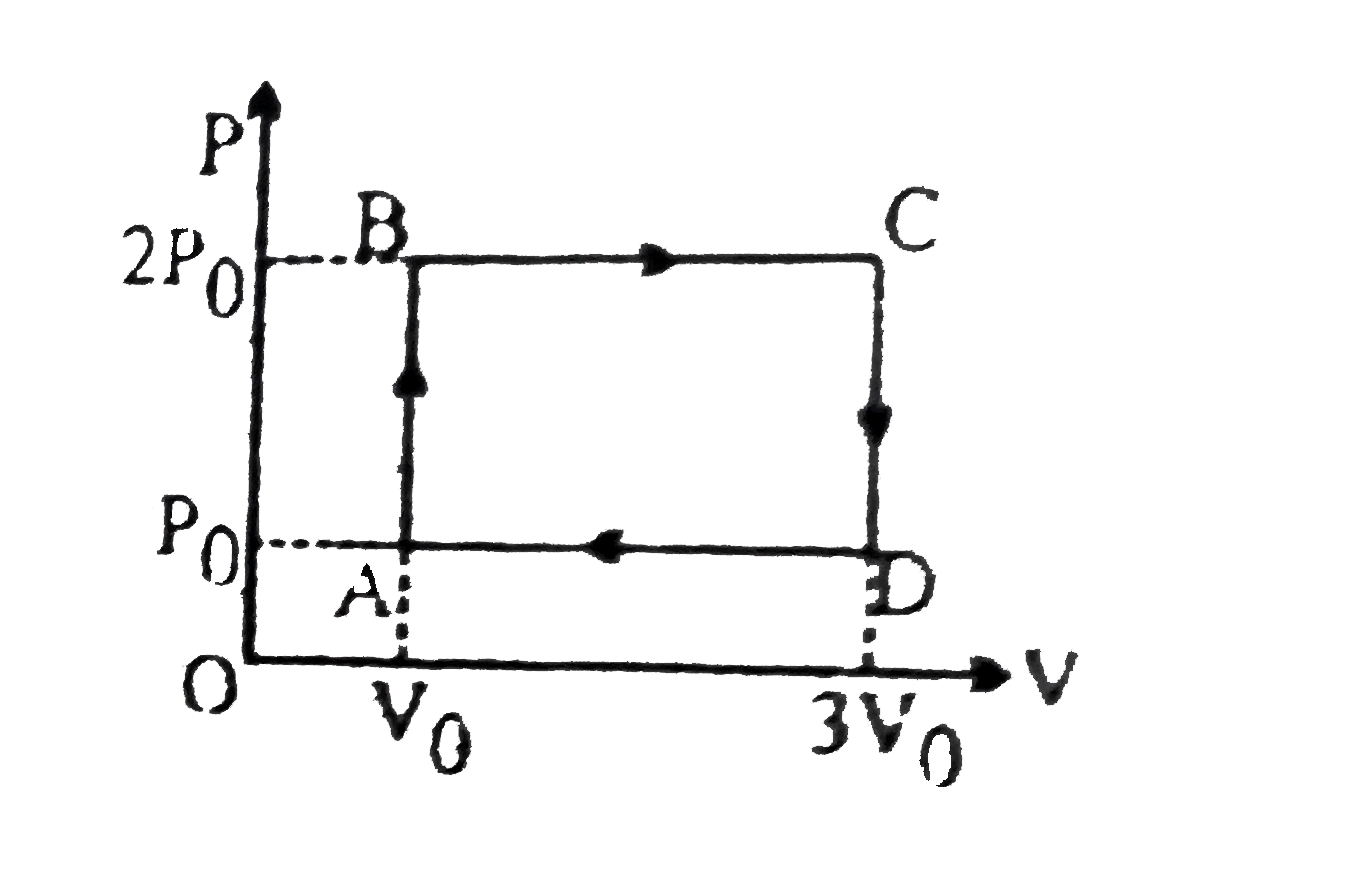
Identify the diagram which correctly represents the heat inflow and outflow of the systemA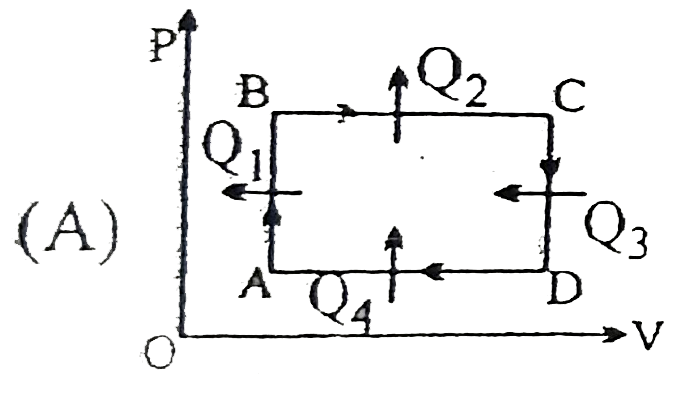 B
B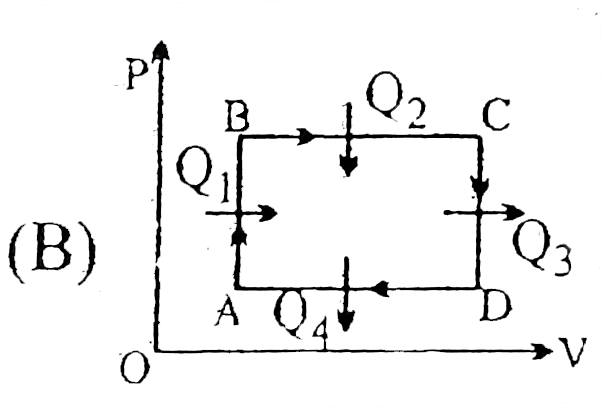 C
C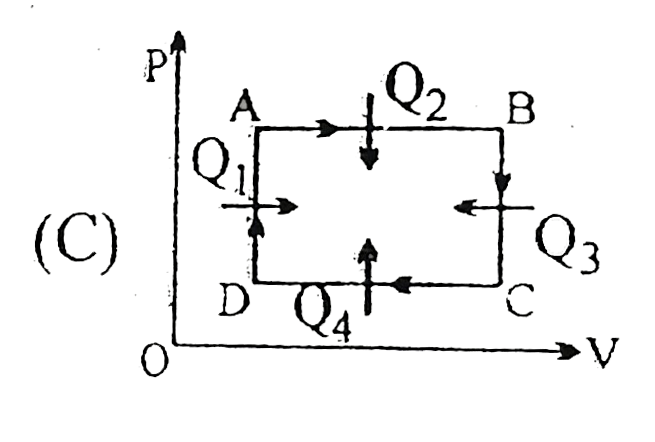 D
D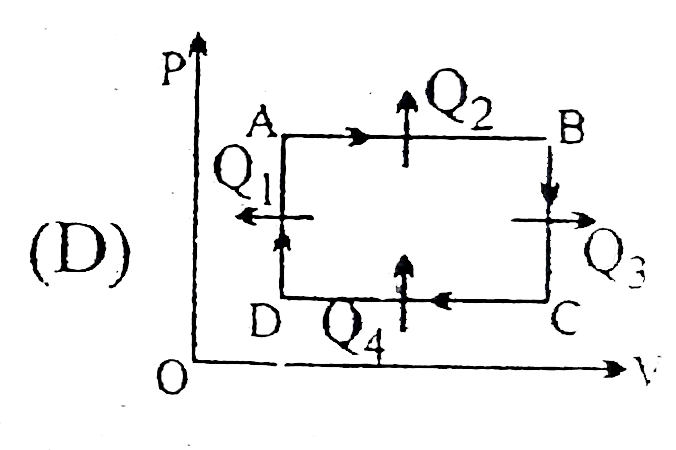
Which of the following correctly represents the type of fruits given
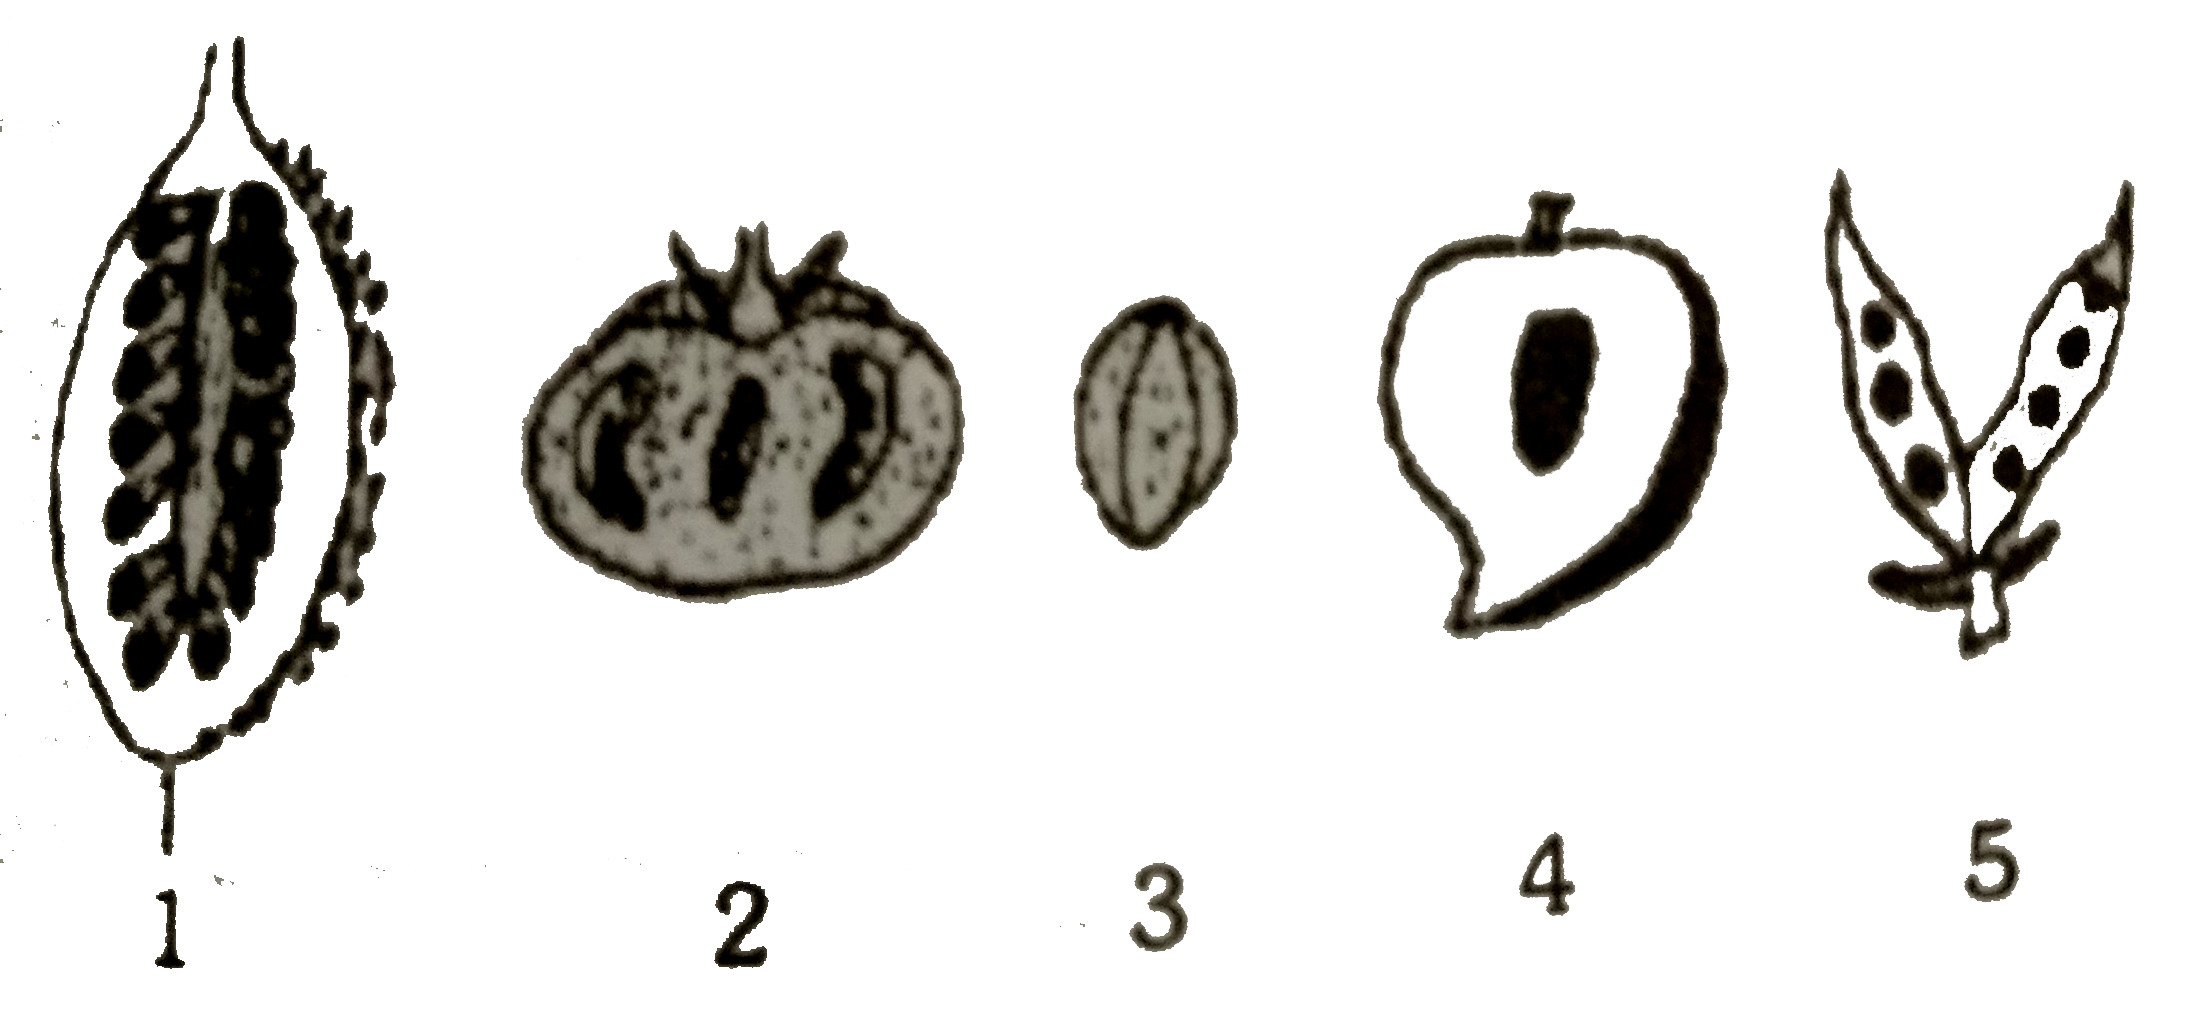 A1. Berry , 2. Caryopsis , 3. Drupe , 4. Sorosis , 5. AggregateB2. Berry , 3. Caryopsis , 4. Drupe , 1. Sorosis , 5. AggregateC2. Berry , 3. Caryopsis , 4. Drupe , 5. Legume , 1. AggregateD2. Berry , 3. Caryopsis , 4. Drupe , 1. Sorosis , 5. Legume
Which of the following diagrams correctly represents the relationship amongst .
Tiger , Elephant , Animal .

View SolutionFor the diagram given for an ideal gas, out of the following which one correctly represent the diagram?
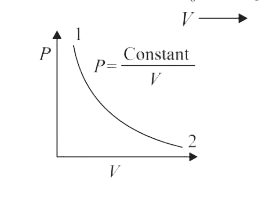
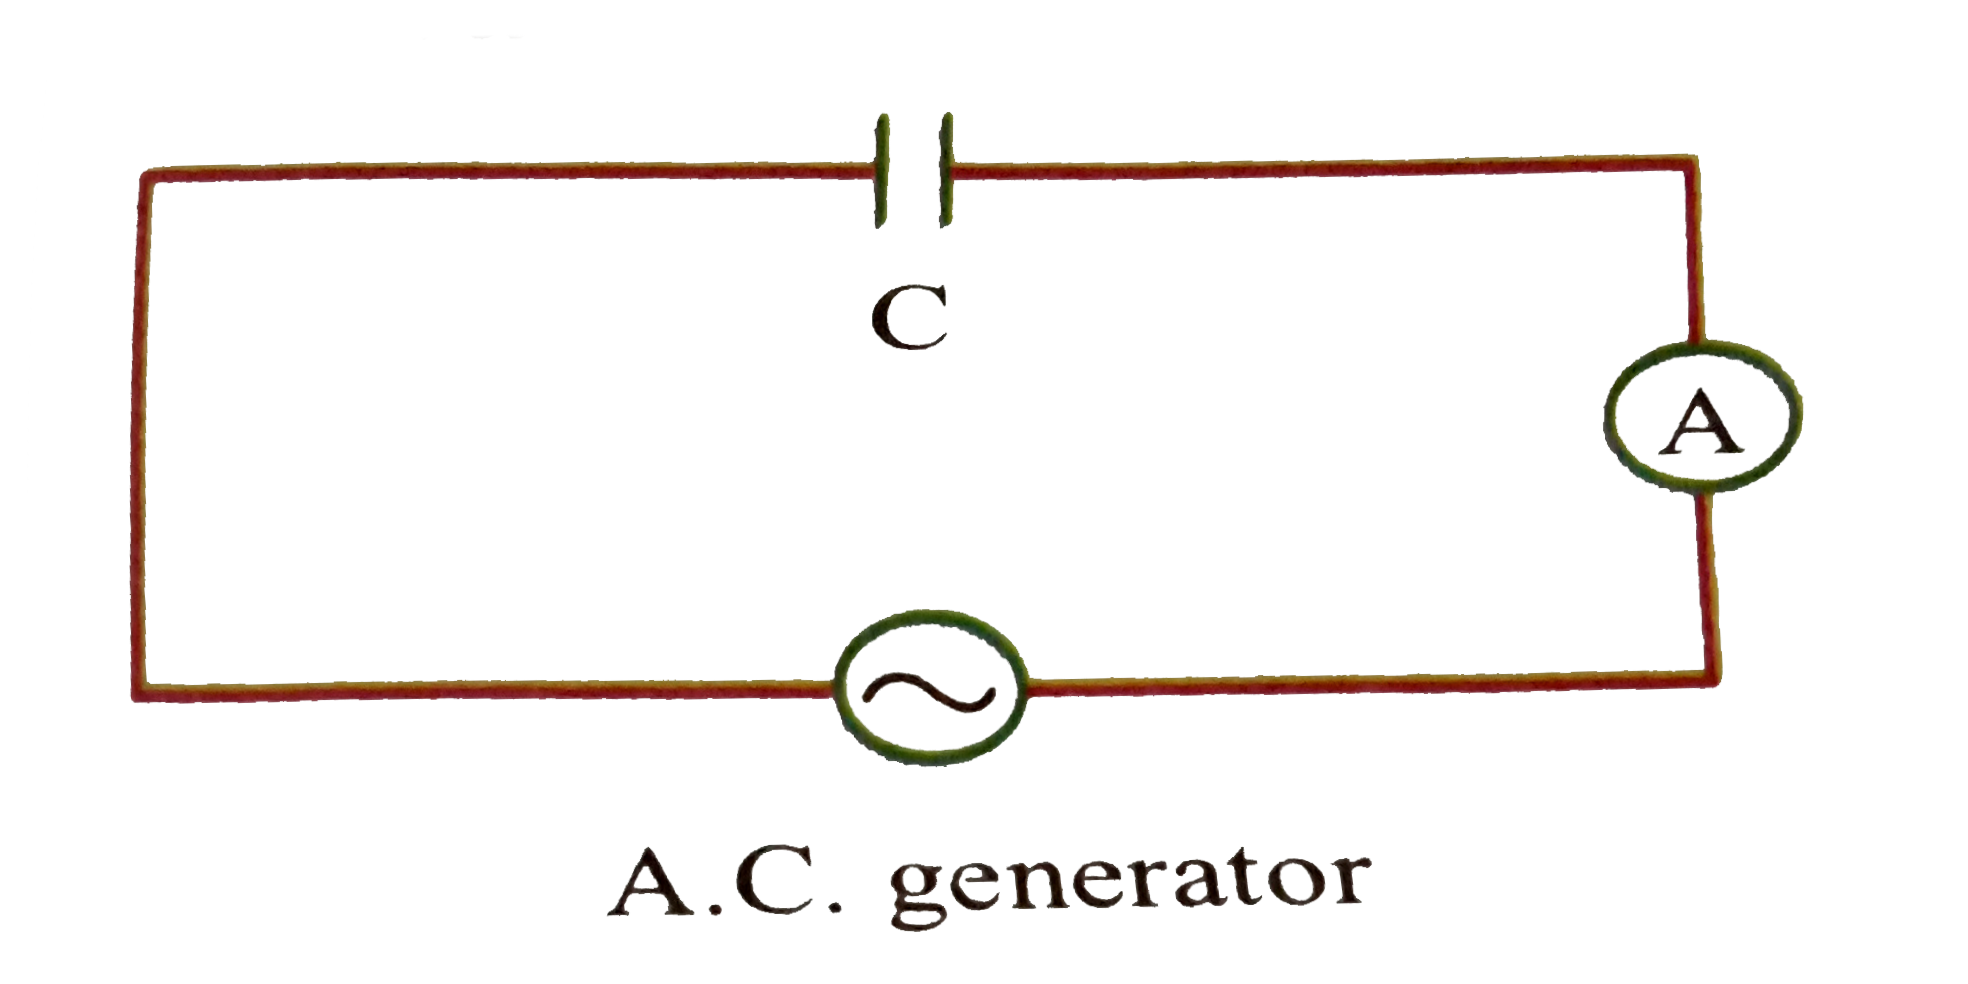
View SolutionA constant voltage at different frequencies is applied across a capacitance C as shown in the figure. Which of the following graphs correctly depicts the variation of current with frequency
View SolutionWhich diagram correctly represents the relationship between politicians, poets and women?
View SolutionA constant voltage at different frequencies is applied across a capacitance C as shown in the figure.
Which of the following graphs correctly depicts the variation of current with frequency?
View Solution


