The table above shows the distribution of vehicles at a used car lot by type and by mileage. According to the data, which type of vehicles on the lot has the smallest percentage with less than 50, 000 miles?
2- door car
4-door car
SUV
Truck
The correct Answer is:B
Difficult: Medium
Category: Problem Solving and Data Analysis/ Statistics and Probability.
Strategic Advice: You rarely need to use all of the information presented in a table to answer a data analysis question. Read the question carefully to make sure you use only what you need.
Getting to the Answer: To calculate the percentage of the vehicles for each type that has less than 50,000 miles (m<50,000), divide the number of vehicles of that type with less than 50,000 miles by the by the total number of vehicles of that type.
A:2−door car=948=0.1875
B:4−door car=1698=0.1633
C:SUV=1994=0.2021
D:Truck=1260=0.2
Choice (B) is correct because 16.33% is a lower percentage than any of the other types of vehicles.
Topper's Solved these Questions
Similar Questions
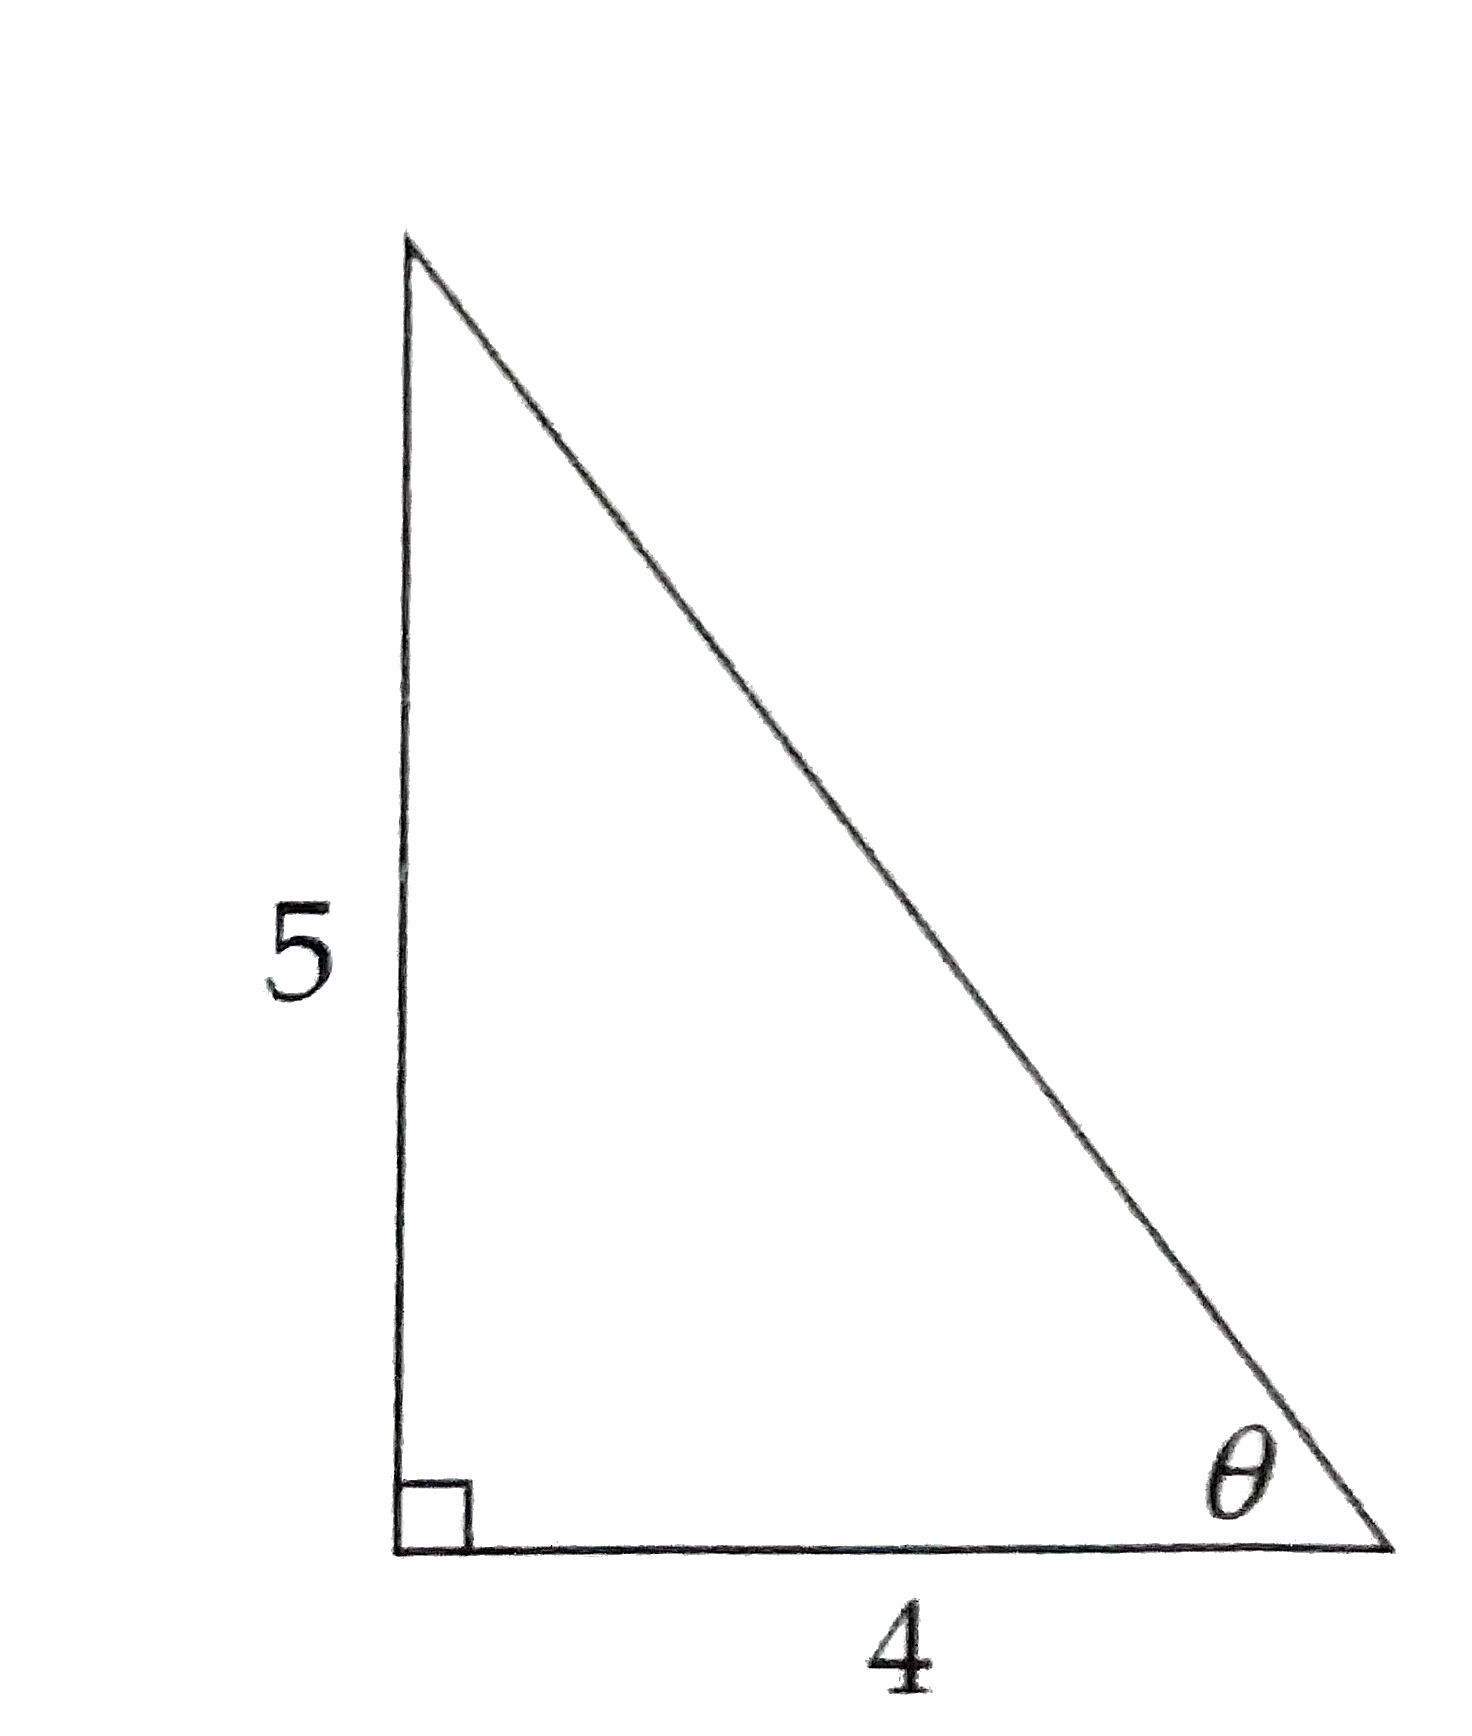
What is the value of θ ?

View SolutionHow many lines of symmetry does the above figure have ?
View SolutionWhich of the following are correct chain isomers of butane ? (i)
View SolutionDetermine the point of symmetry of a regular hexagon.
View SolutionDtermine the images of the following figure about the given line :
View SolutionMatch the following Column A to Column B

View SolutionMatch the following Column A to Column B

View SolutionMatch the following Column A to Column B

View SolutionFind the area of the figure given below.

View SolutionThe area of the shaded part in the figure given below is ______.

View SolutionThe inequation represented by the graph given below is :
View SolutionThe inequation that best describes the graph given below is _________
View SolutionThe inequation that best describes the following graph is _________
View SolutionWhich inequations represent the shaded region in the given figure
View SolutionMatch the followings (column I with column II)
ltimg src="https://d10lpgp6xz60nq.cloudfront.net/physics_images/NCERT_BIO_XI_C03_E01_011_Q01.png" width="80%"gt
View Solution
