Which of the following shaded regions shows the graph of the inequality ?
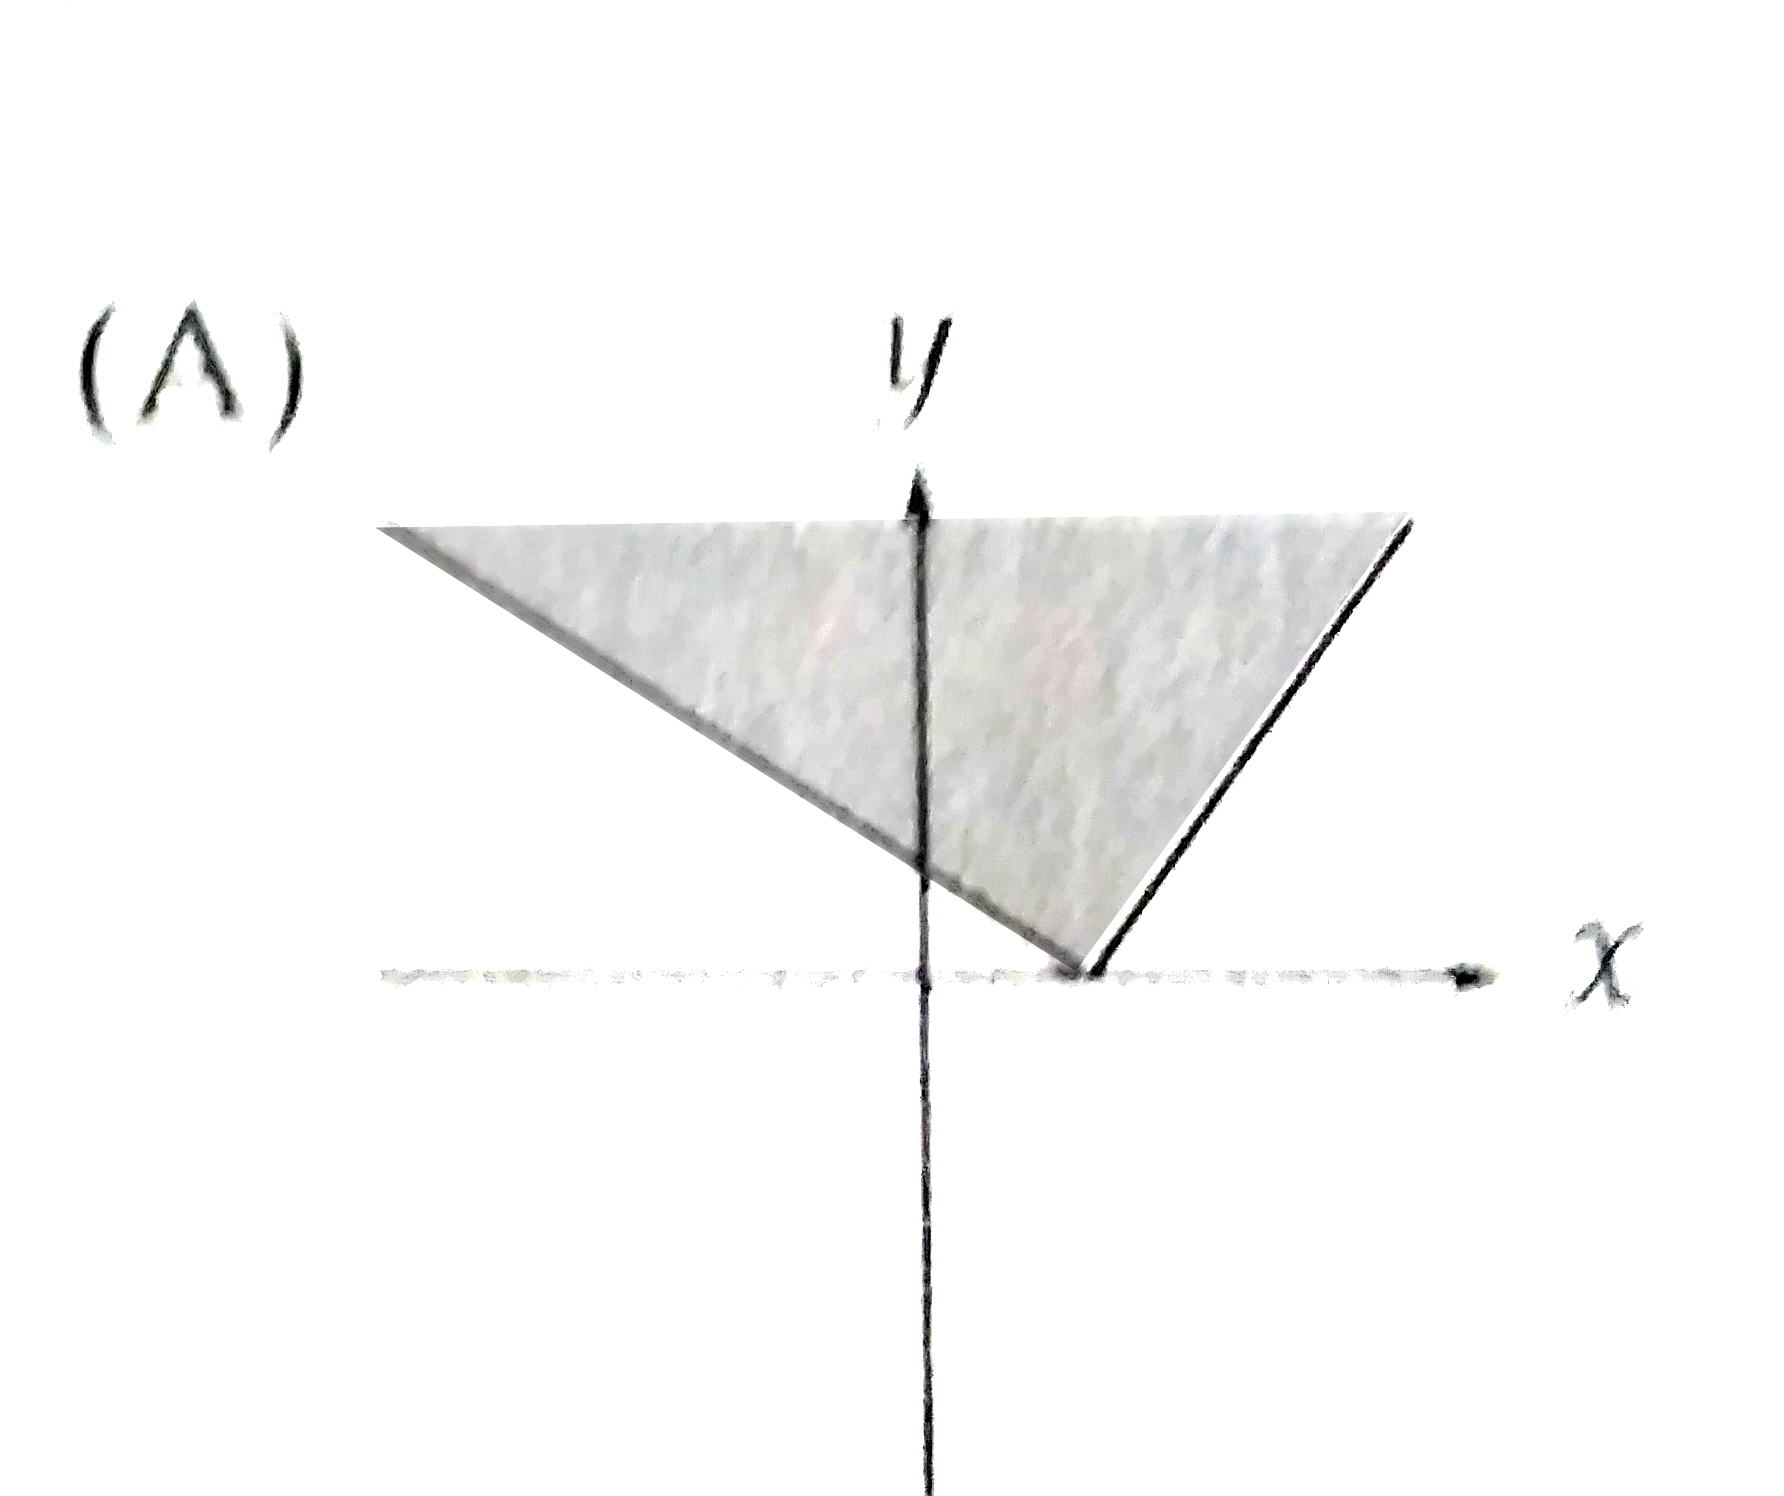
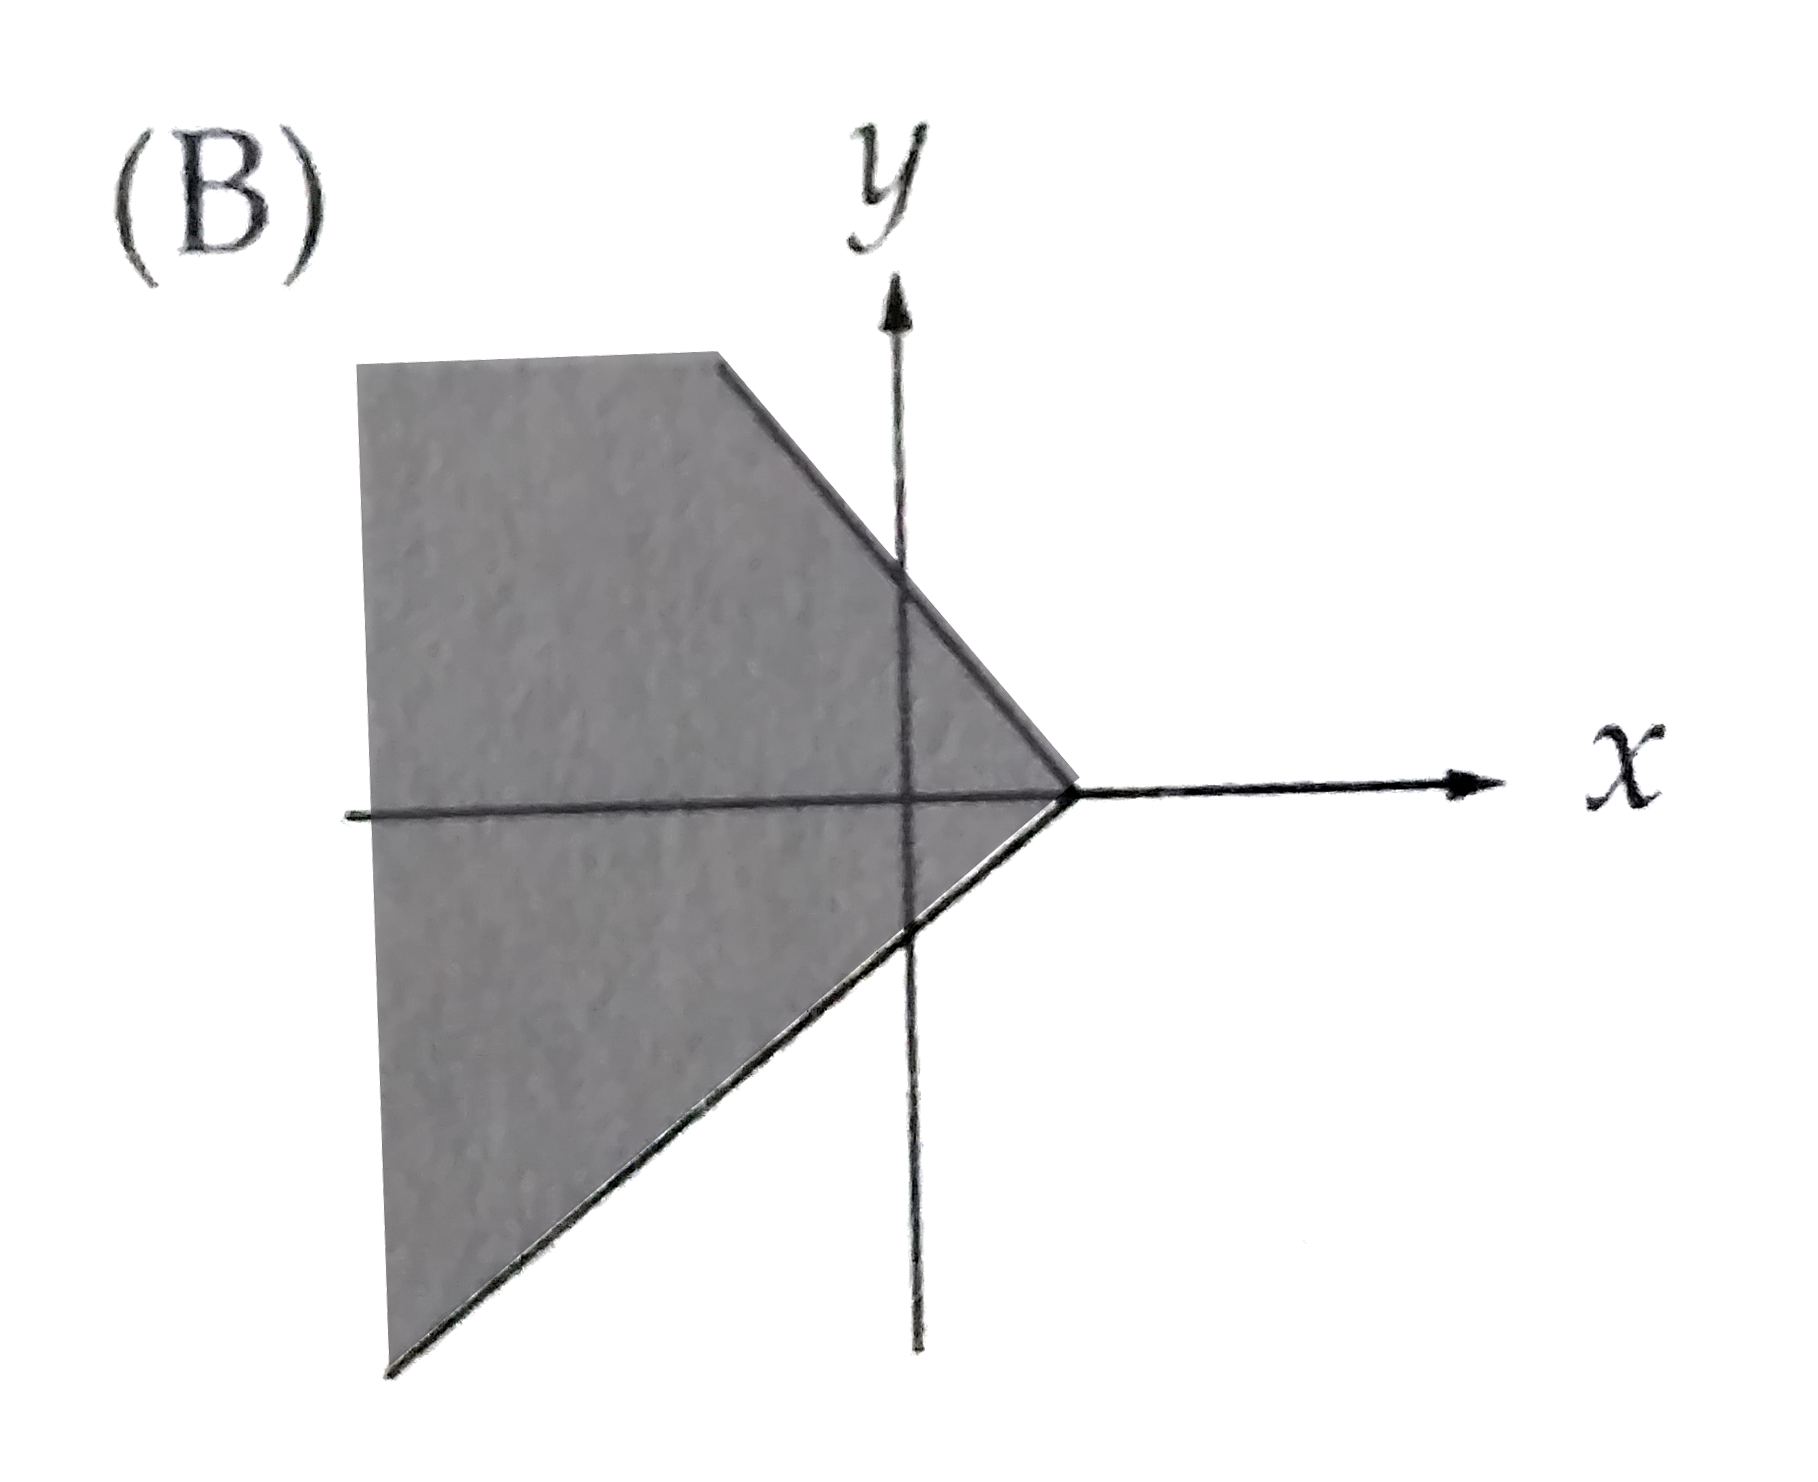
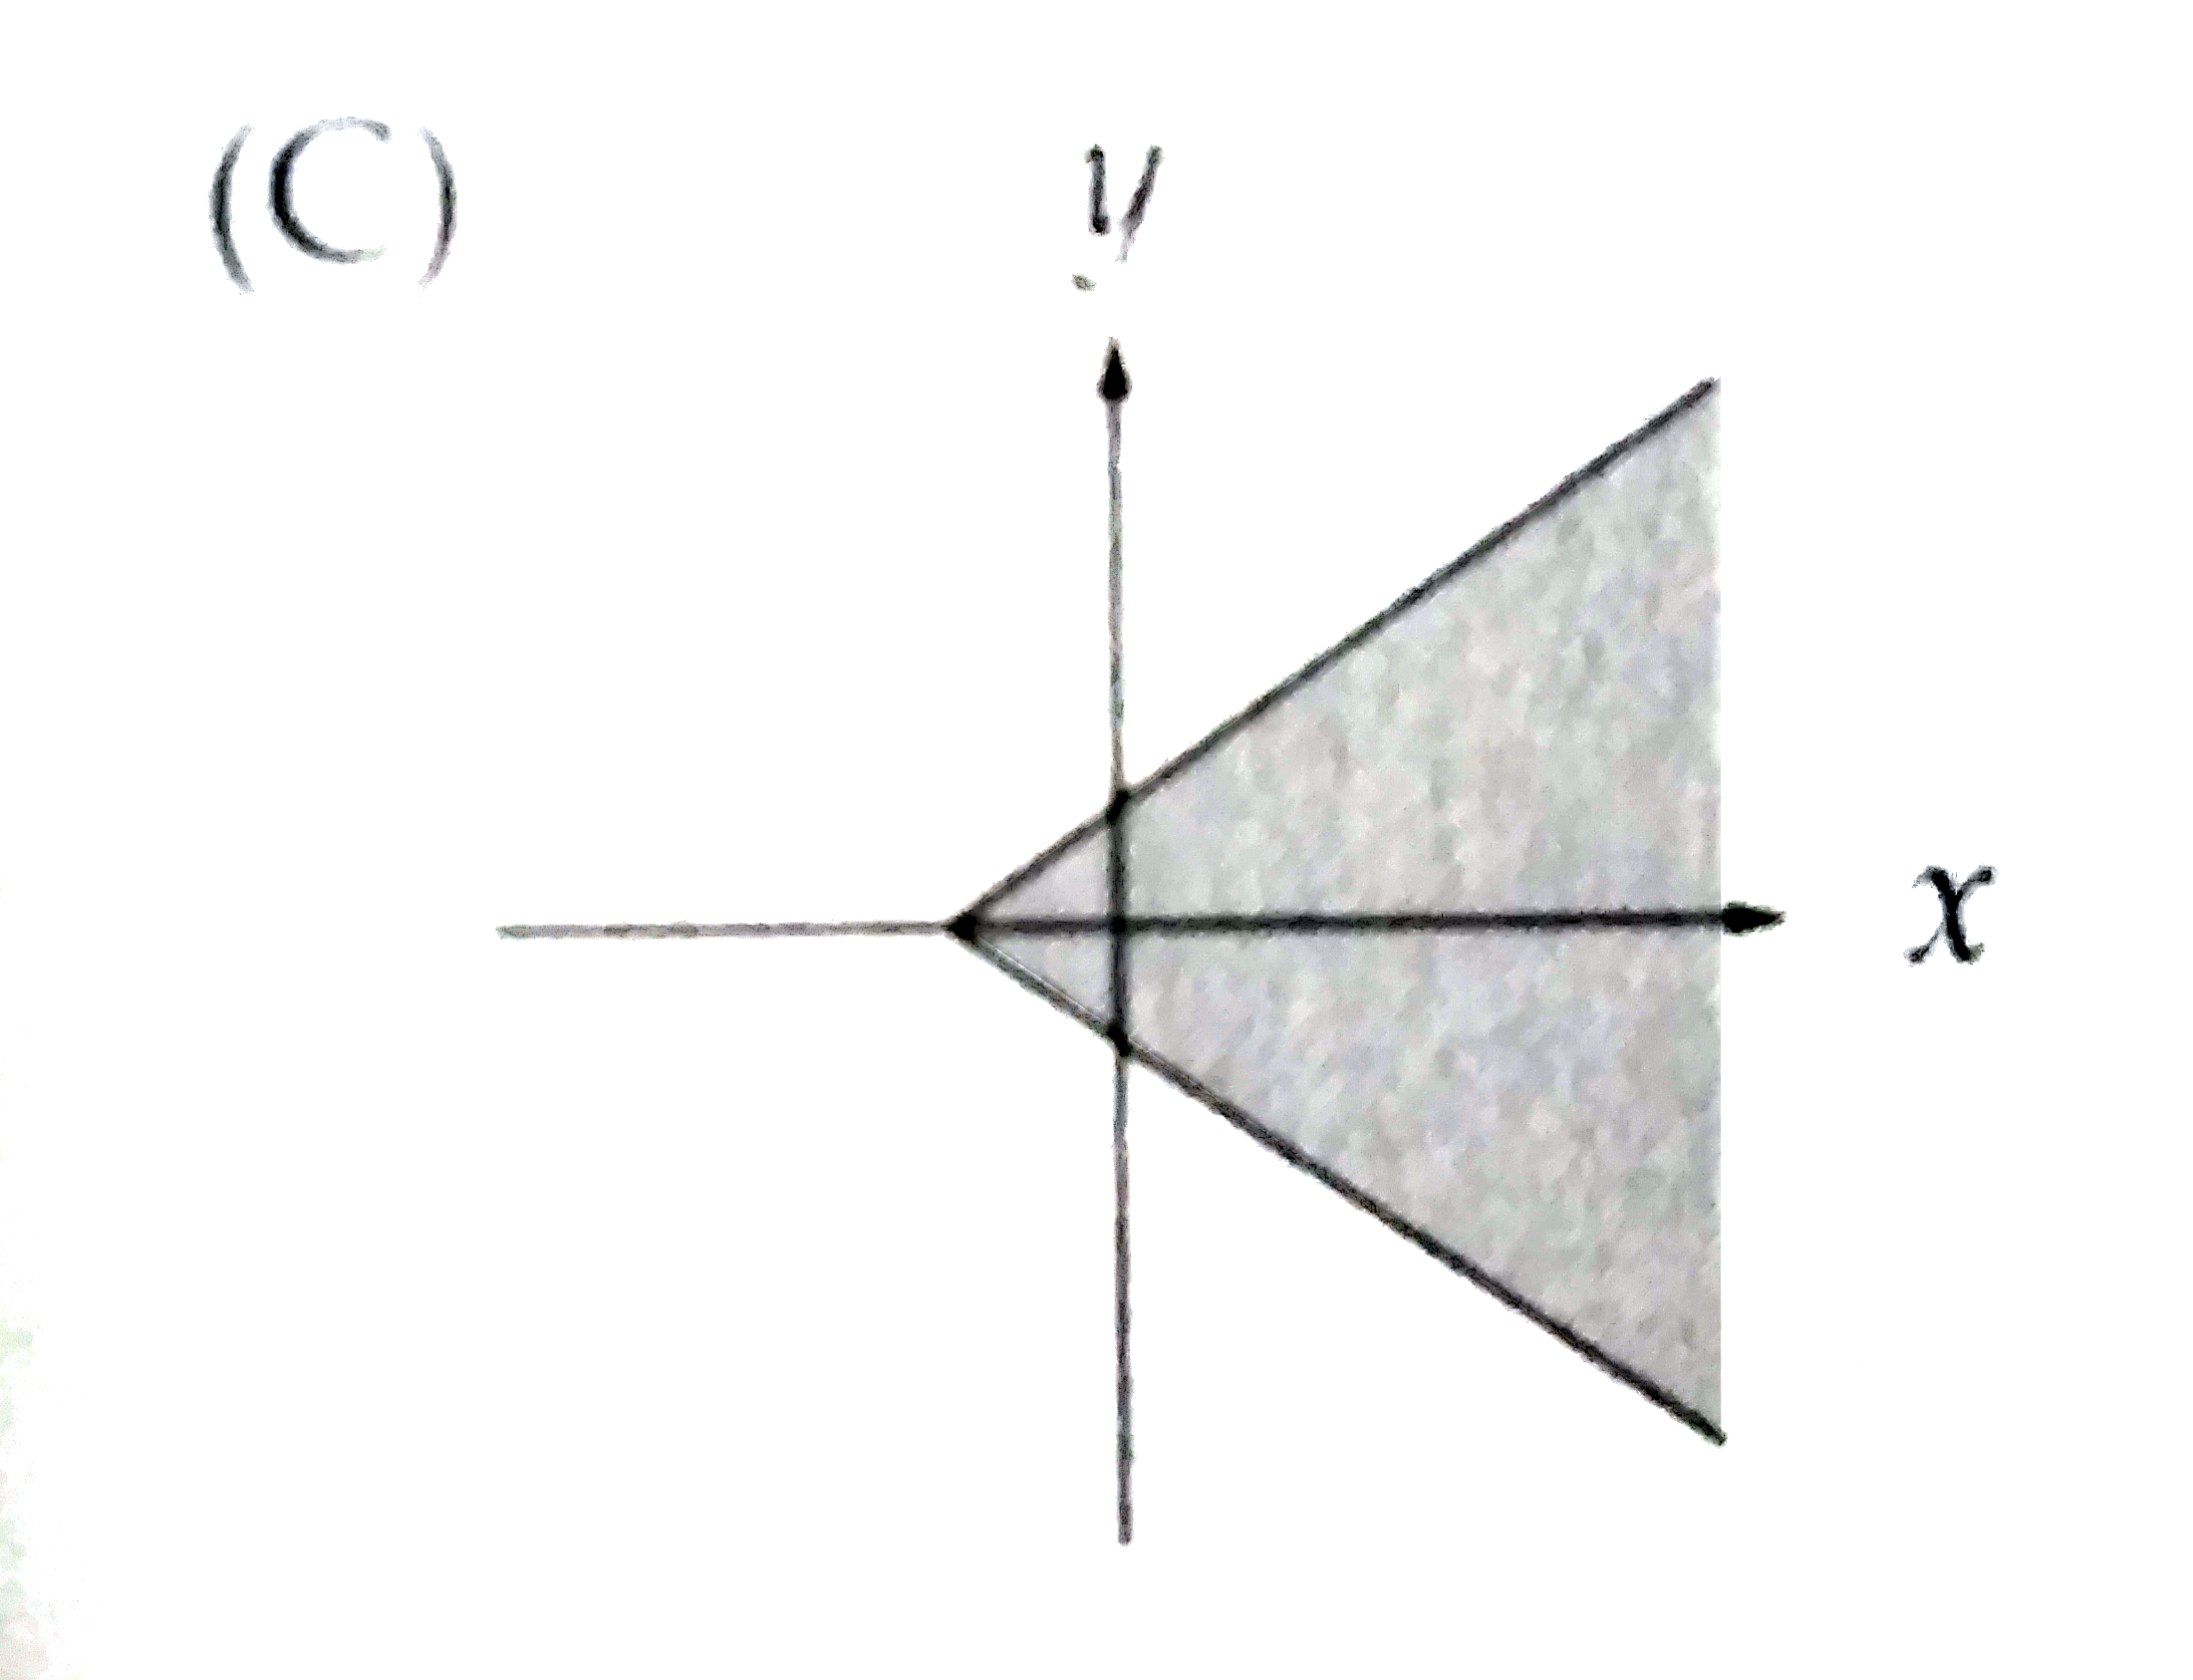
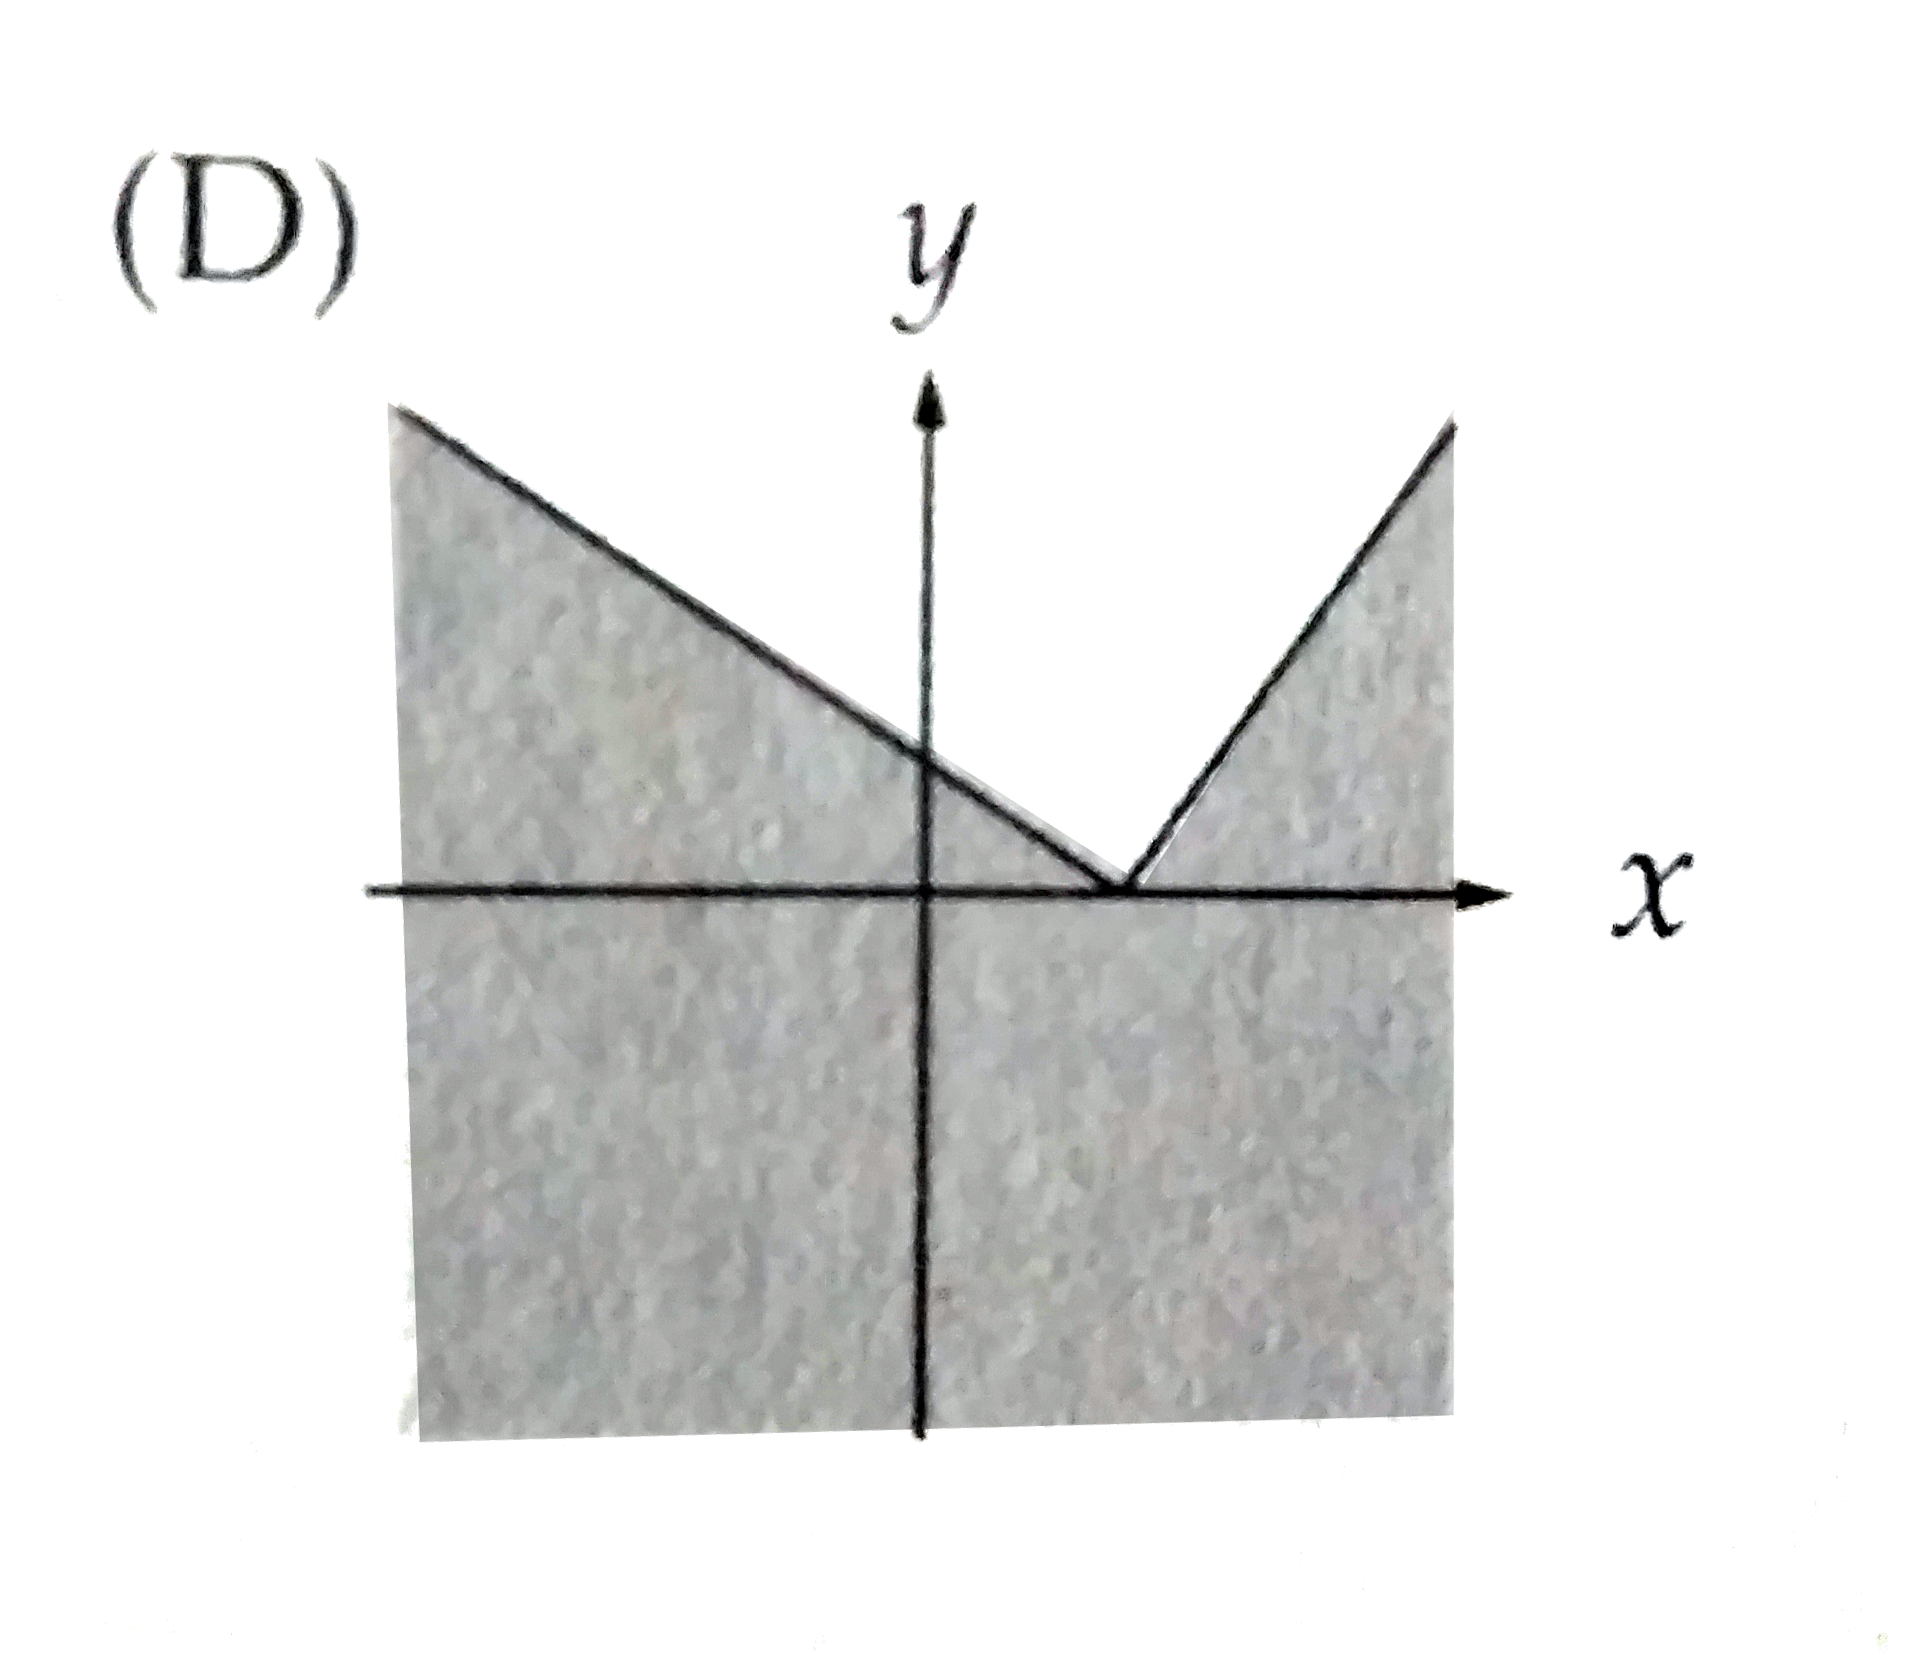
The correct Answer is:D
To solve the inequality y≤|x−2|, we will follow these steps:
Step 1: Understand the Absolute Value Function
The expression |x−2| represents the distance of x from 2 on the number line. This function can be expressed as two separate cases:
- If x≥2, then |x−2|=x−2.
- If x<2, then |x−2|=−(x−2)=2−x.
The expression |x−2| represents the distance of x from 2 on the number line. This function can be expressed as two separate cases:
- If x≥2, then |x−2|=x−2.
- If x<2, then |x−2|=−(x−2)=2−x.
Topper's Solved these Questions
- COORDINATE GEOMETRY Book:KAPLANChapter:COORDINATE GEOMETRY Exercise:COORDINATE GEOMETRY FOLLOW - UP TEST
Explore 6 Videos
- CIRCLESBook:KAPLANChapter:CIRCLESExercise:Multiple Choice Question
Explore 12 Videos
- EXPONENTS, RADICALS, POLYNOMIALS, AND RATIONAL EXPRESSIONS Book:KAPLANChapter:EXPONENTS, RADICALS, POLYNOMIALS, AND RATIONAL EXPRESSIONS Exercise:Multiple Choice Question
Explore 20 Videos
Similar Questions
Knowledge Check
x<4−2y
y≤−2x+1
Which of the following orfdered pairs satisfies both of the inequalities above ?A(−1,3)B(1,1)C(2,−3)D(4,4)Consider the inequality y≥ax2+bx+c, where a , b and c are all positive . Which of the following regions could be the solution set of the inequality ?
A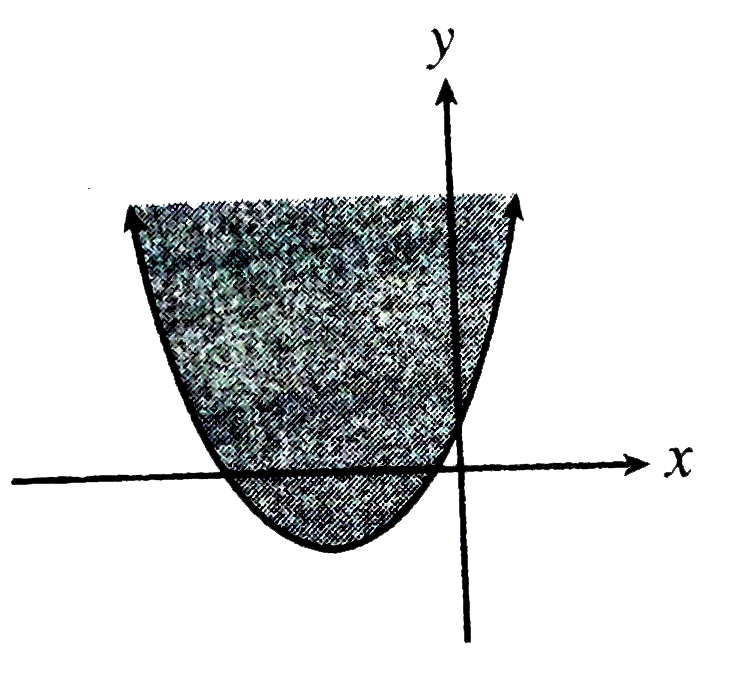 B
B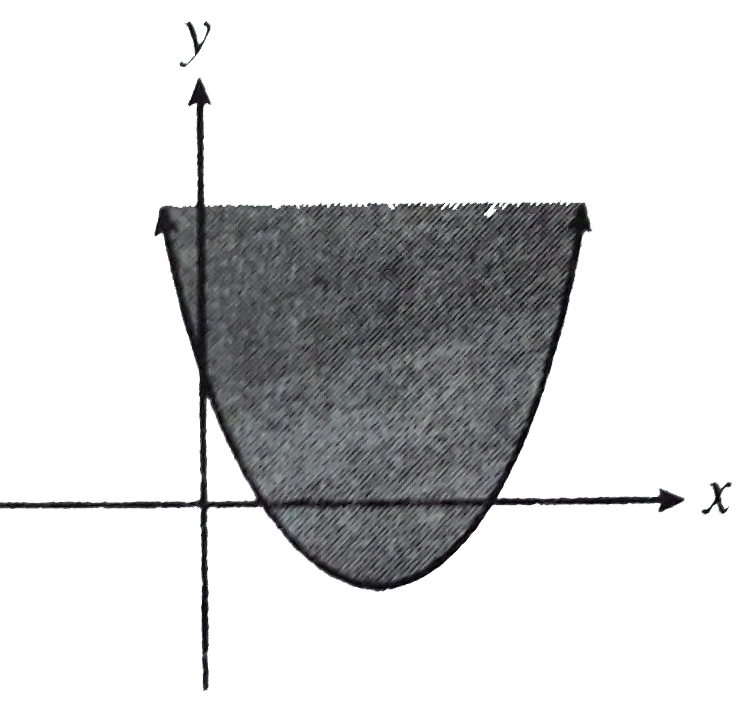 C
C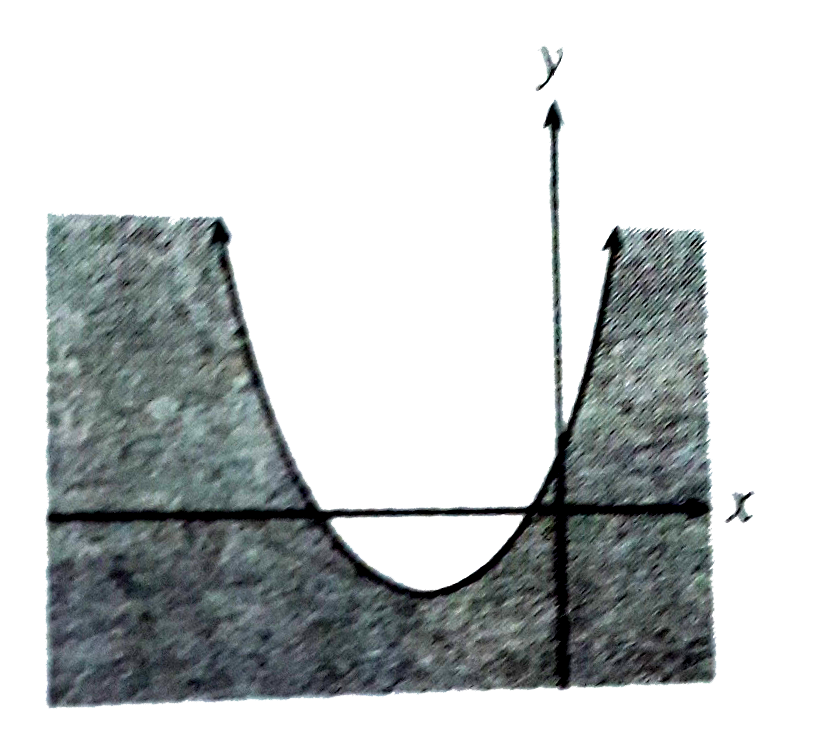 D
D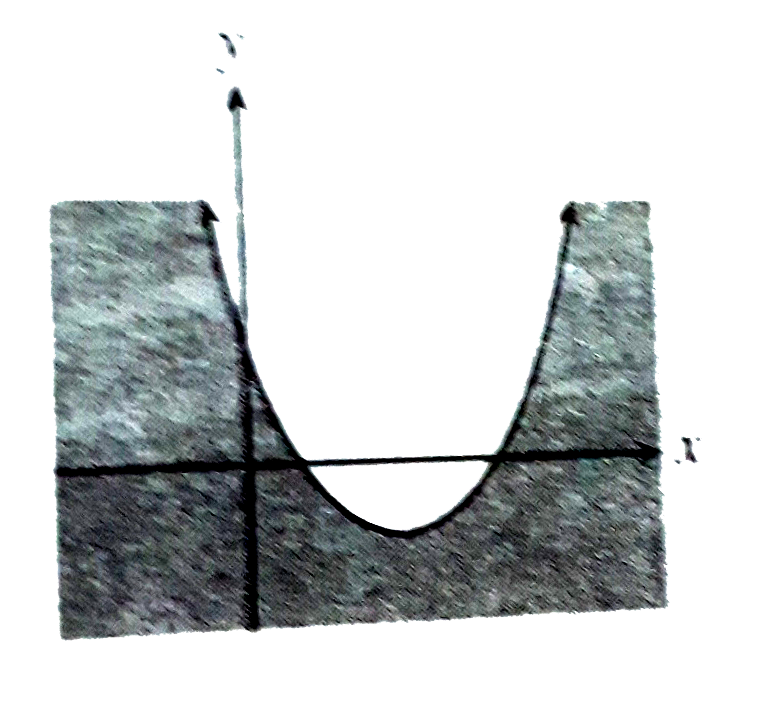
−2y≤8
y−3≤x
−13y+1≥x
Which of the following graphs shows the solutions to the system of inequalities above?A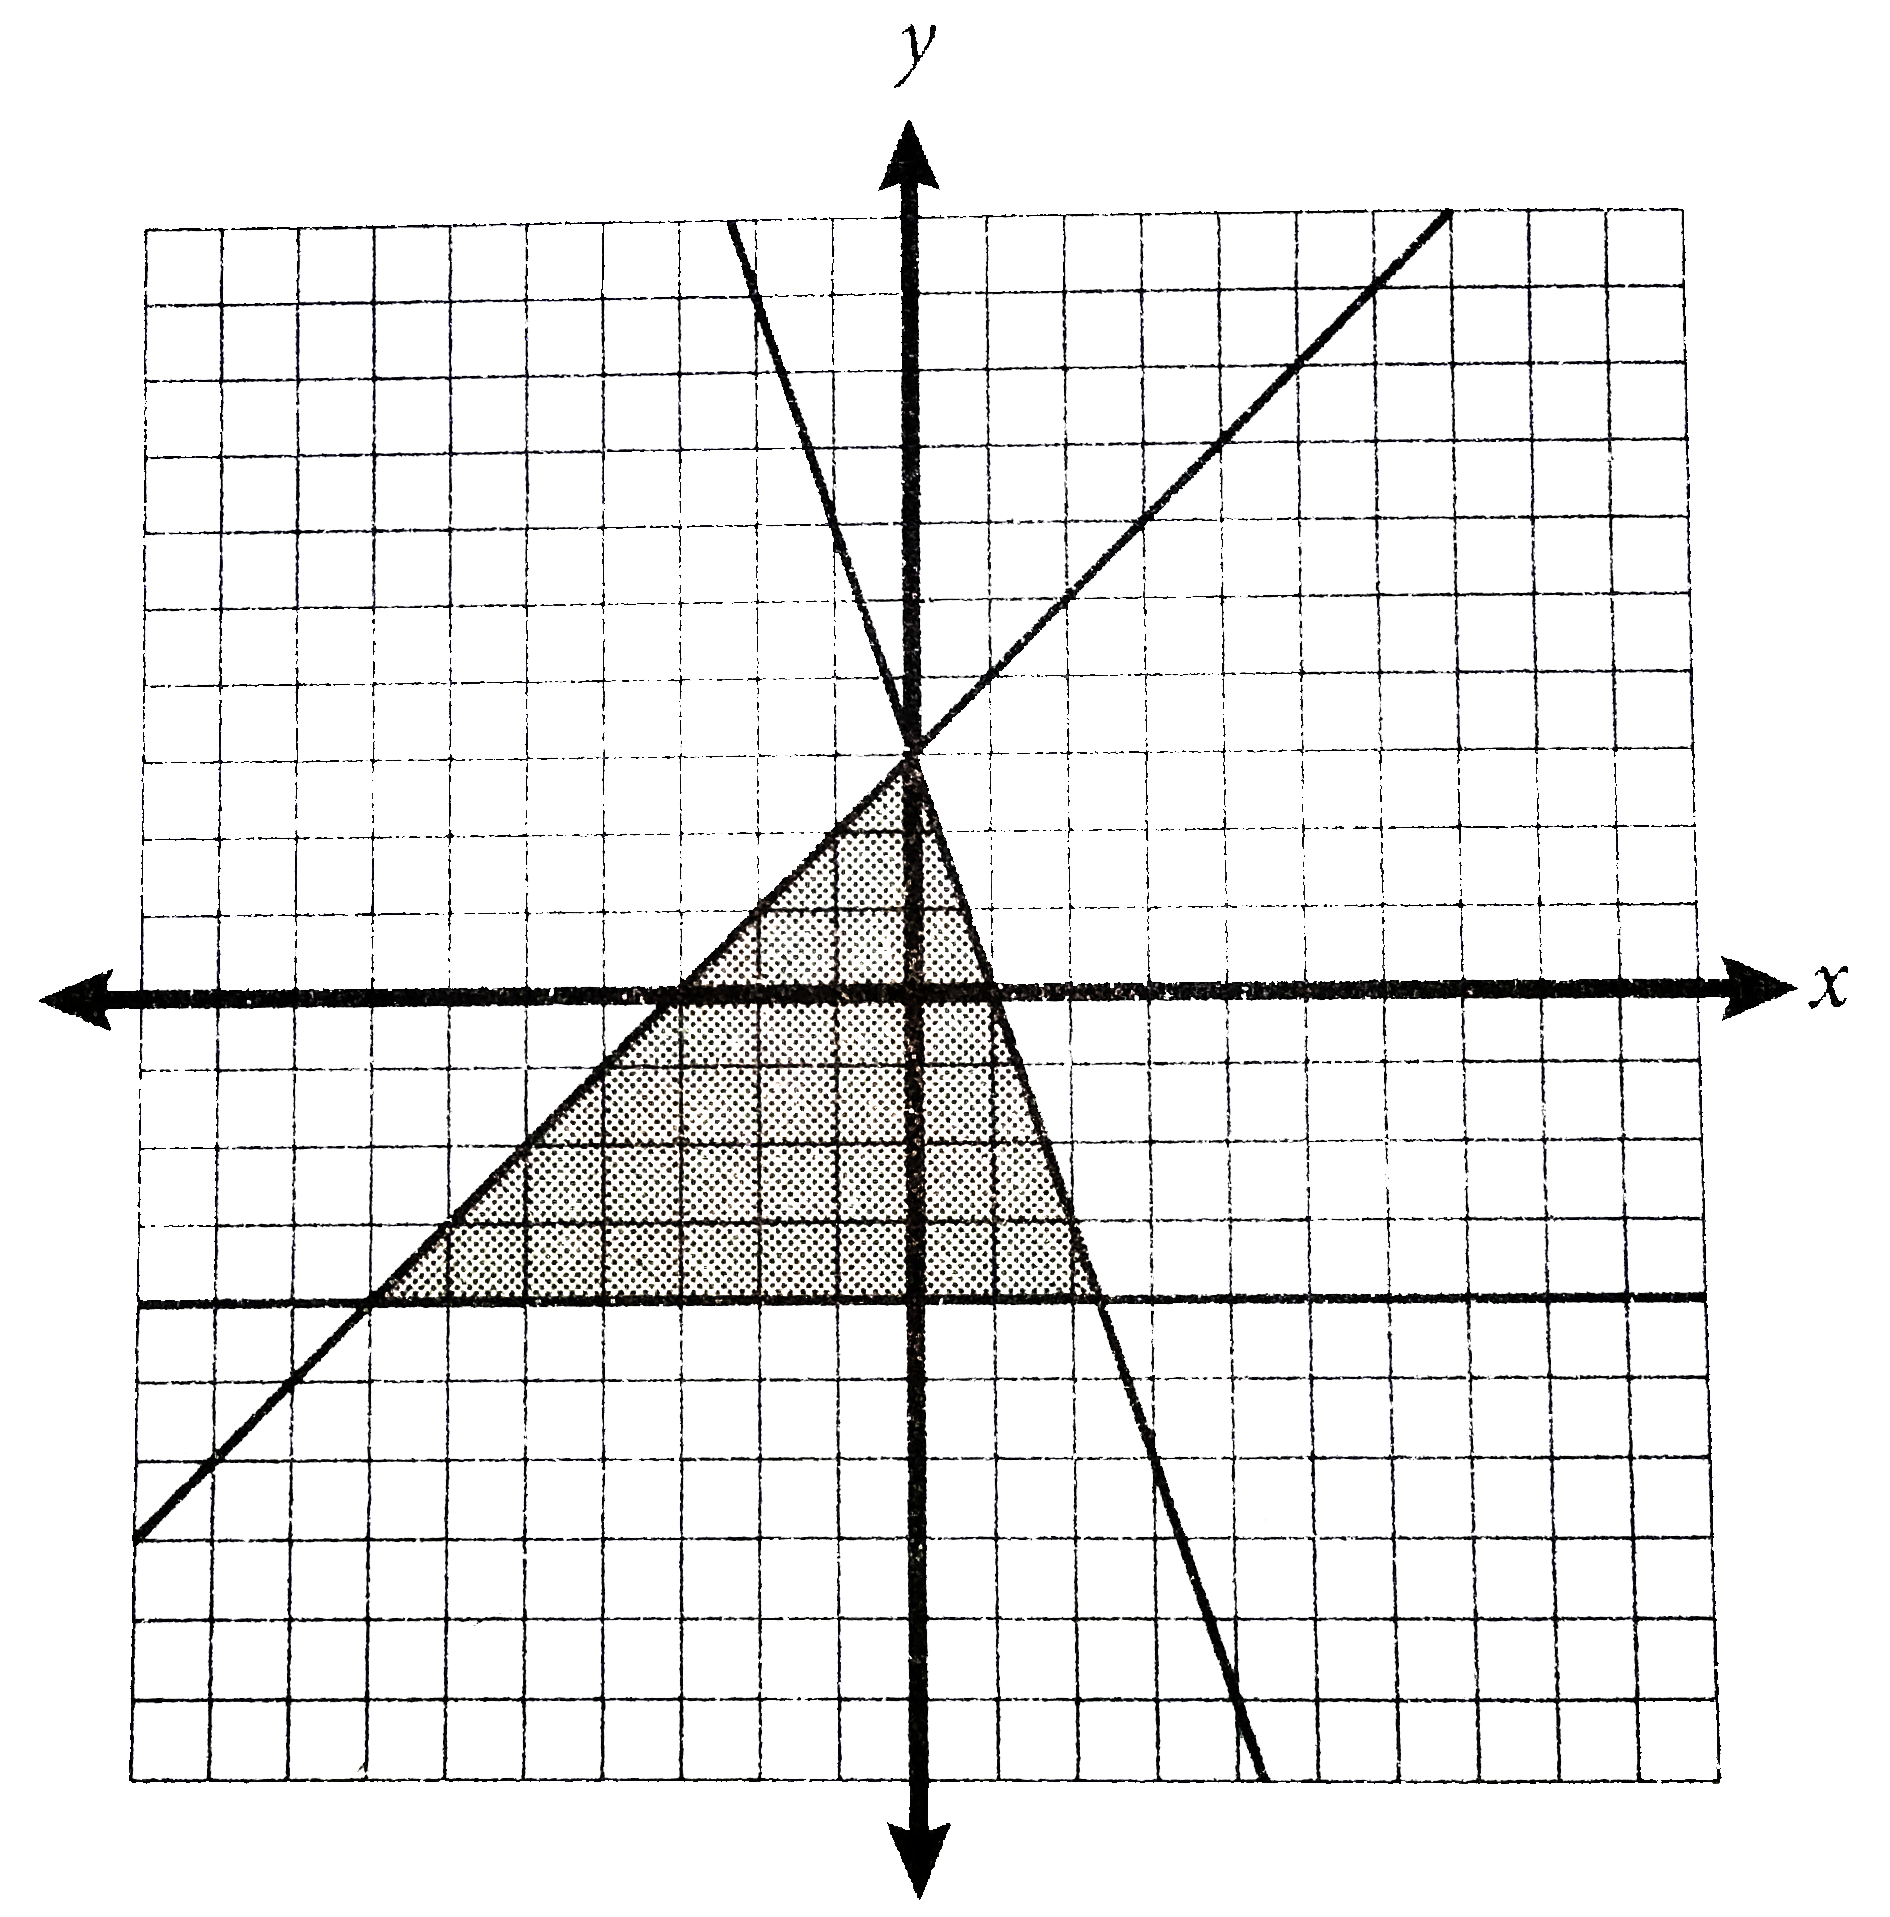 B
B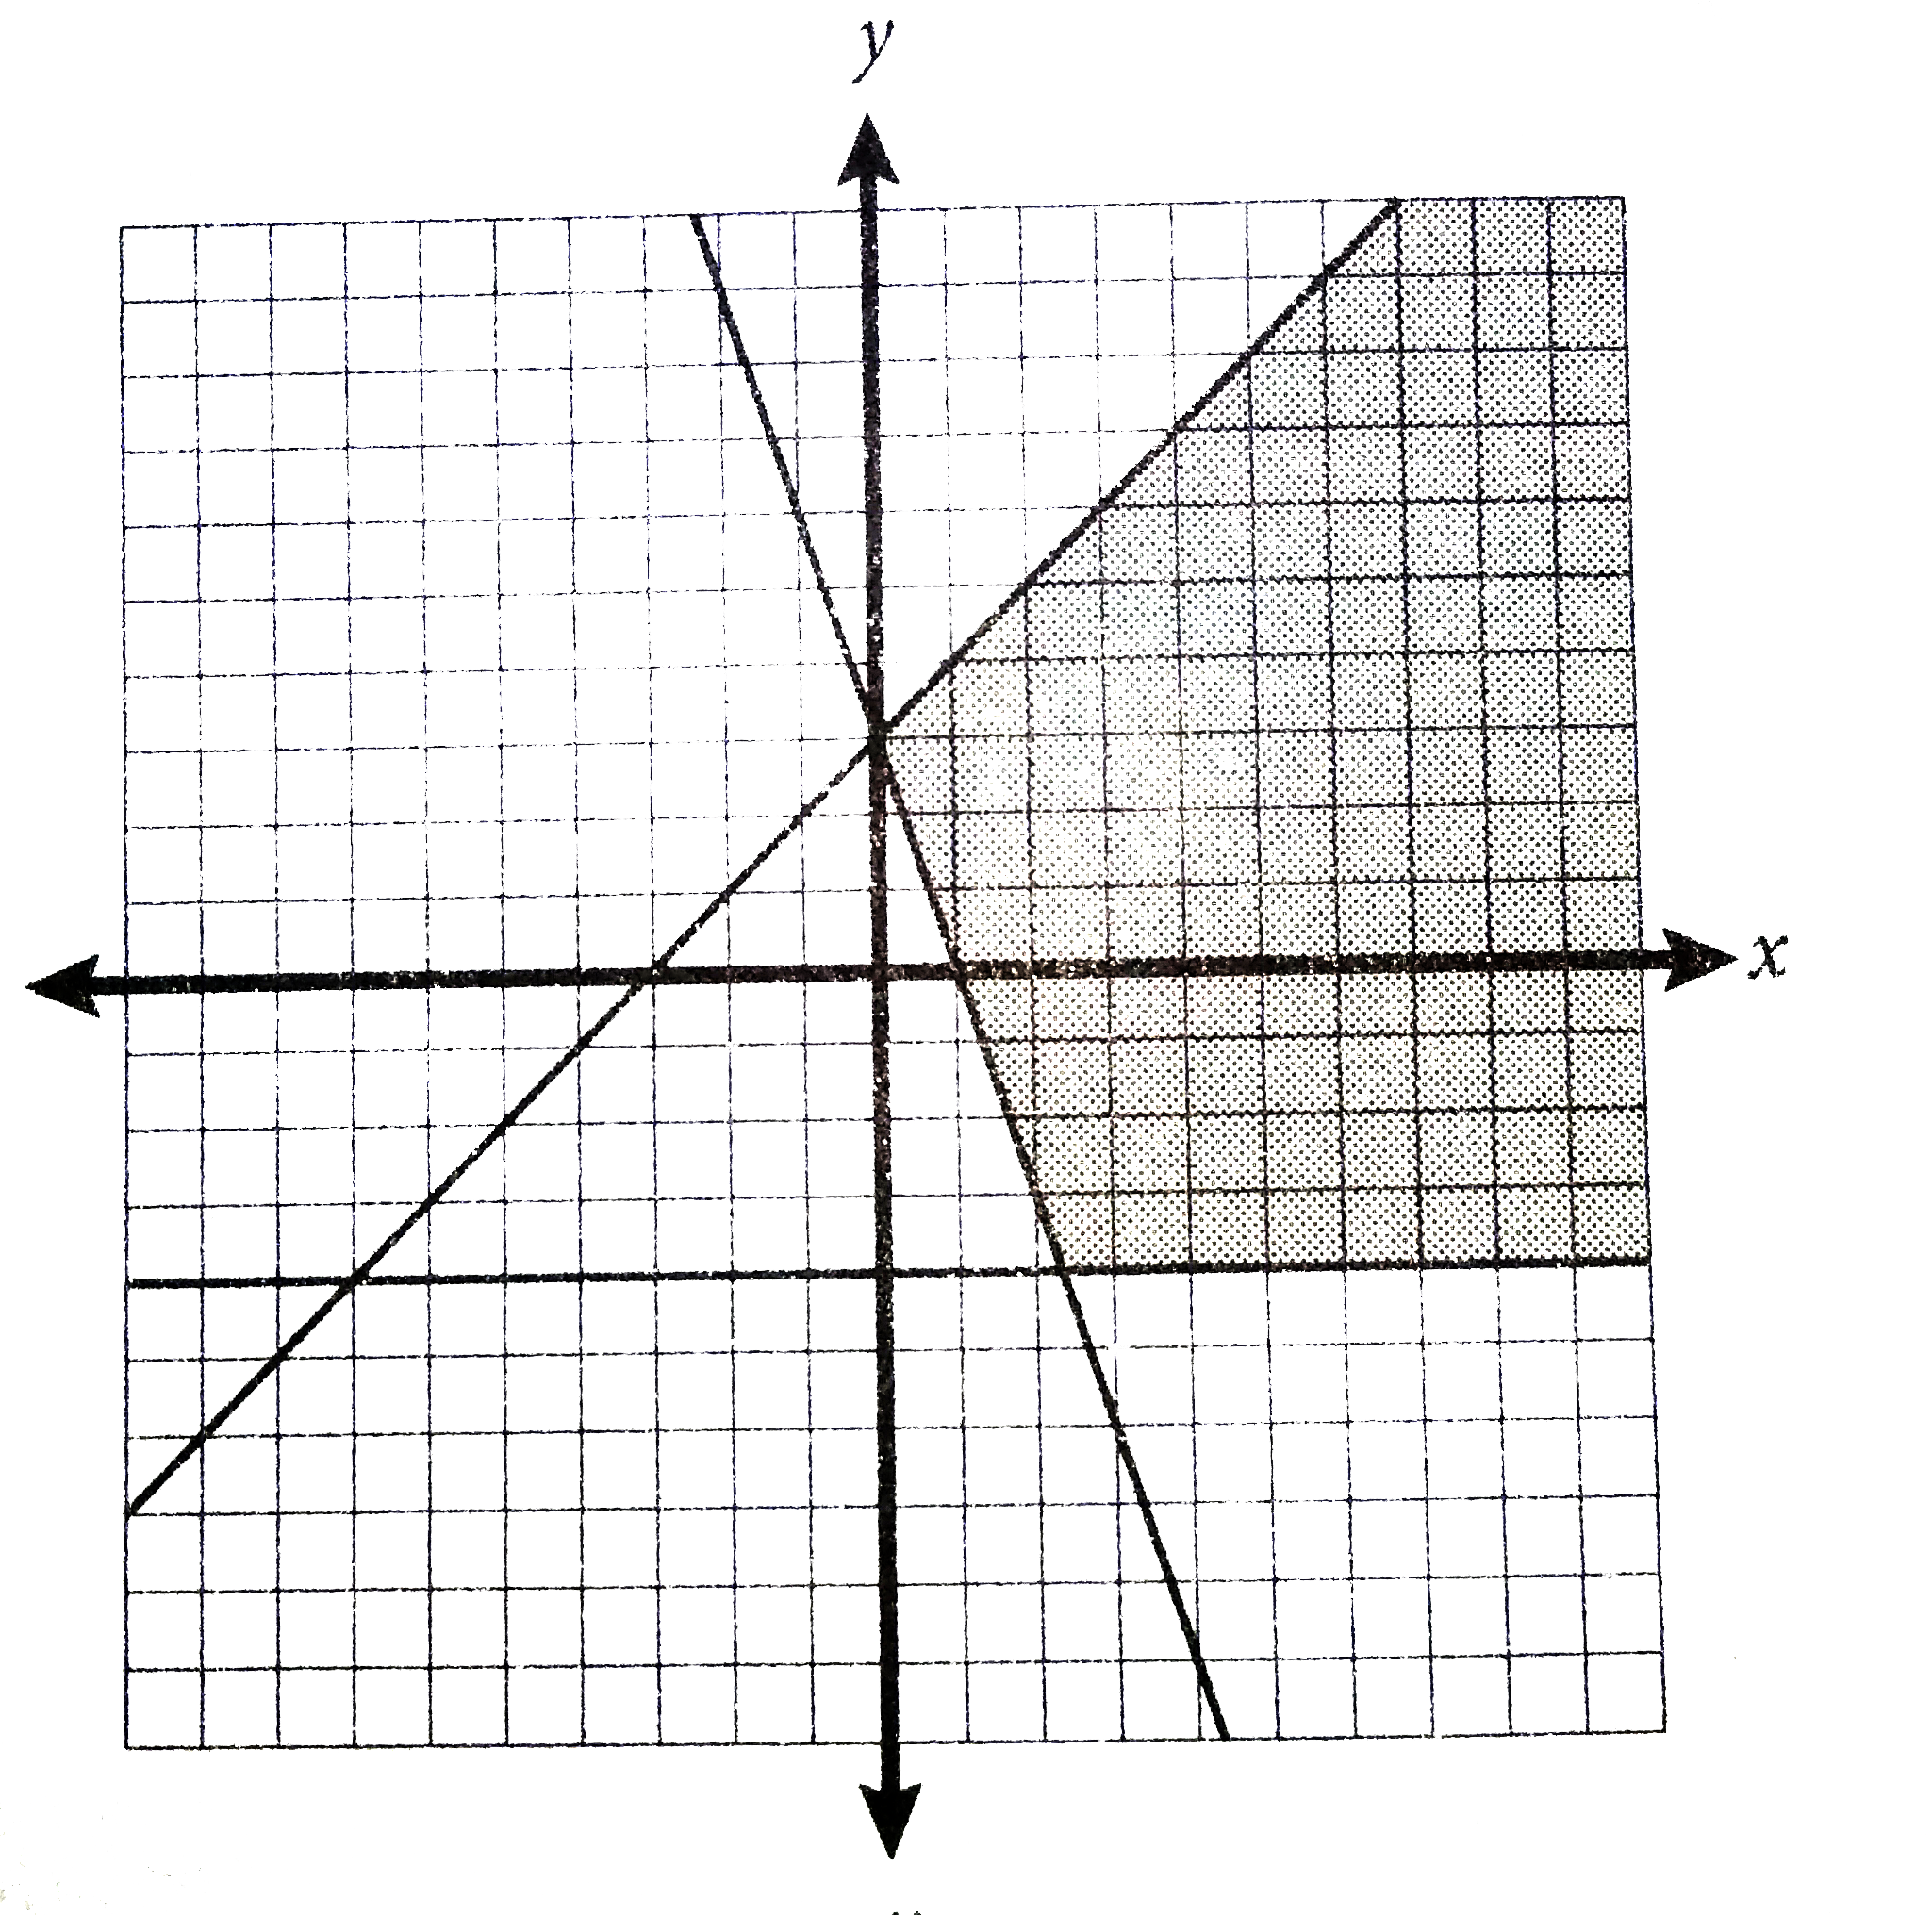 C
C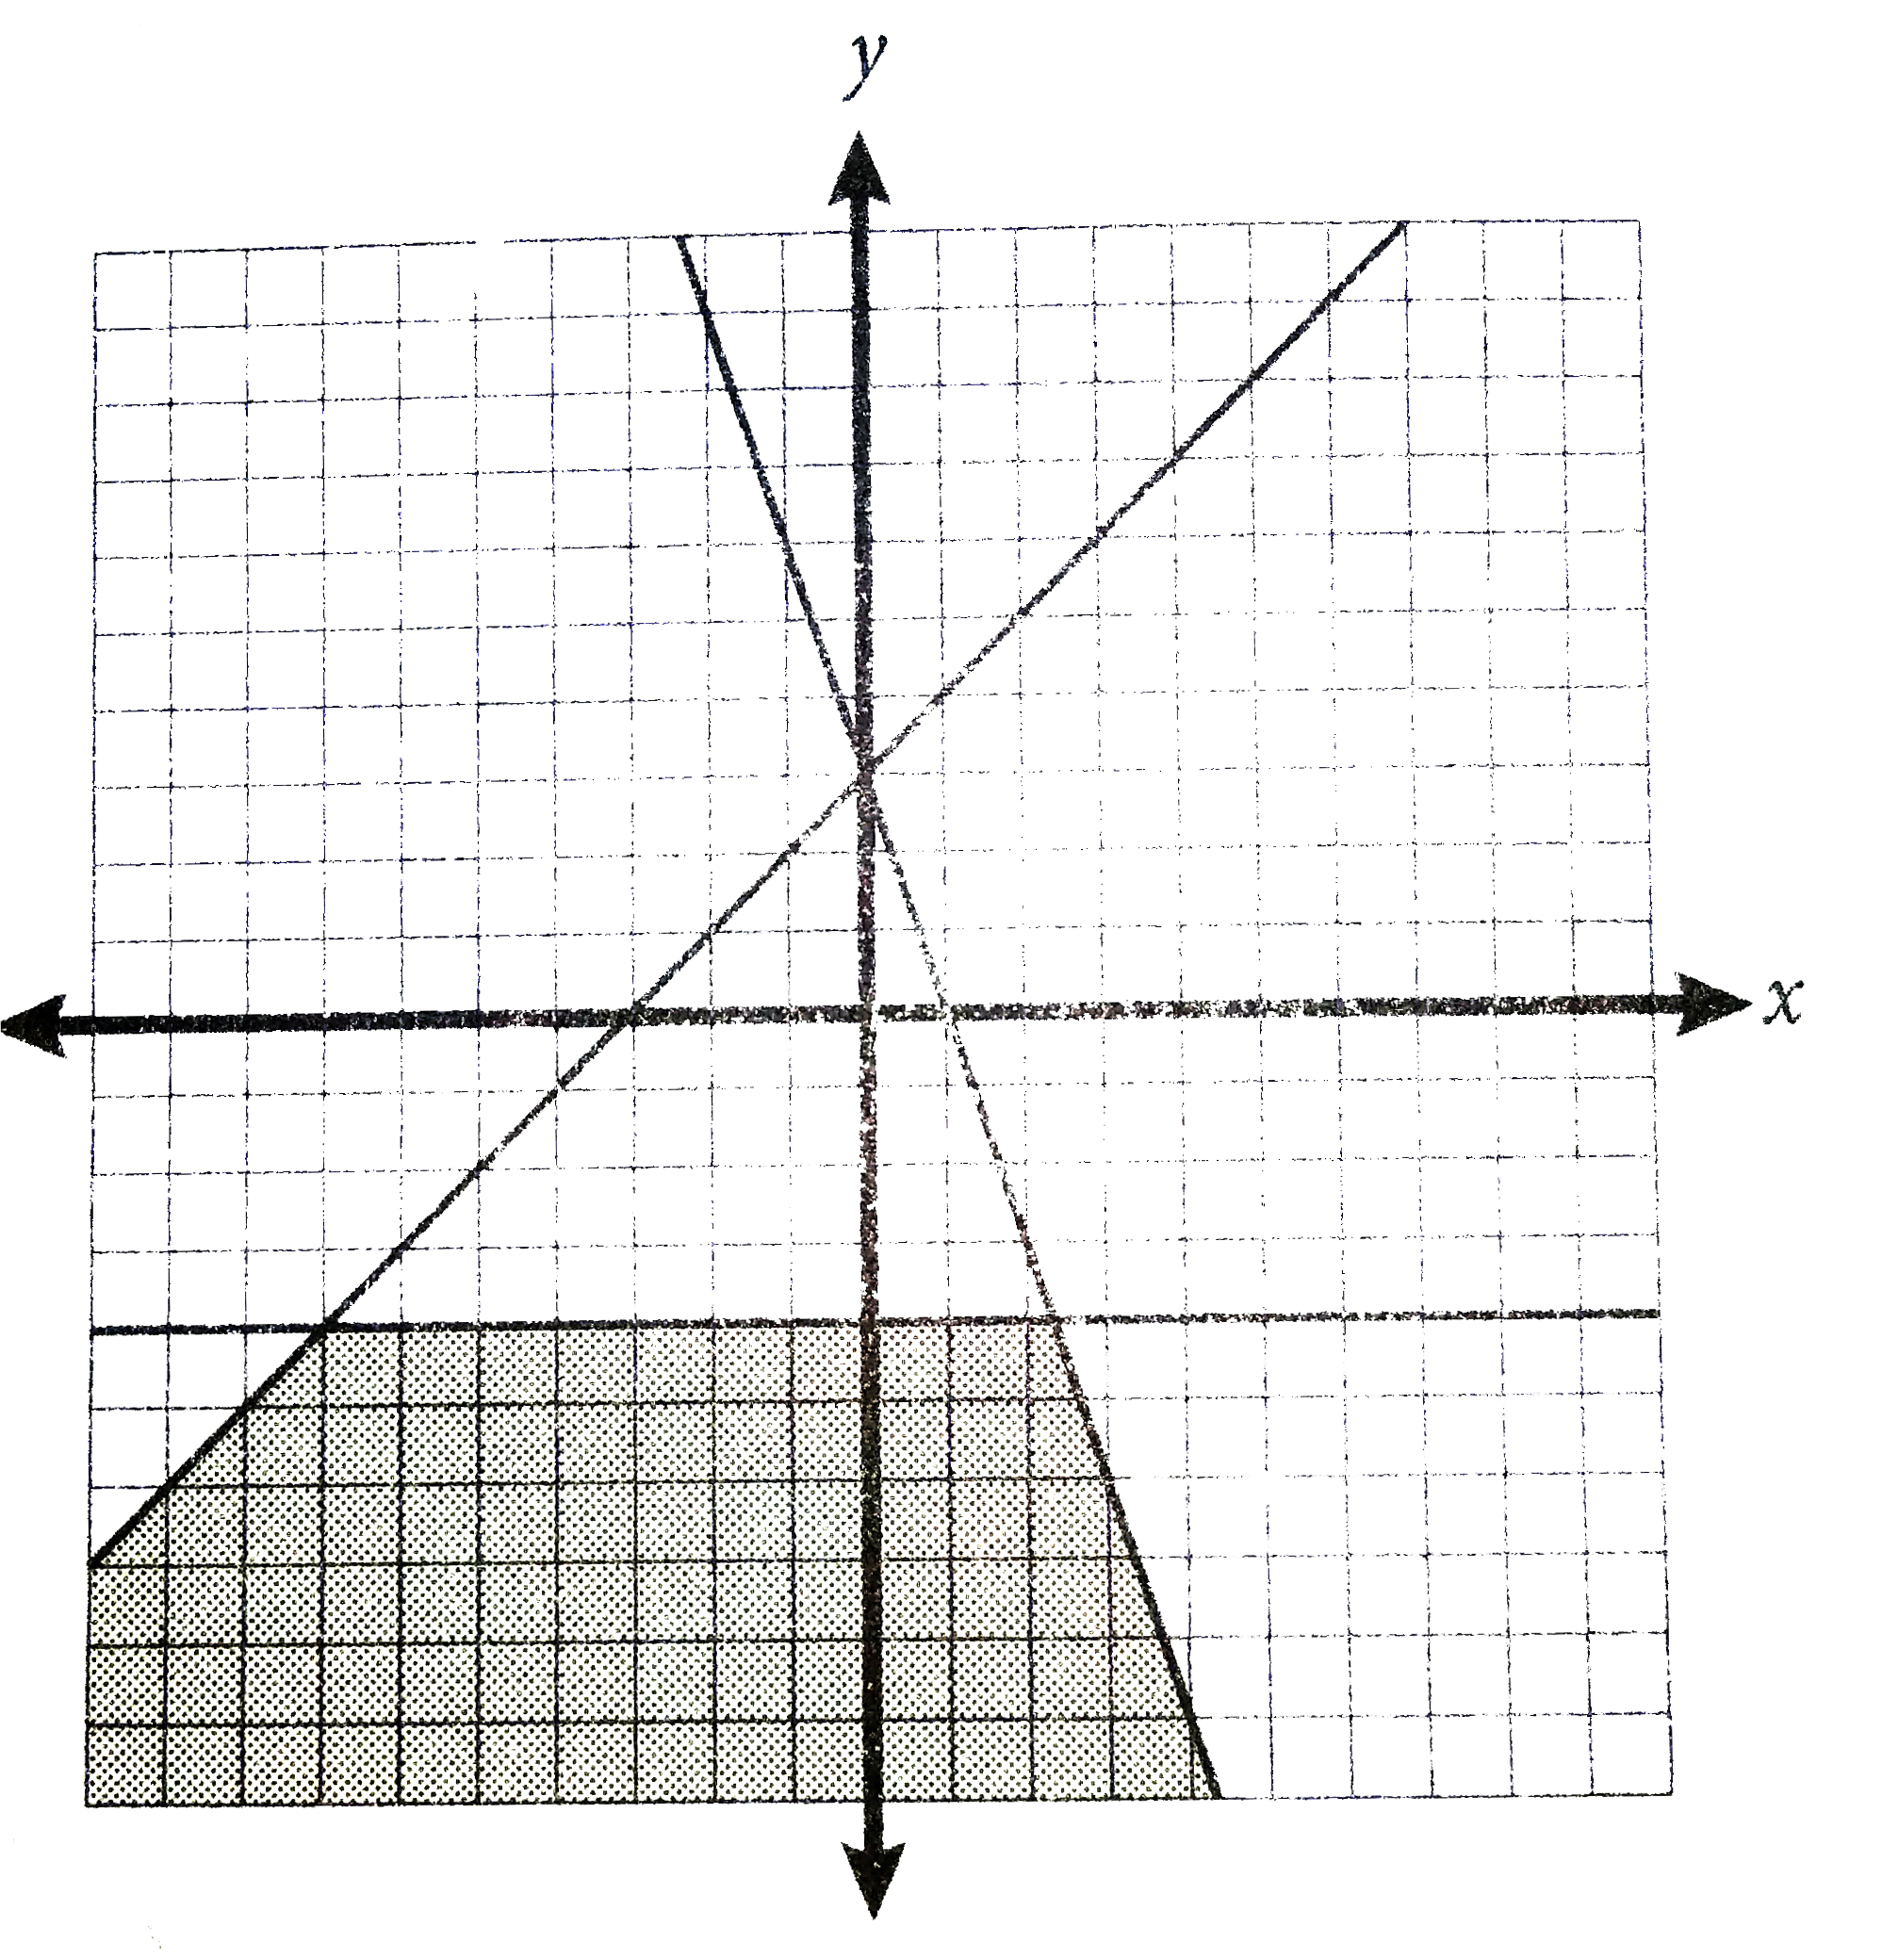 D
D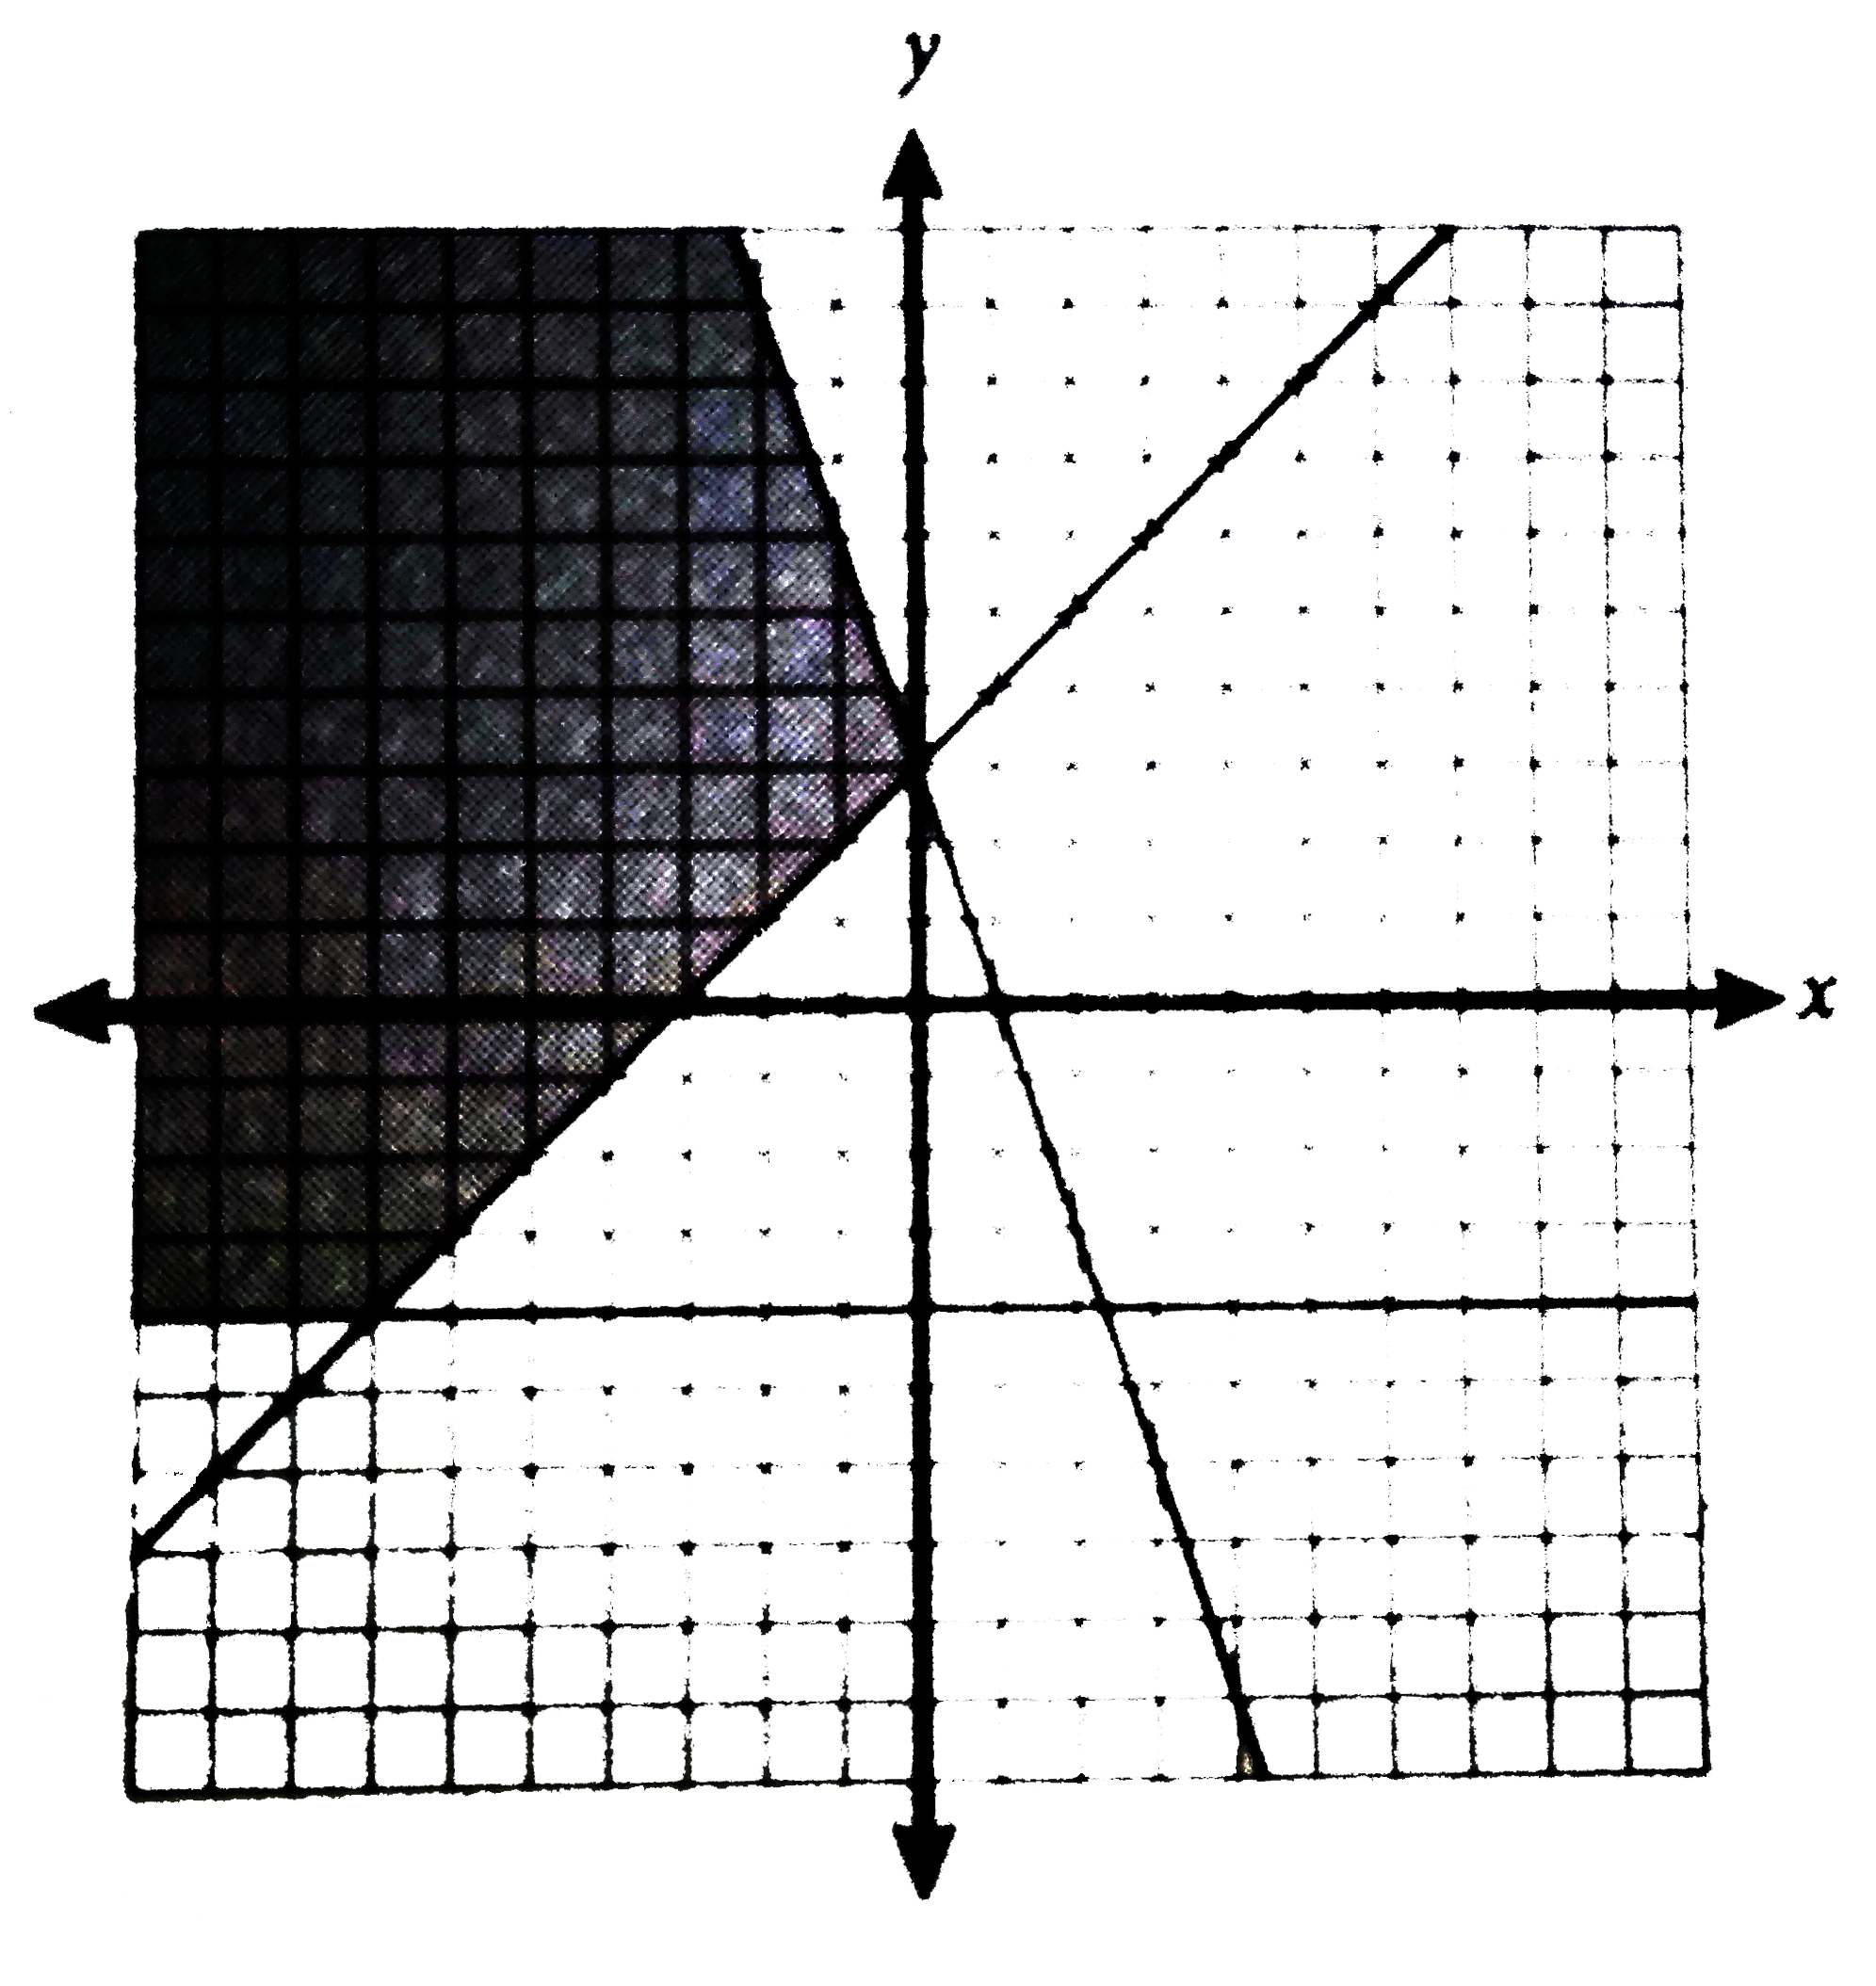
Solve the inequation: |x−2|≤5
View SolutionSolve the inequation: 1≤|x+1|≤2
View Solutiony≥x+2
2x+3y≤6
In which of the following does the shaded region represent the solution set in the xy-plane to the system of inequalities above?
View SolutionWhenever a>0 , which of the following number line graphs represents the solutions for x to the inequality |x−a|≤3 ?
View SolutionIf 0≤t≤1, which of the following graphs is the graph of y versus x where x and y are related by the parametric equations y=t2 and x=√t ?
View Solution