In the circuit diagram shown
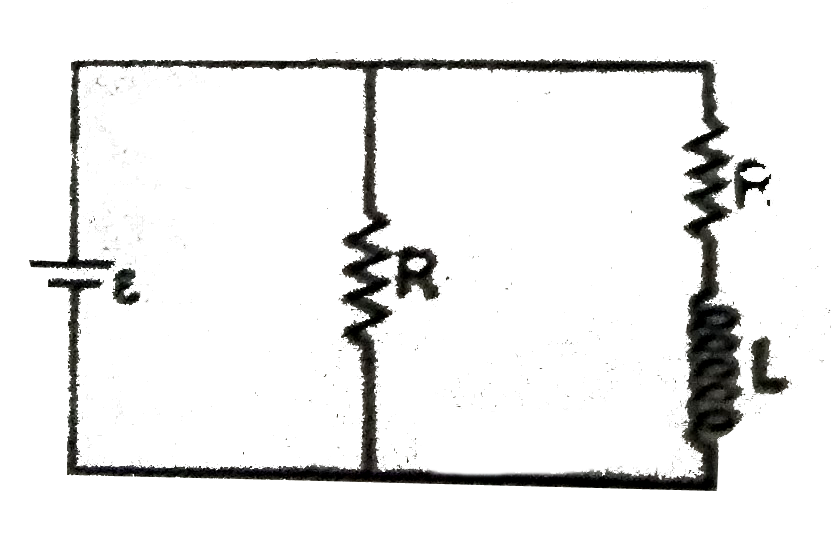
time constant is L/R
time constant is 2L/R
steady state current in inductor is 2ε/R
steady state current in inductor is ε/2R
The correct Answer is:A
Step by step video, text & image solution for In the circuit diagram shown by Physics experts to help you in doubts & scoring excellent marks in Class 11 exams.
Updated on:21/07/2023Topper's Solved these Questions
Similar Questions
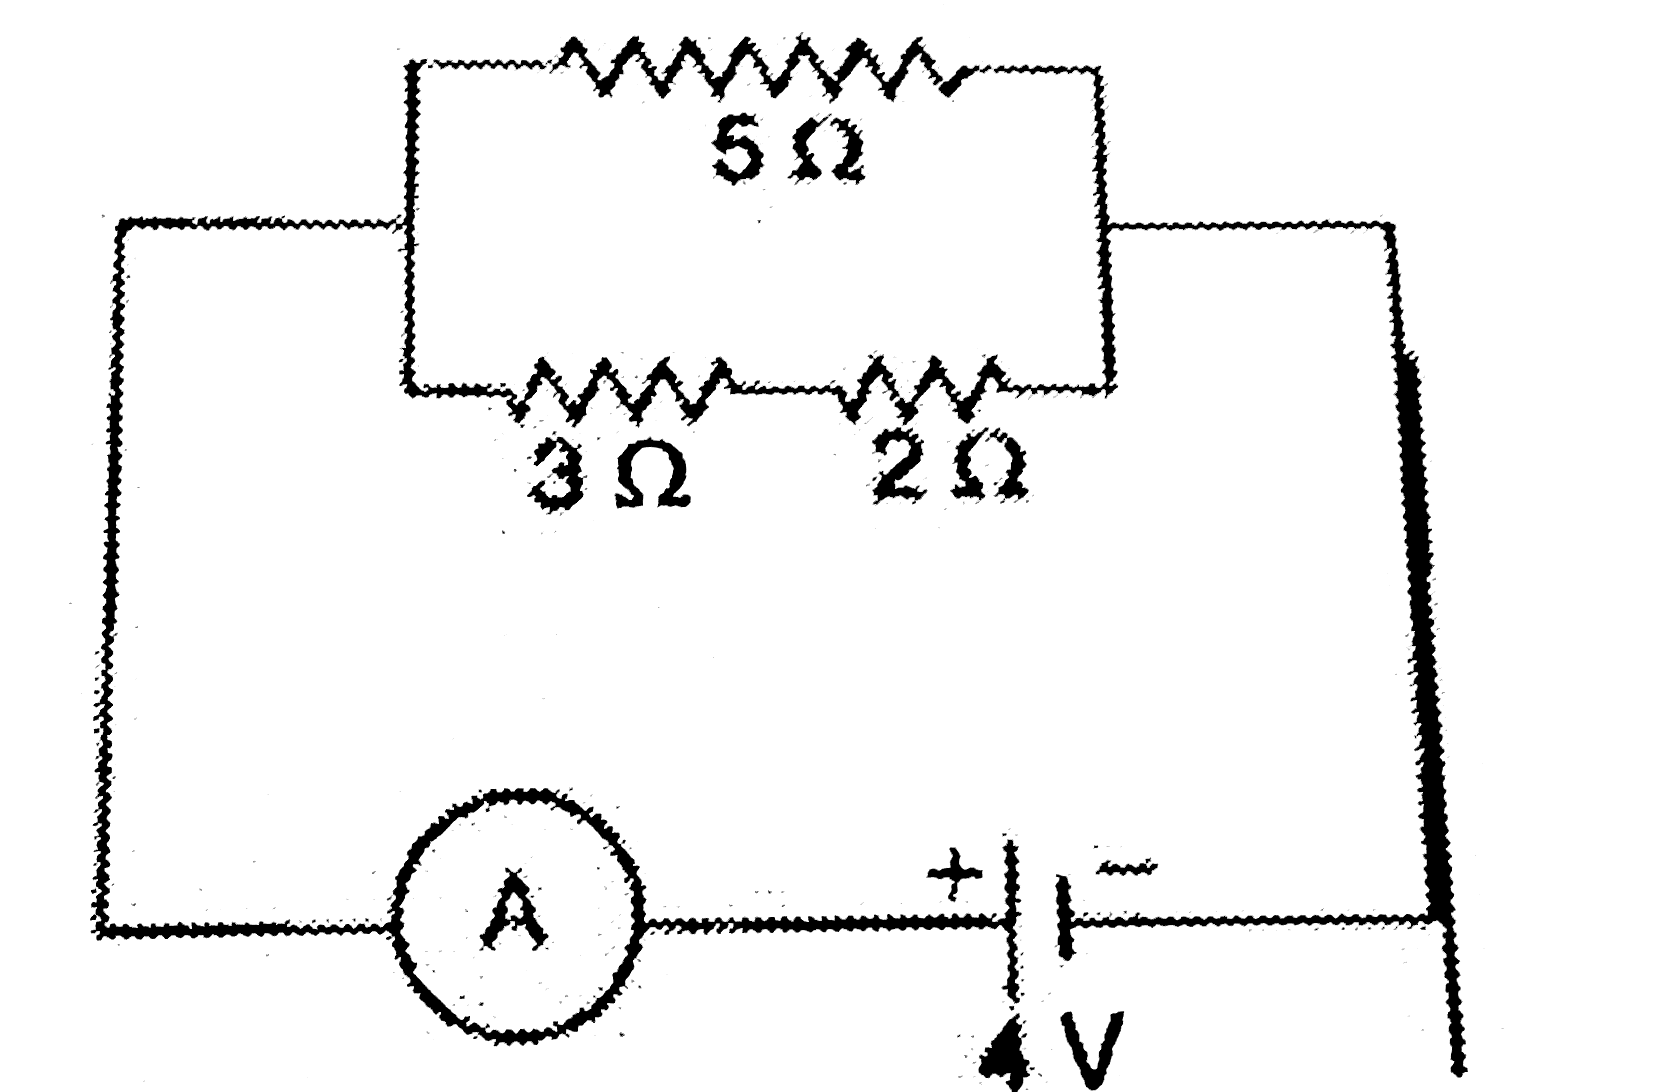
(a) With the help of a circuit diagram, obtain the relation for the equivalent resistance of two resistances connected in parallel.
(b) In the circuit diagram shown below, find:
(i) Total resistance.
(ii) Current shown by the ammeter A
View SolutionTwo students X and Y perform an experiment on potentiometer separately using the circuit diagram shown here. Keeping other things unchanged
(i) X increases the value of resistance R (ii) Y decreases the value of resistance S in the set up. How would these changes affect the position of the null point in each case and why ?
View Solution
Knowledge Check
Carefully study the circuit diagram shown and calculate the value of x.
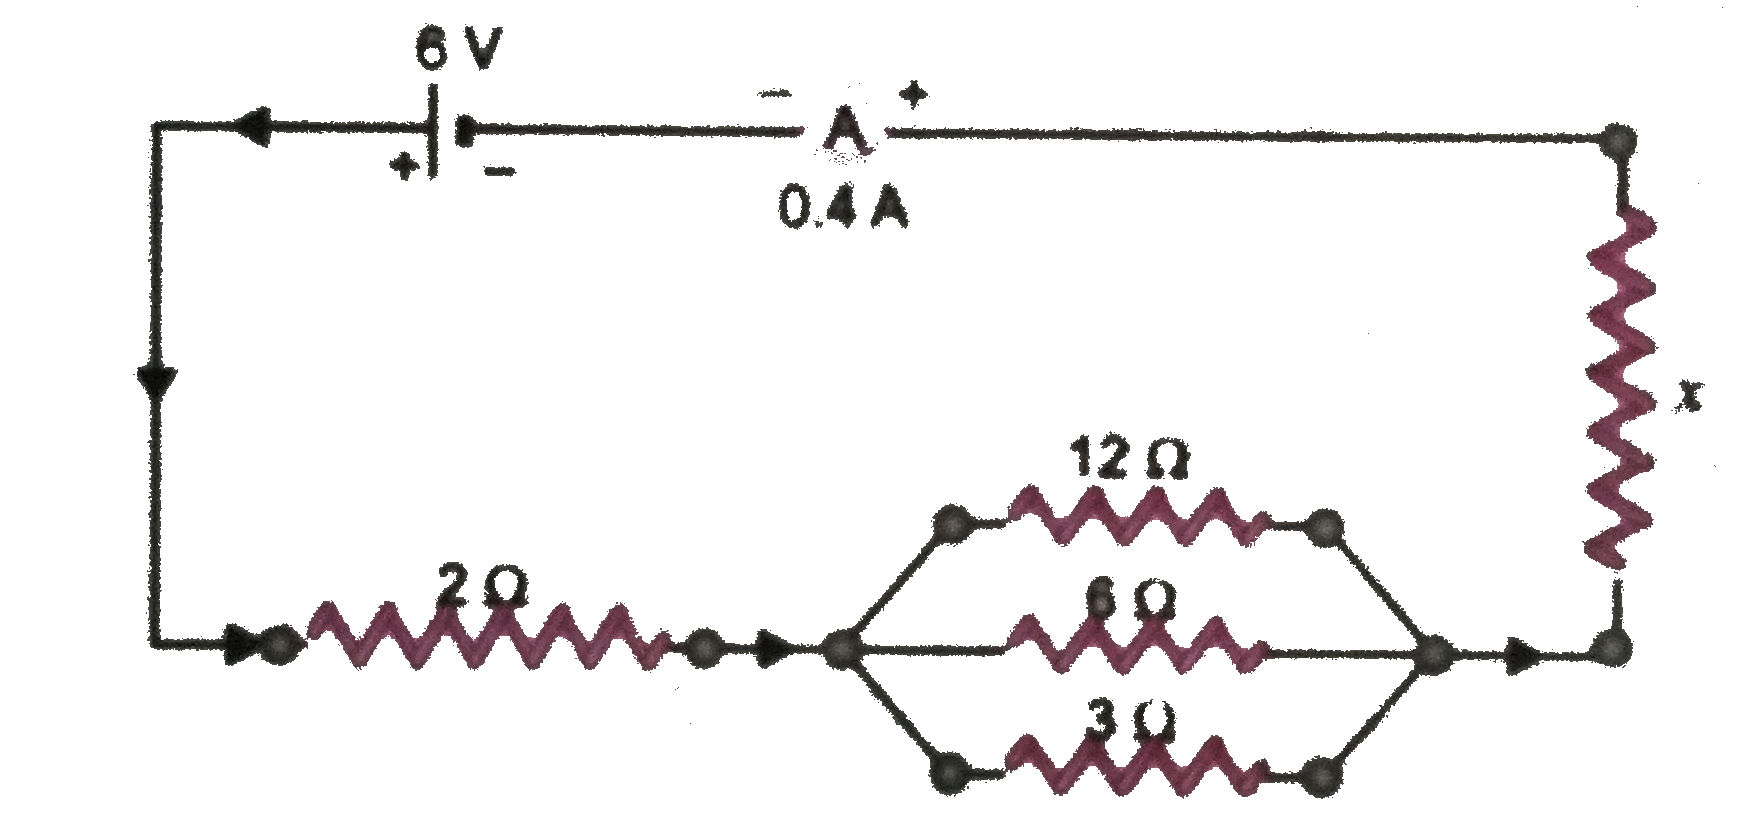 .A14.3 ohmB11.3 ohmC12 ohmD23.4 ohm
The current from the battery in circuit diagram shown is
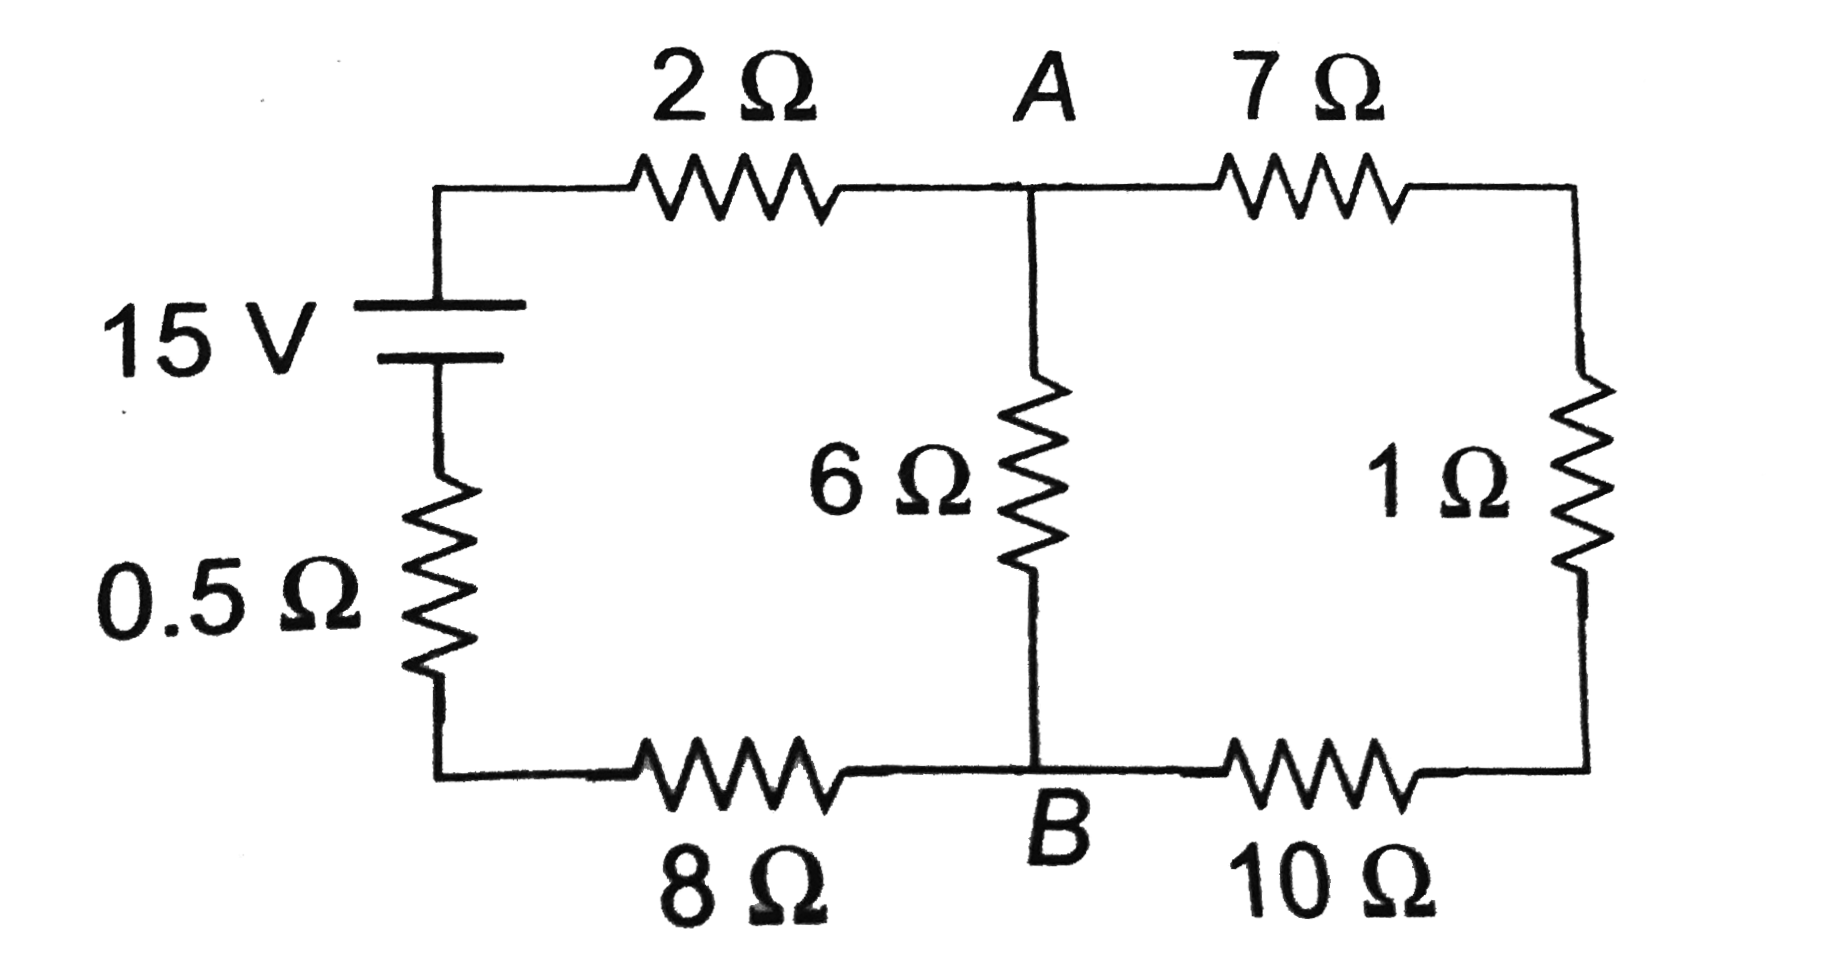 A1AB2AC1.5AD3A
A cell, a resistor, a key and an ammeter are arranged as shown in the circuit diagrams of (Fig. 3.37). The current recorded in the ammeter will be :
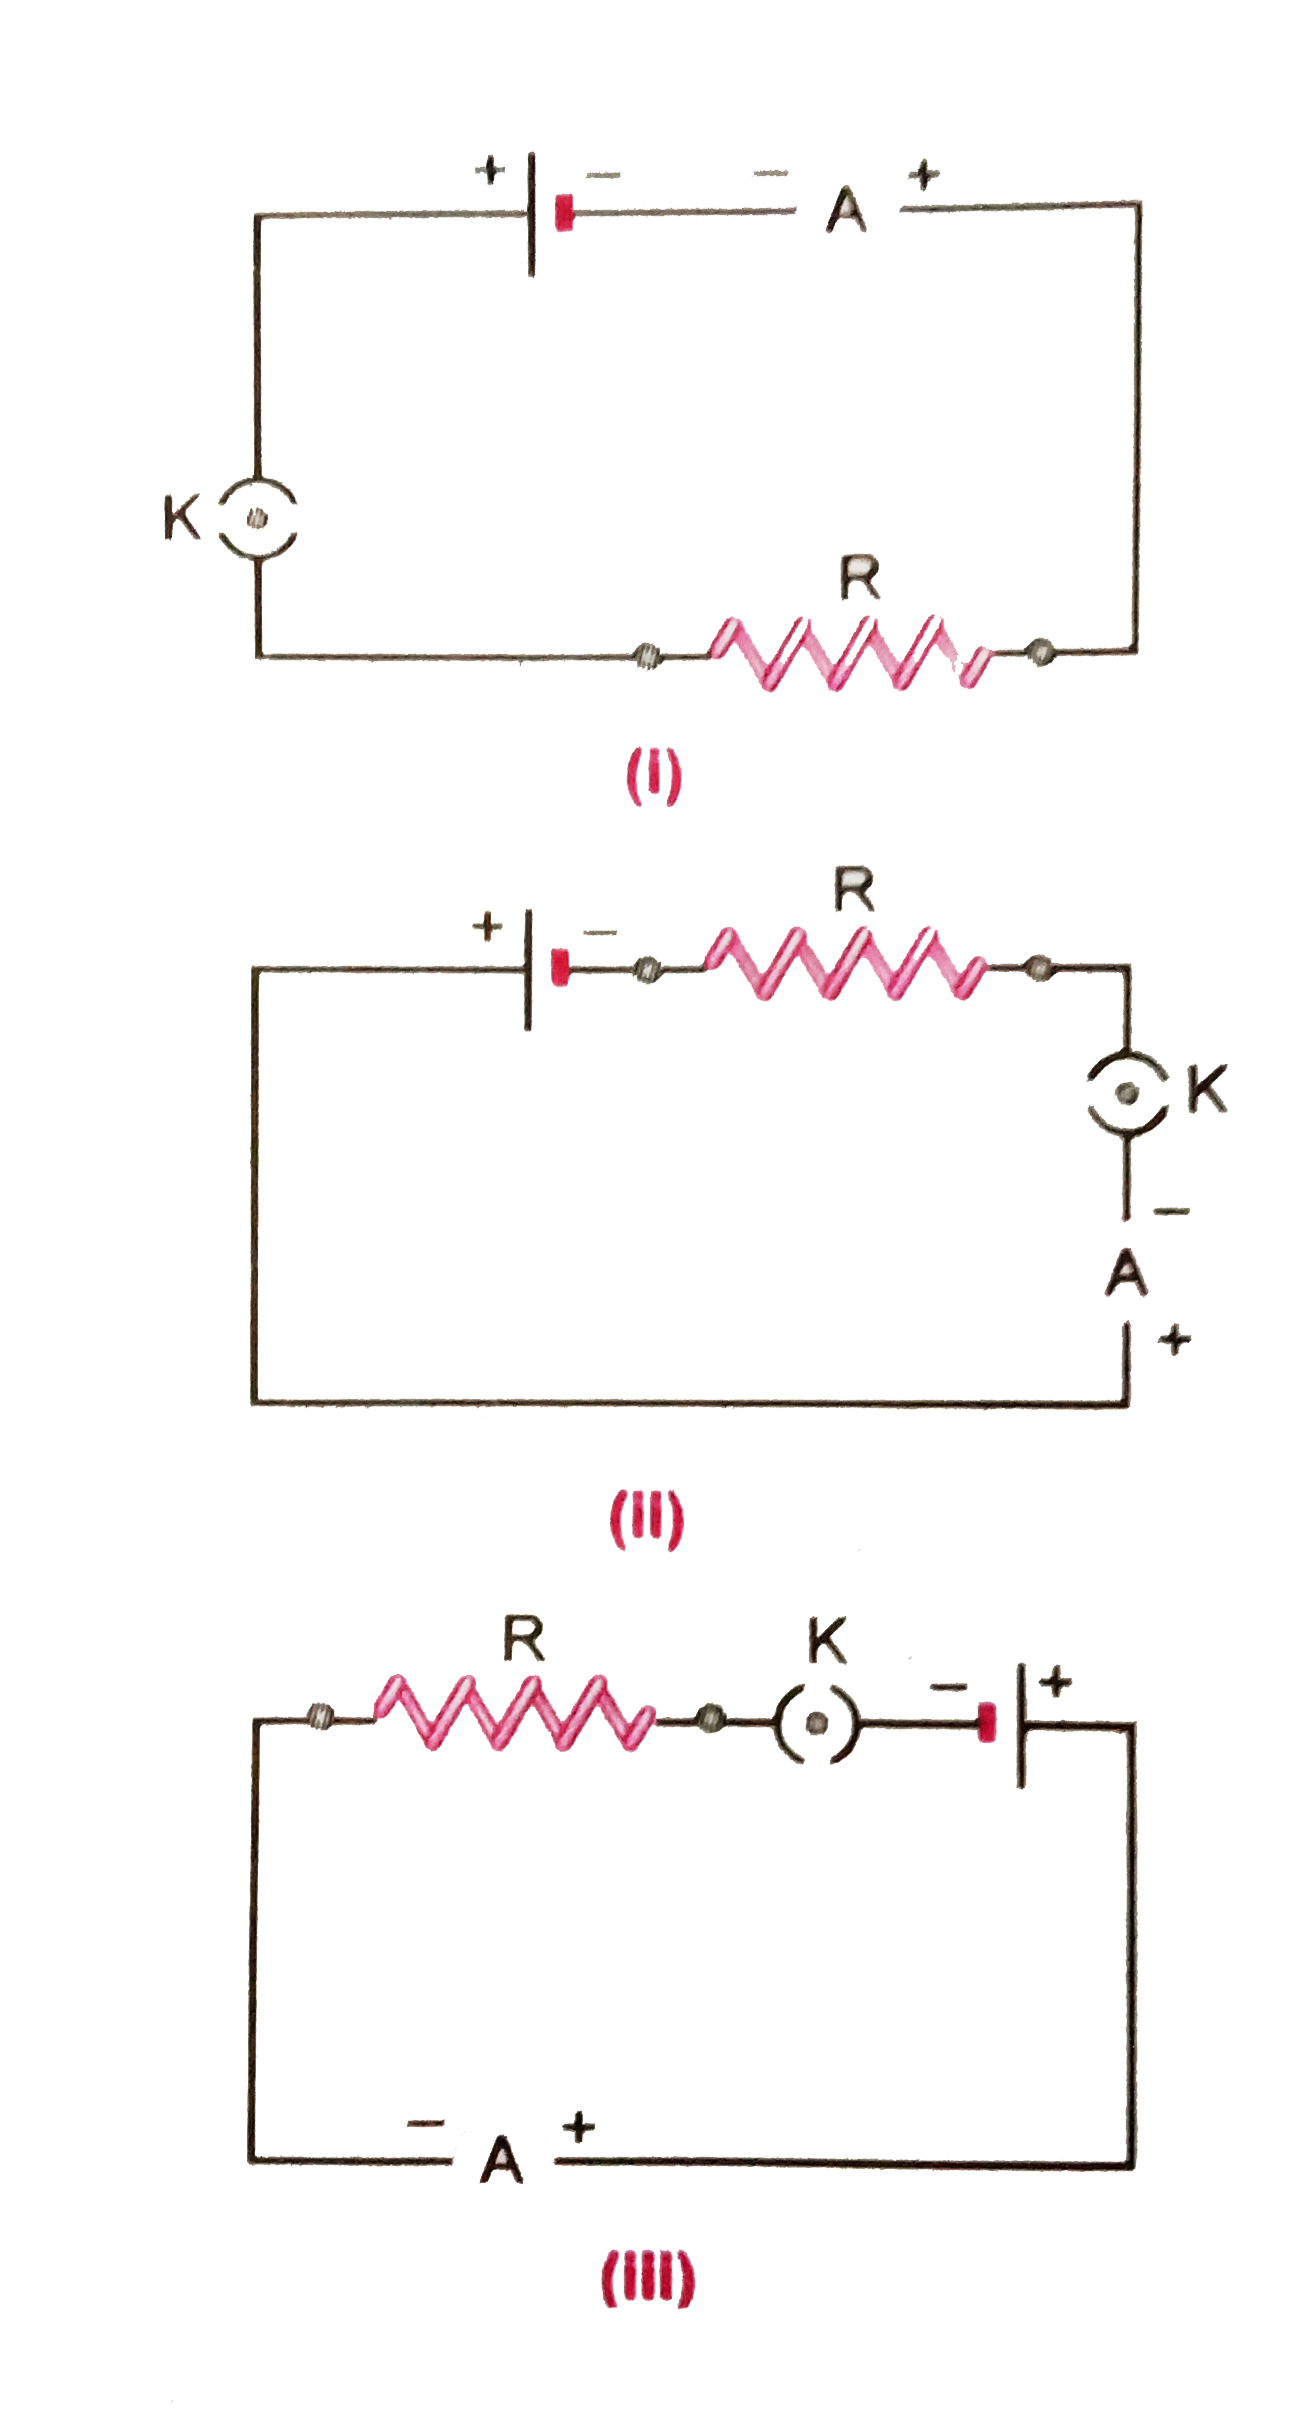 Amaximum in (i)Bmaximum in (ii)Cmaximum in (iii)Dthe same in all the cases
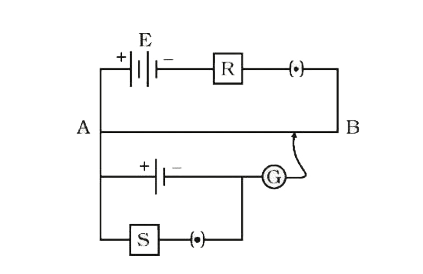
Two students X and Y perform an experiment on potentiometer separating using the circuit diagram shown here. Keeping other things unchanged
(i) X increases the value of resistance R.
(ii) Y decreases the value of resistance S in the set up. How would these changes affect the position of the null point in each case and why?
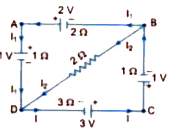
View SolutionUsing Kirchhoff's rules, calculate the potential difference between B and D in the circuit diagram as shown in Fig.
View SolutionConsider the potentiometer circuit diagram as shown in the figure. If the potentiometer wire BD has net resistance of 15Omega, the choose the correct statement
_PHY_E01_009_Q01.png)
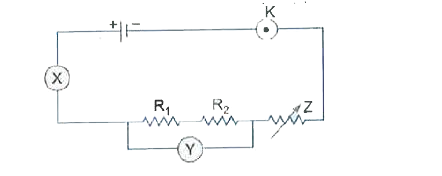
View SolutionThe given circuit diagram shows the experimental arrangement of different circuit components for determination of equivalent resistance of two resistors connected in series. Identify the components X, Y and Z shown in the circuit respectively.
View SolutionIn meter bridge experiment the observation table and circuit diagram are shown in figure
SNOR(Ω)l(cm)1100060cm210013cm3101.5cm411.0cm
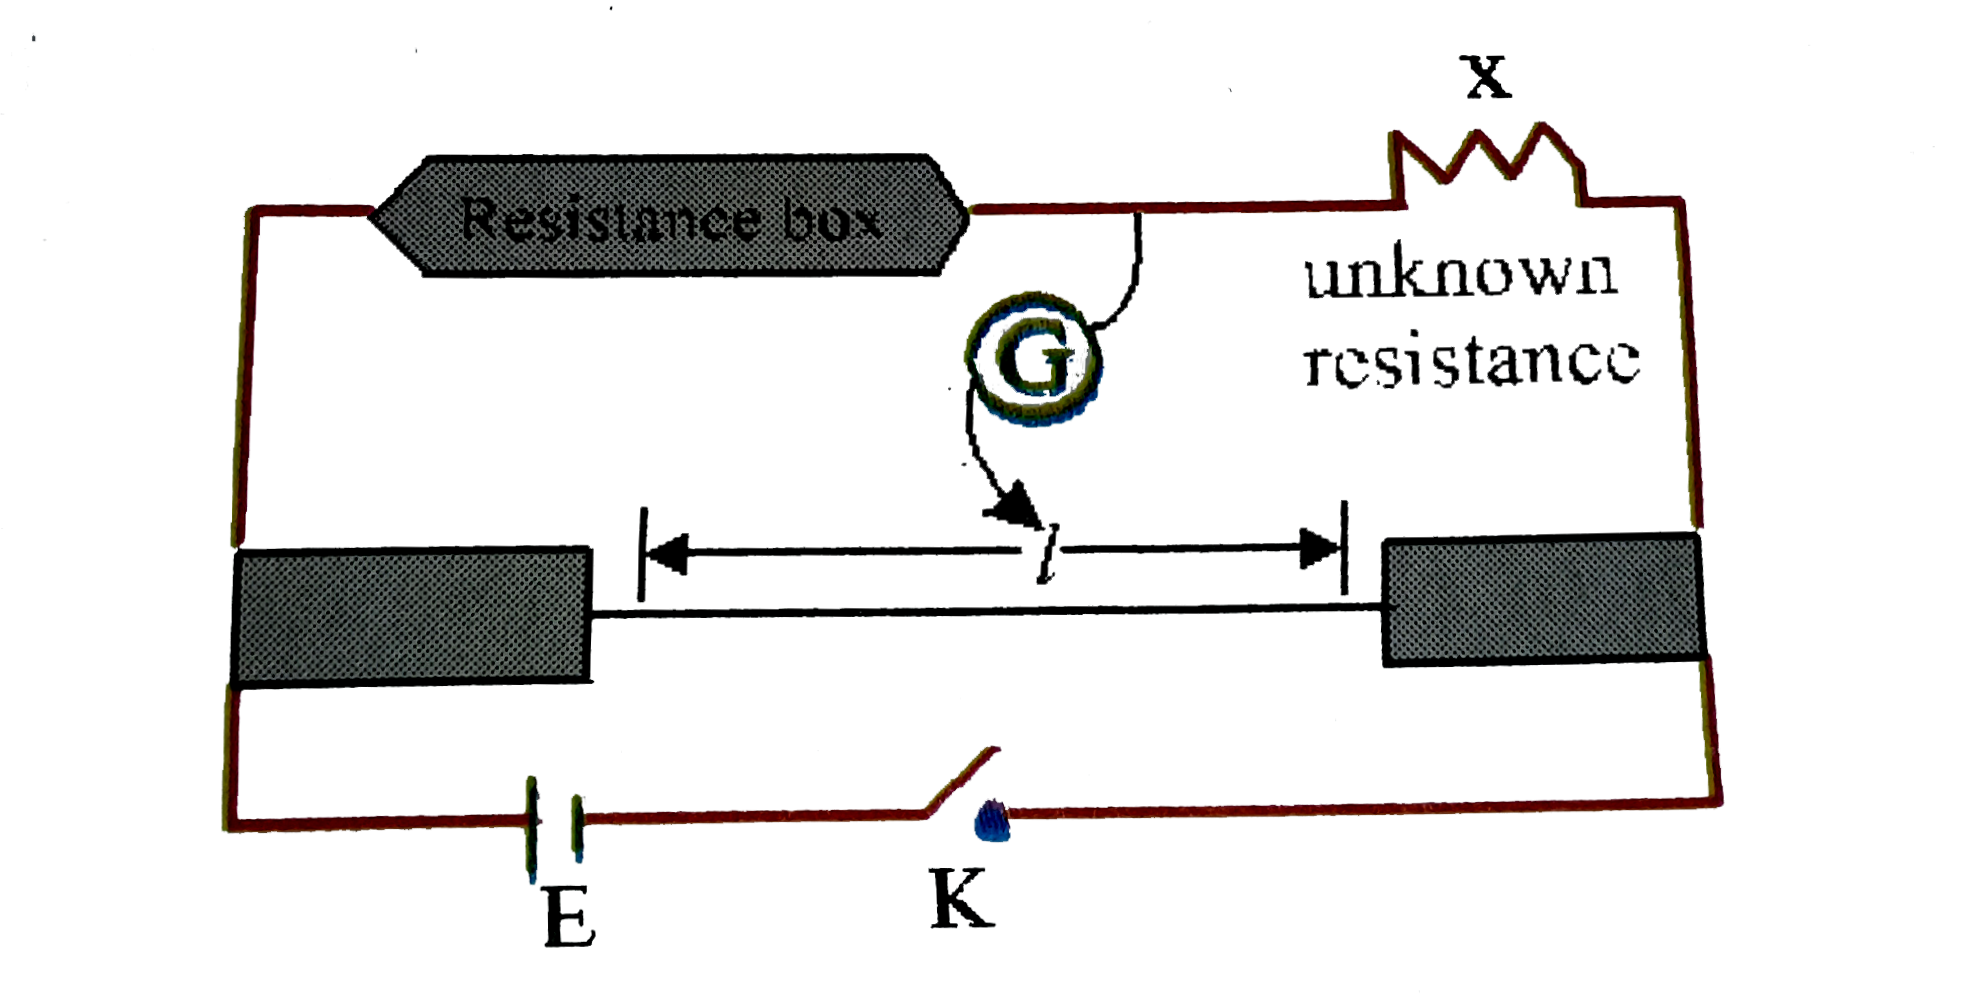
Which of the following readings is not taken correctly?
View Solution
