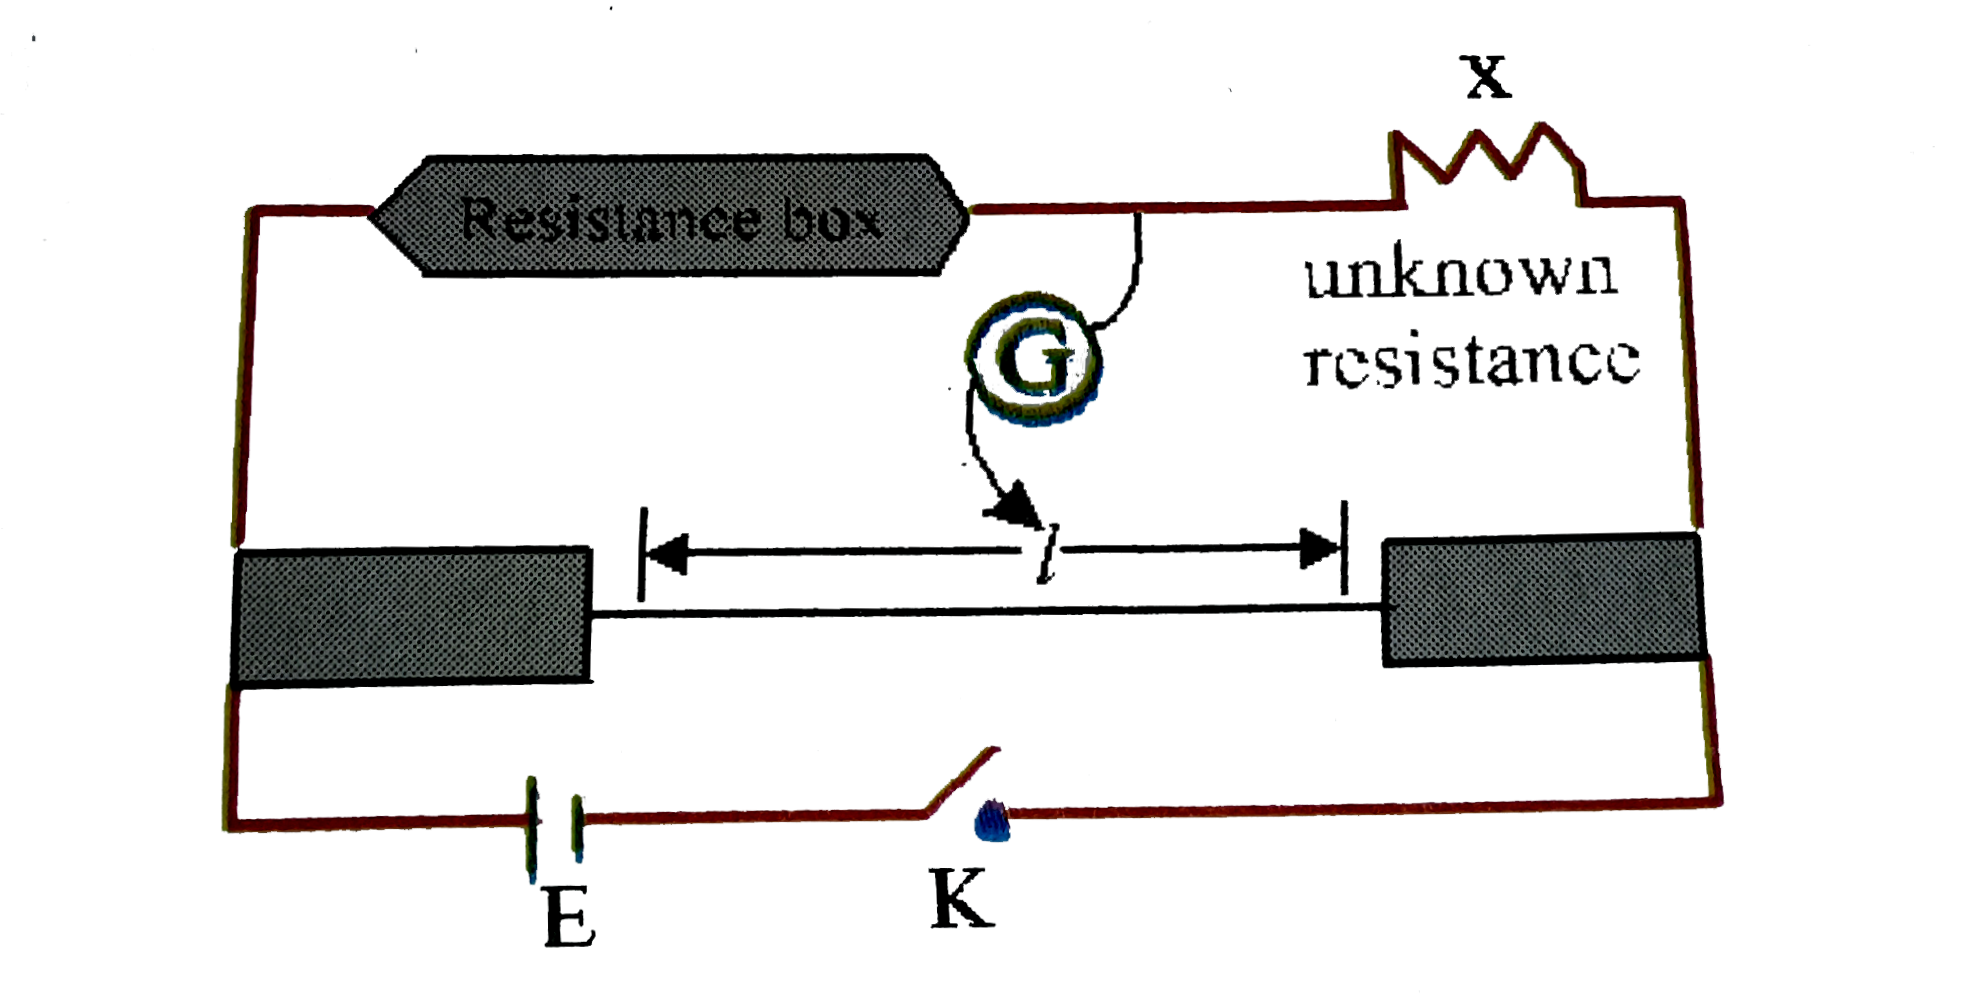
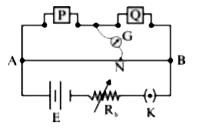
In meter bridge experiment the observation table and circuit diagram are shown in figure

Which of the following readings is not taken correctly?
The correct Answer is:D
Step by step video, text & image solution for In meter bridge experiment the observation table and circuit diagram are shown in figure {:(SNO,R(Omega),l(cm)),(1,1000,60cm),(2,100,13cm),(3,10,1.5cm),(4,1,1.0cm):} Which of the following readings is not taken correctly? by Physics experts to help you in doubts & scoring excellent marks in Class 12 exams.
Updated on:21/07/2023Topper's Solved these Questions
- EXPERIMENTAL PHYSICSBOOK - NARAYNACHAPTER - EXPERIMENTAL PHYSICSEXERCISE - Level-v(Single answer)
23 Videos
- EXPERIMENTAL PHYSICSBOOK - NARAYNACHAPTER - EXPERIMENTAL PHYSICSEXERCISE - Multiple answer
6 Videos
- ELECTROSTATICS AND GAUSS LAWBOOK - NARAYNACHAPTER - ELECTROSTATICS AND GAUSS LAWEXERCISE - Intergers type question
11 Videos
- MAGNETISMBOOK - NARAYNACHAPTER - MAGNETISMEXERCISE - LEVEL-II (H.W)
24 Videos
Similar Questions
Correct the following.
1m = 1000 cm
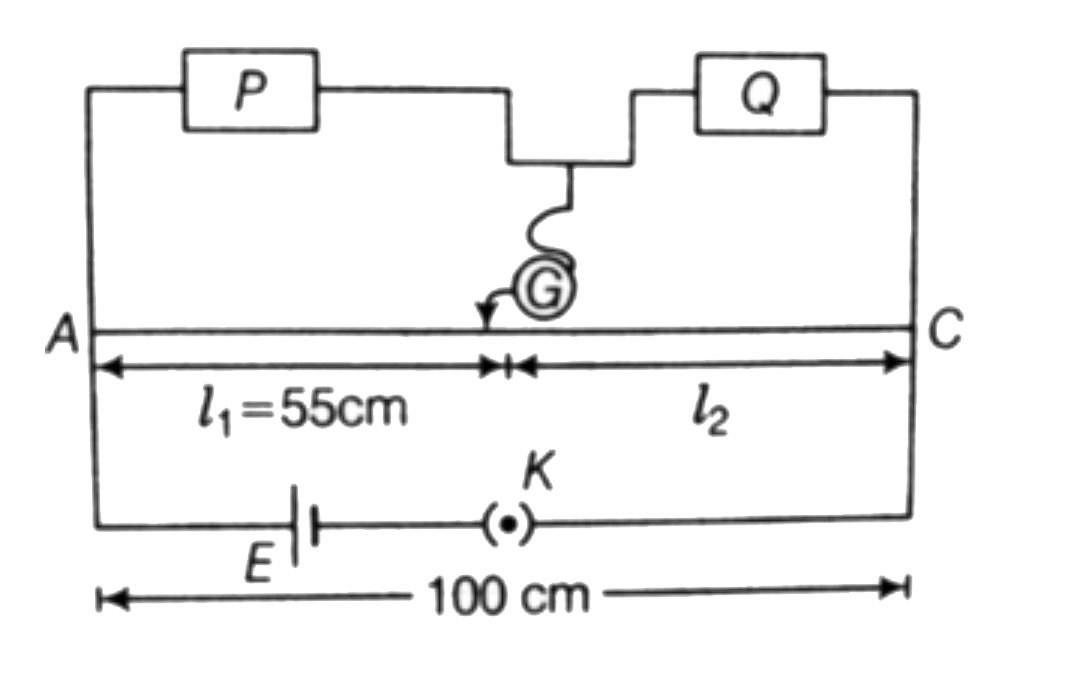
View SolutionIn a meter bridge experiment, resistances are connected as shown in figure. The balancing length l1=55cm. Now, an unknown resistance x is connected in series with P and the new balancing length is found to be 75 cm. What is the value of The value of 11x (in ohm)? (Given, P=4Ω)

View Solution
Knowledge Check
In a meter bridge experiment, resistances are connected as shown in figure. The balancing length l1=55cm. Now, an unknown resistance x is connected in series with P and the new balancing length is found to be 75 cm. What is the value of The value of 11x (in ohm)? (Given, P=4Ω)
 A5413ΩB2011ΩC4811ΩD1148Ω
If r1=5cm,r2=3cm,h=9cm, then the volume of frustum of the cone is
A69πcm3B102πcm3C147πcm3D441πcm3In a meter bridge experiment resistances are connected as shown in the figure. Initially resistance P=4Ω and the neutral point N is at 60 cm from A. Now an unknown resistance R is connected in series to P and the new position of the neutral point is at 80 cm from A. The value of unknown resistance R is:
 A335ΩB6ΩC7ΩD203Ω
10 cubic metres clay is uniformly spread on a land of area 10 ares. The rise in the level of the ground is (a) 1 cm (b) 10 cm (c) 100 cm (d) 1000 cm
View SolutionIn r1=As−a, if A=12cm2,r1=4cmanda=3cm then find s making s as the subject.
View SolutionWhich of the following is the area of the rectangle whose length is 4.2 cm and breadth is 1.3 cm ?
View SolutionIn r1=As−a, if A=12cm2,r1=4cmanda=3cm then find s making s as the subject.
View SolutionIn above question if resistance of meter bridge wire is 1 Ω /cm then the value of current / is
View Solution
