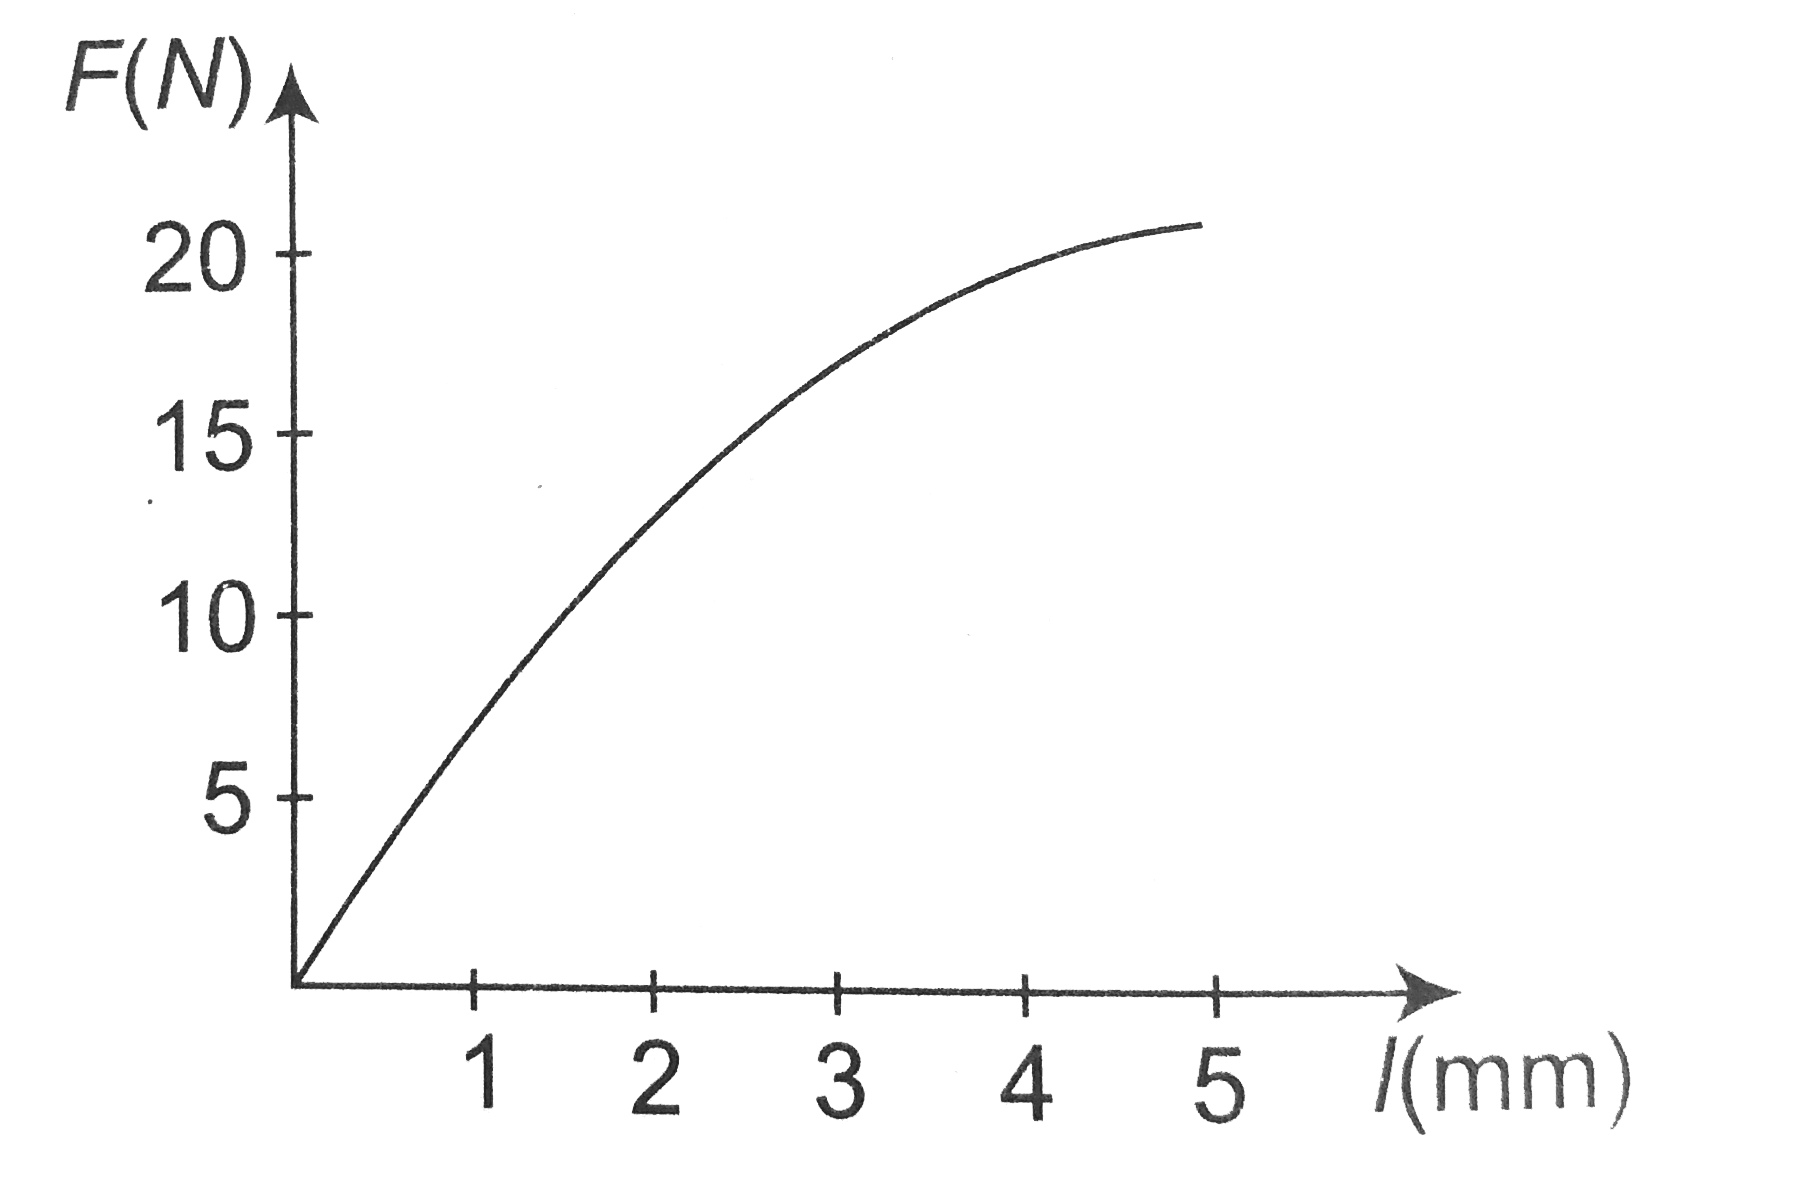
The force (F)- extension (λ) graph shows that the strain energy stored in the material under test, for an extension of 4mm, is greater than which of the following values?
80 mJ
60 mJ
40 mJ
none of these
The correct Answer is:C
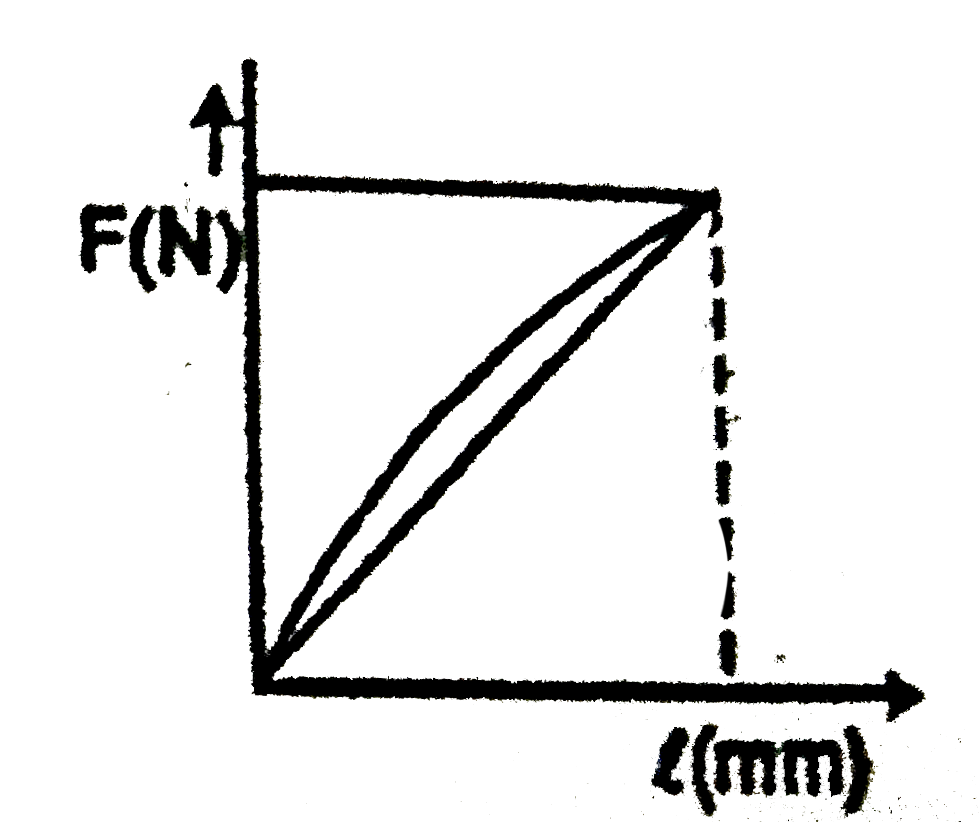
Area under the curve respresents strain
energy stored and it is greater than 40 mj Area under vurve (Straight line)
=12.F.1
=12.(20)(4×10⁻³)J
=40 mJ
Topper's Solved these Questions
- FLUID MECHANICSBook:RESONANCEChapter:FLUID MECHANICSExercise:Examples
Explore 22 Videos
- FLUID MECHANICSBook:RESONANCEChapter:FLUID MECHANICSExercise:Board Level Exercise
Explore 18 Videos
- ELECTROSTATICSBook:RESONANCEChapter:ELECTROSTATICSExercise:Exercise
Explore 52 Videos
- FULL TEST 1Book:RESONANCEChapter:FULL TEST 1Exercise:Exercise
Explore 30 Videos
Similar Questions
A free electron and a free proton are placed between two oppositely charged parallel plates. Both are closer to the positive plate than the negative plate
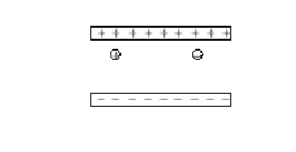
Which of the following statements is true?
I. The force on the proton is greater than the force on the electron.
II. The potential energy of the proton is greater than that of the electron.
III. The potential energy of the proton and the electron is the same.
View Solution(a) A wire 4 m long and 0.3mm in diameter is stretched by a force of 100 N. If extension in the wire is 0.3 mm, calculate the potential energy stored in the wire.
(b) Find the work done is stretching a wire of cross-section 1mm2 and length 2 m through 0.1 mm. Young's modulus for the material of wire is 2.0×10¹¹Nm−2.
View Solution
Knowledge Check
Copper of fixed volume V is drawn into wire of length l. When this wire is subjected to a constant force F, the extension produced in the wire is △l. Which of the following graphs is a straight line?
A△l versus1lB△l versus l2C△l versus 1l2D△l versus l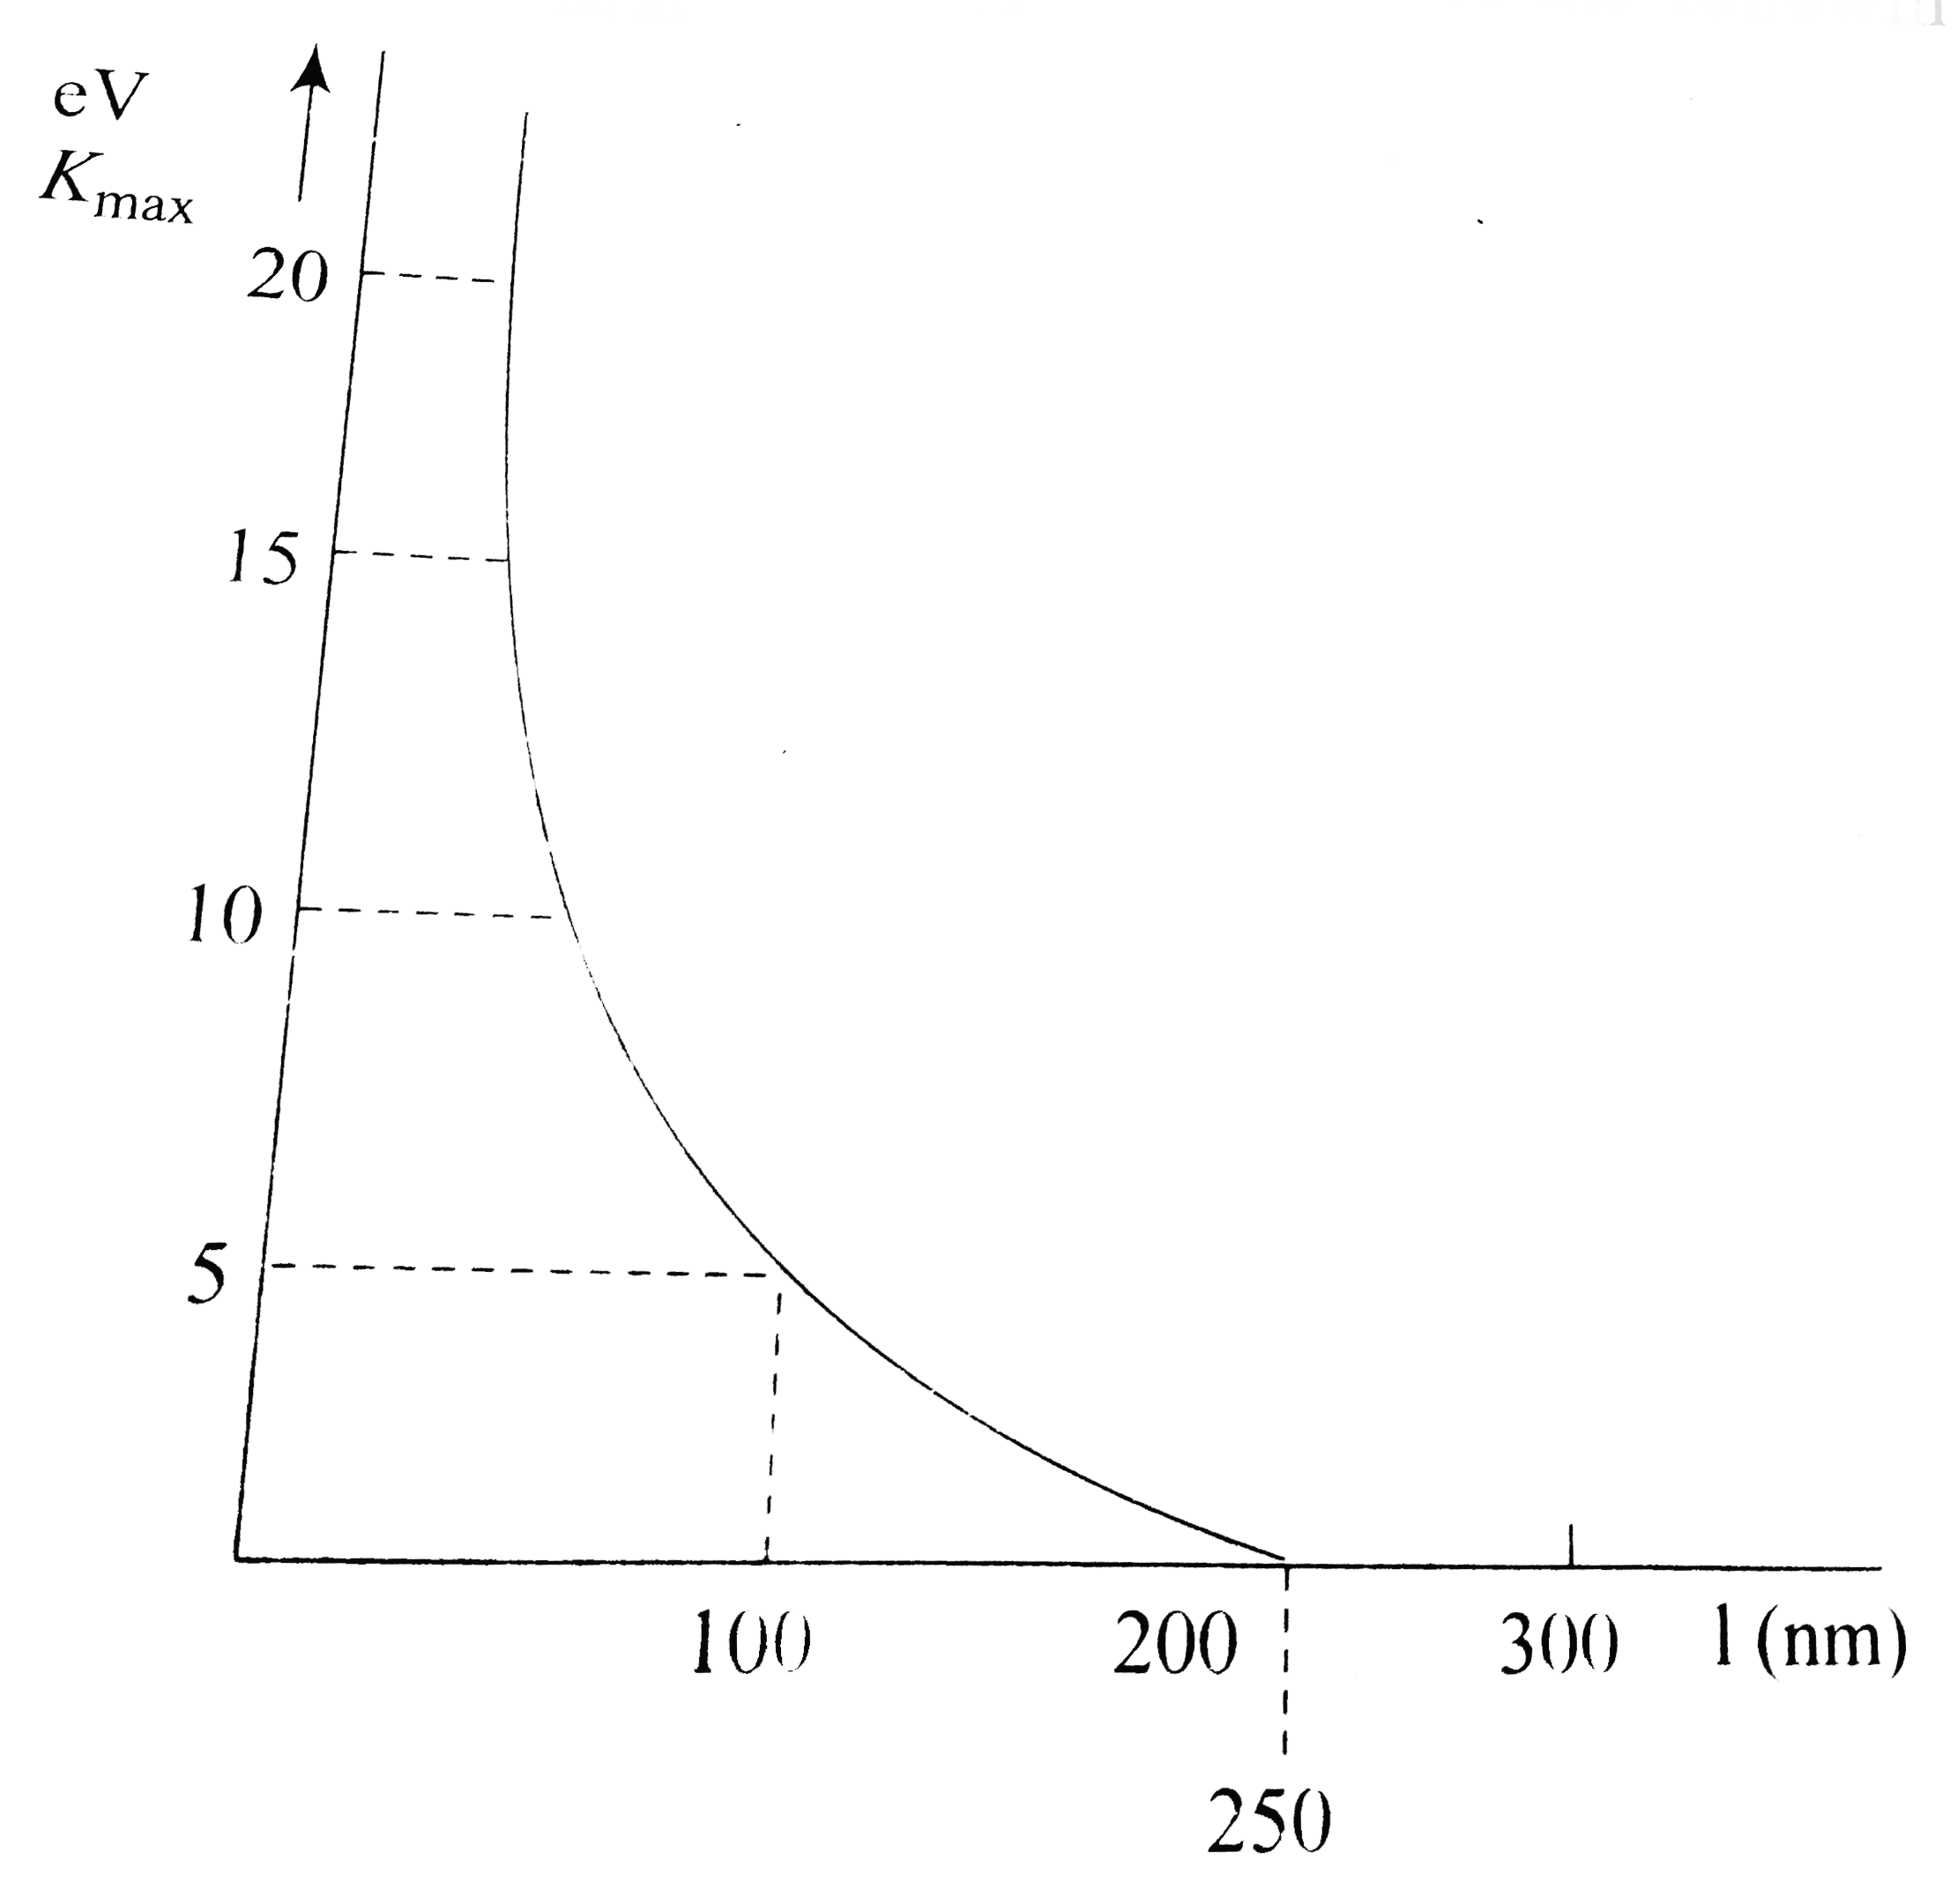
In a photoelectric effect experiment , the maximum kinetic energy of the ejected photoelectrons is measured for various wavelength of the incident light. Figure shows a graph of this maximum kinetic energy Kmax as a function of the wavelength λ of the light falling on the surface of the metal. Which of the following statement/i is/ are correct?AThreshold frequency for the metal is 1.2×10¹⁵mBWork function of the metal is 4.968 eVCMaximum kinetic energy of photoelectrons corresponding to light of wavelength 100 nm is nearly 7.4 eVDPhotoelectric effect takes place with red lightA free electron and a free proton are placed between two oppositely charged parallel plates. Both are closer to the positive plate ..than the negative plate.

Which of the following statements is true ?
(1) The force on the proton is greater than the force on the electron.
(II) The potential energy of the proton isgreater than that of the electron.
(III) The potential energy of the proton and the electron is the same.AI onlyBII onlyCIII and I onlyDII and I only
The line graph shows the exprots by a certain company. Study the diagram and answer the following questions.
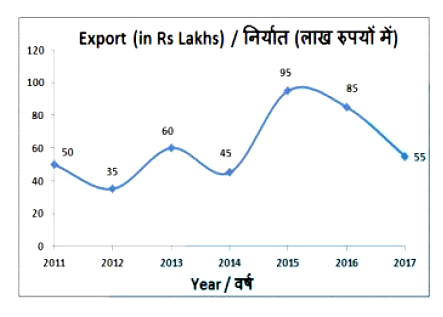
In which year were the exports greater than that of the previous year?
View SolutionThe graph shown here figure, shows the variation of the total energy (E) stored in a capacitor against the value of the capacitance (C) itself. Which of the two - the charge on the capacitor or the potential used to 4 charge it is kept constant for this graph ?
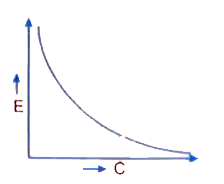
View SolutionWhich of the following elements can show covalency greater than 4?
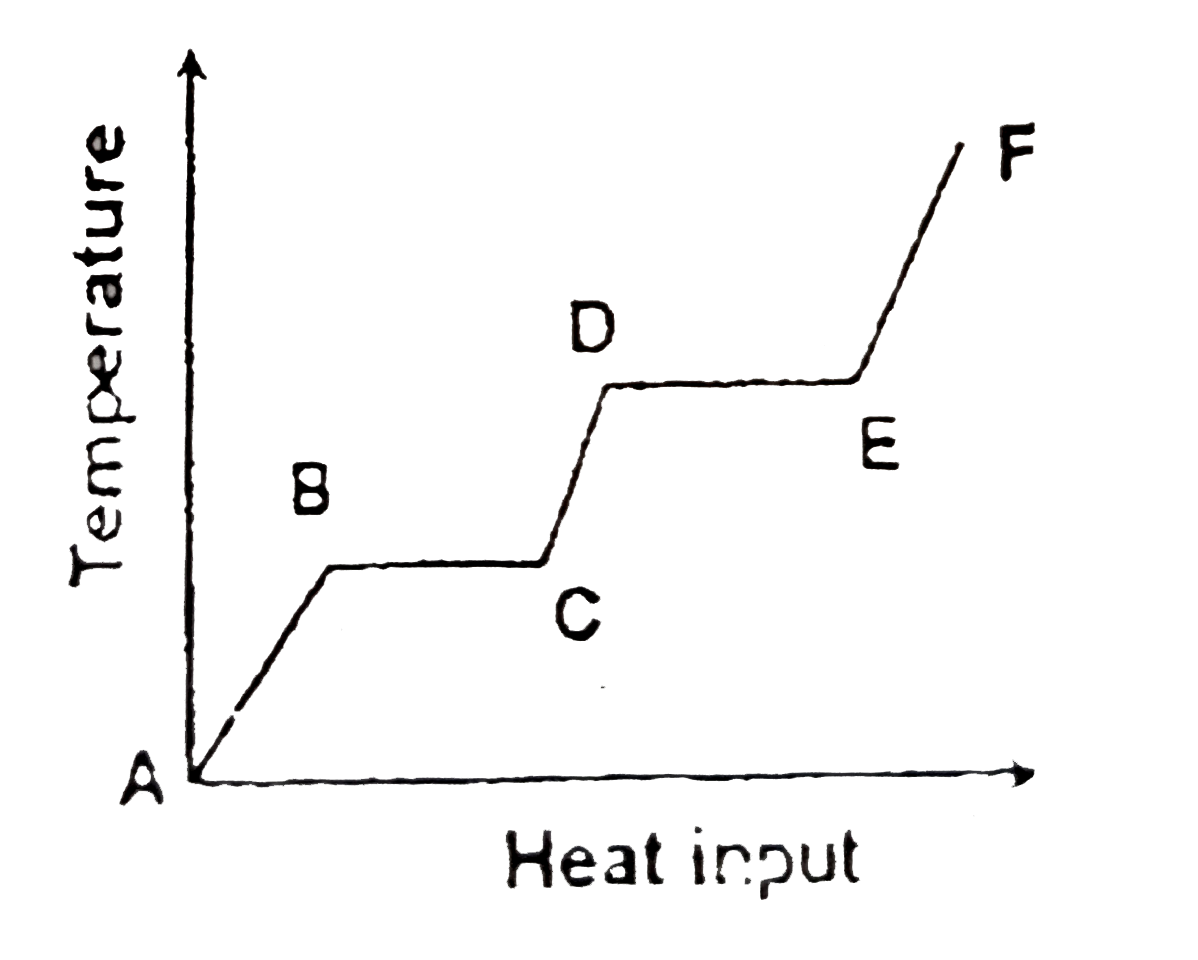
View SolutionWhen we raise the temperature of a body, the molecules and atoms move with greater kinetic enery. Assume that "the temperature" is the manifestation of only the kinetic energy is atomic and subatomic levels and no mass change (excess//defect) occurs due to heating. Now a solid material is supplied with heat at a constant rate. The temperature of the material is changing with the heat input as shown in the graph. BC and DE are parallel to the Heat-input axis
In which of the following phase the assumption made in the above comprehension is most precise ?
View SolutionAn LCR circuit is equivalent to a damped pendulum In an LCR circuit the capacitor is charged to Q0 and then connected to the L and R as shown below : Thus potential energy stored in the capacitor and that in the inductor also oscillates between maximum value an zero with double the frequency.
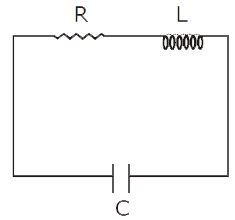
If a student plots graphs of the square of maximum charge (Q2max) on the capacitor with time (t) for two different values L1andL2(L1>L2) of L then which of the following reprersent this graph correctly ? (Plots are shematic and not drawn to scale )
View Solution