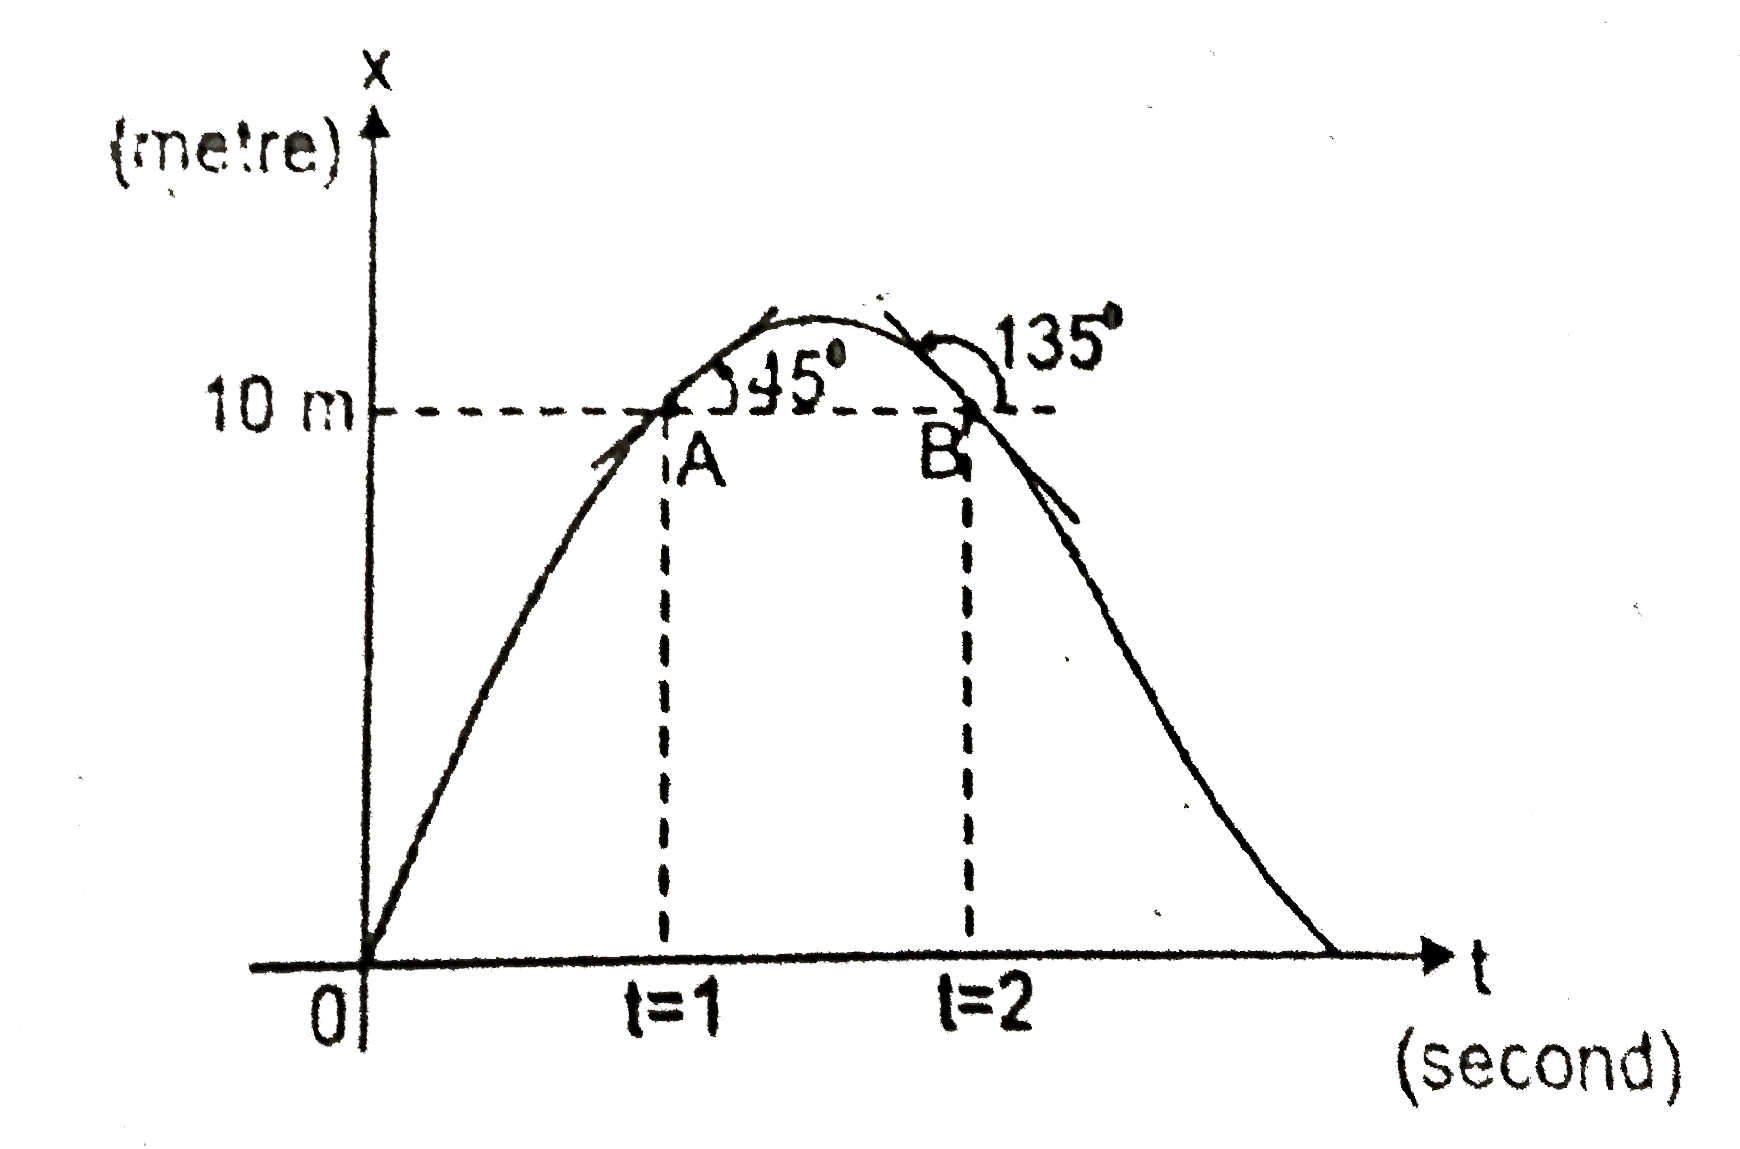
Displacement − time curve of a particle moving along a straigh line is shown. Tangents at A and B make angles 45∘ and 135∘ with positive x− axis respectively. The average acceleratively. The average acceleration of the particle during t=1,t=2 second is :
−2m/s2
1m/s2
−1m/s2
zero
The correct Answer is:A
aav=Vf−ViΔt=(Slope at B)−(Slope at A)1s=−1−11=−2m/s2
Topper's Solved these Questions
- DAILY PRACTICE PROBLEMSBOOK - RESONANCECHAPTER - DAILY PRACTICE PROBLEMSEXERCISE - dpp 51
7 Videos
- DAILY PRACTICE PROBLEMSBOOK - RESONANCECHAPTER - DAILY PRACTICE PROBLEMSEXERCISE - dpp 52
7 Videos
- DAILY PRACTICE PROBLEMSBOOK - RESONANCECHAPTER - DAILY PRACTICE PROBLEMSEXERCISE - dpp 49
6 Videos
- CURRENT ELECTRICITYBOOK - RESONANCECHAPTER - CURRENT ELECTRICITYEXERCISE - Exercise
54 Videos
- ELASTICITY AND VISCOCITYBOOK - RESONANCECHAPTER - ELASTICITY AND VISCOCITYEXERCISE - Advanced Level Problems
9 Videos
Similar Questions
The displacement-time graph of two particles A and B are straight line making angle of 60∘ and 45∘ with x-axis respectively. Then find the ratio of velocity of A and velocity of B.
View SolutionConsider the v-t diagram of a particle moving along x axis as shown below.Velocity is in m/s and time is in seconds
View Solution
Knowledge Check
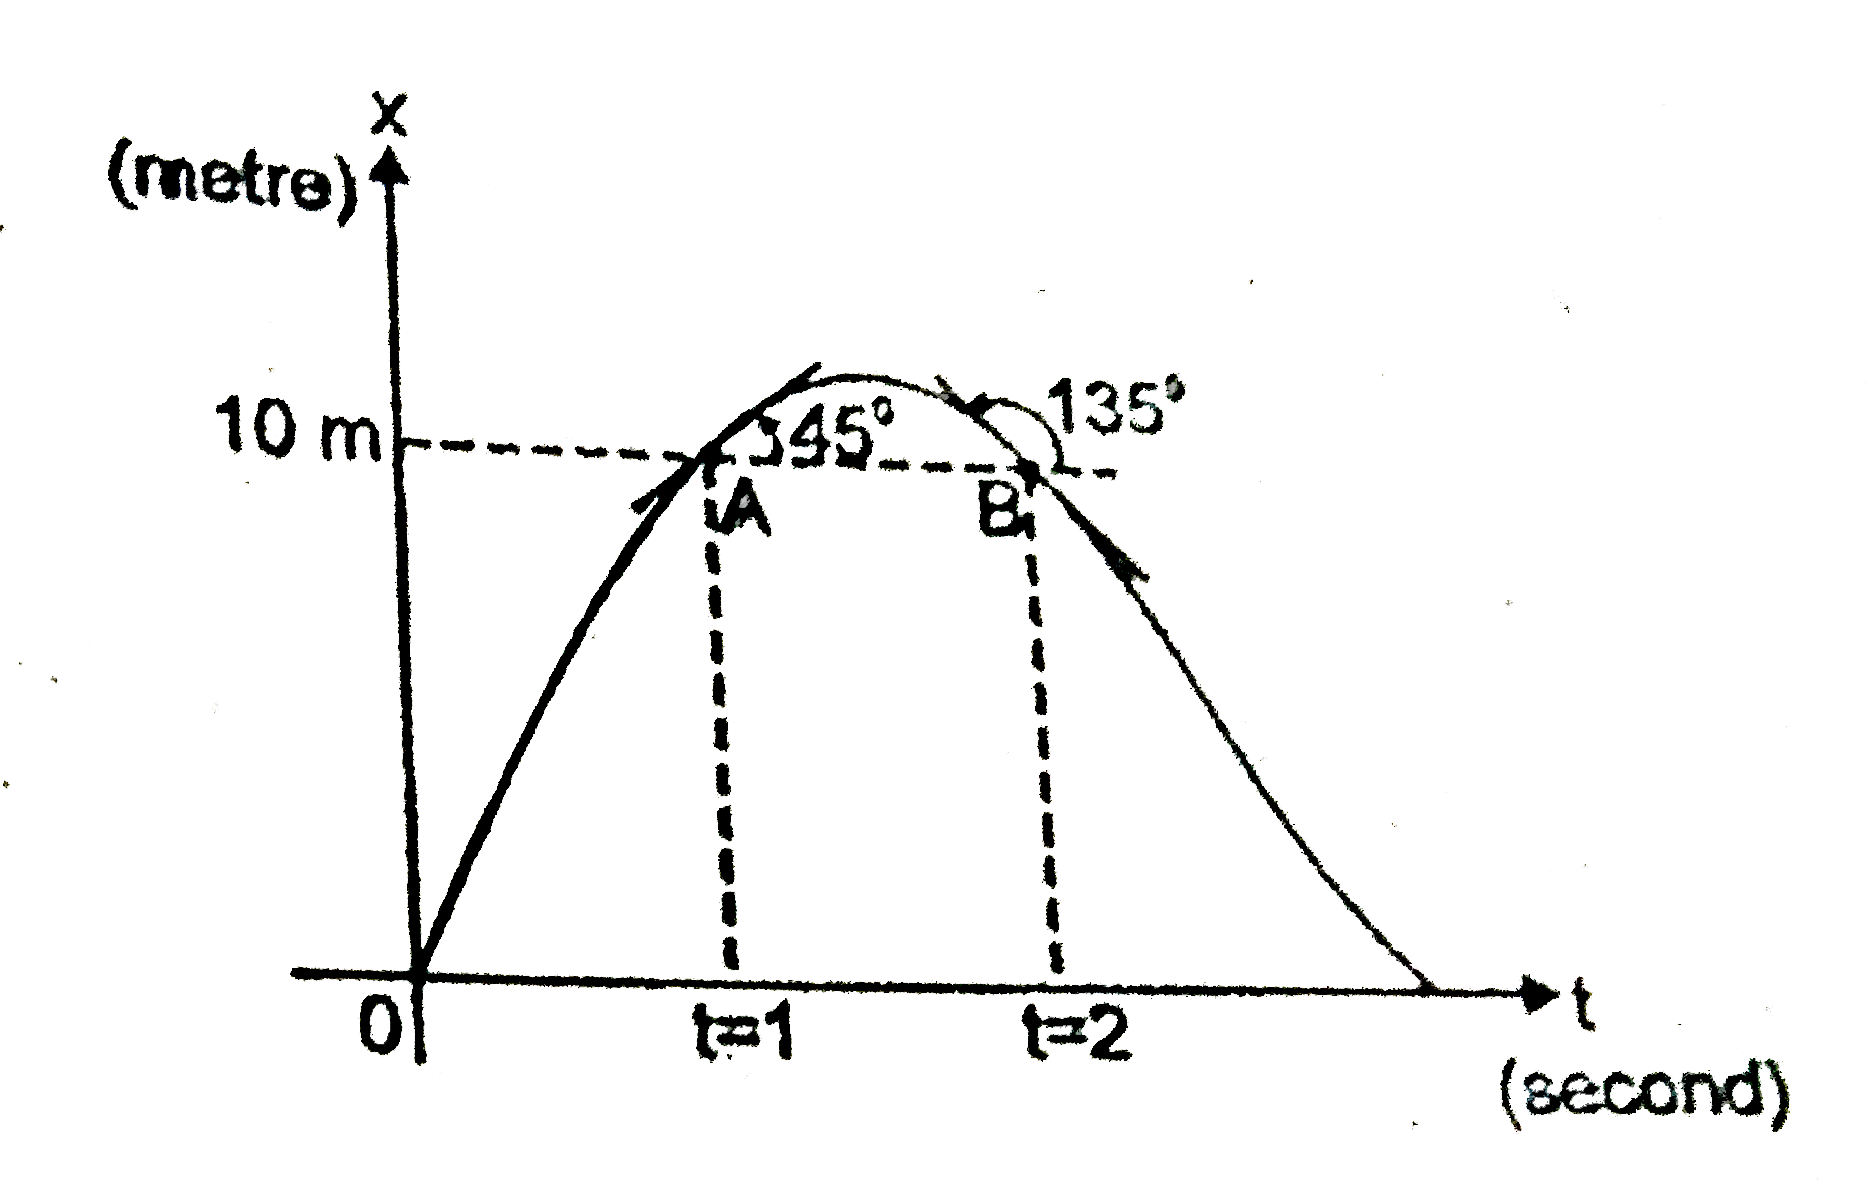
Displacement-time curve of a particle moving along a straight line is shown. Tangents at A and B makes angle 45∘ and 135∘ with positive x-axis respectively. The average acceleration of the particle during t=1,t=2 seconds is
 A−2m/s2B1m/s2C−1m/s2Dzero
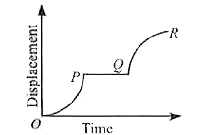
The displacement time graph of a particle moving along a straight line is shown. The accelerations of the particle during the regions OP, PQ and QR are
 AOPPQQP−0+B+0+C+0−D−0−
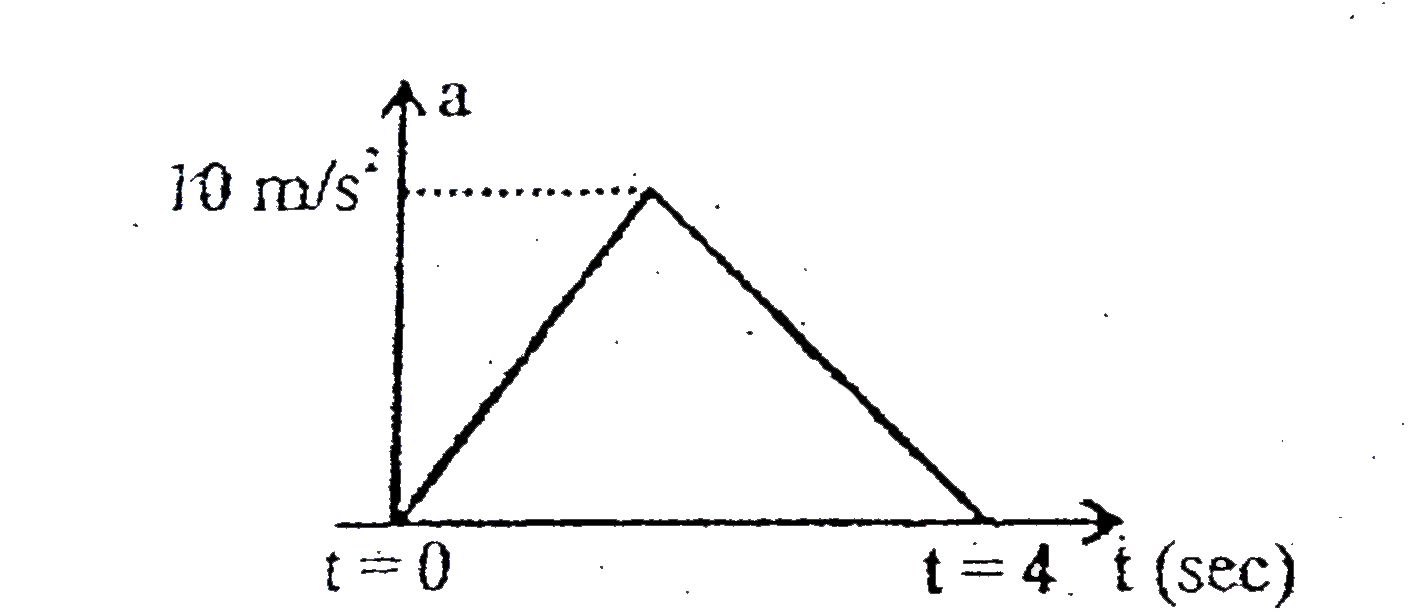
Acceleration time graph of a particle moving along a straight line is given. Then average acceleration between t=0 & t=4 is :−
 A0m/s2B5m/s2C10m/s2D7.5m/s2
Displacement (s)-time (t) graphs of two particles moving in a straight line along the X-axis are shown below: It may be stated that the

View SolutionThe x-t graph of a particle moving along a straight line is shown in figure
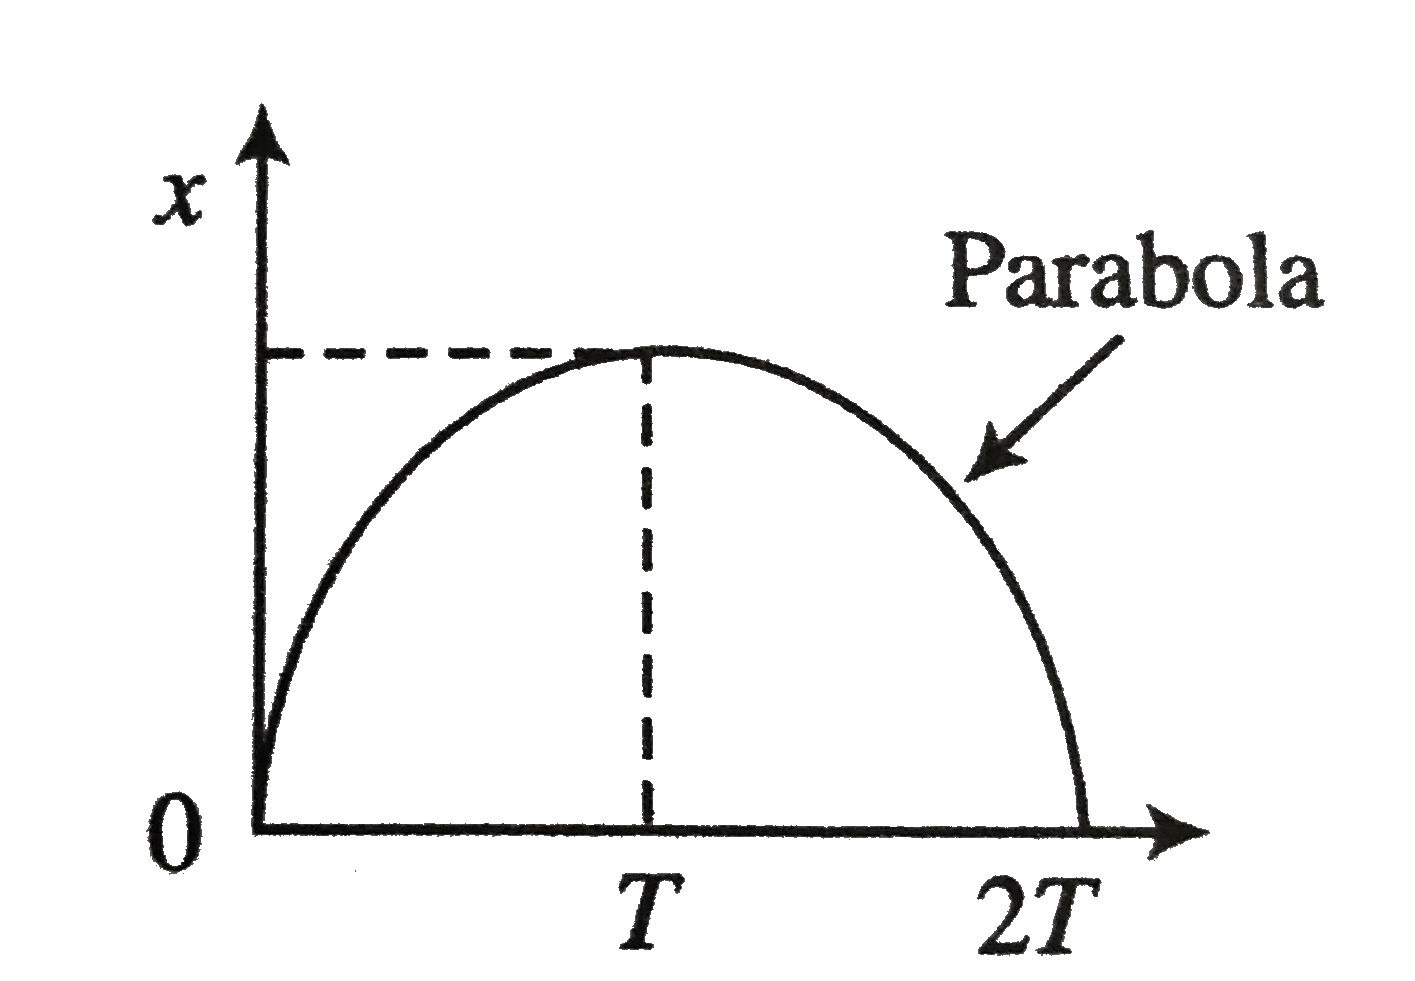
The speed-time graph of the particle is correctly shown by
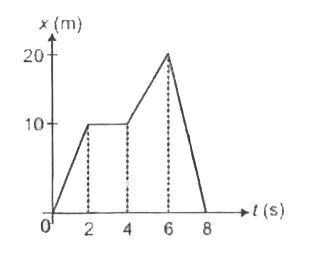
View SolutionThe position (x) - time (t) graph for a particle moving along a straight line is shown in figure. The average speed of particle in time interval t = 0 to t = 8 s is
View SolutionA particle is moving along straight line whose position x at time t is described by x=t3−t2 where x is in meters and tis in seconds . Then the average acceleration from t=2 sec. to t=4 sec, is :
View SolutionThe displacement 'x' of a particle moving along a straight line at time t is given by x=a0+a1t+a2t2. The acceleration of the particle is :-
View Solution
