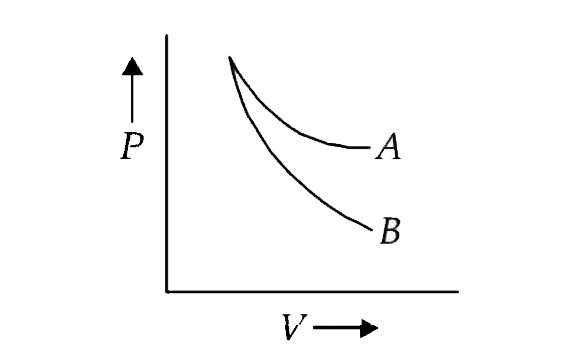
In figure, A and B are two adiabatic curves for two different gases. Then A and B corresponds to:
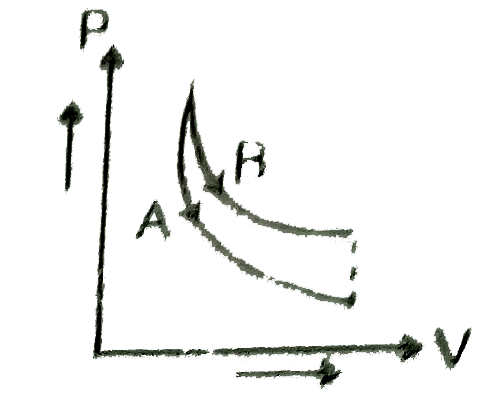
Ar and He respectively
He and H2 respectively
O2 and H2 respectively
H2 and He respectively
The correct Answer is:B
Step by step video, text & image solution for In figure, A and B are two adiabatic curves for two different gases. Then A and B corresponds to: by Physics experts to help you in doubts & scoring excellent marks in Class 11 exams.
Updated on:21/07/2023Topper's Solved these Questions
- KTG & THERMODYNAMICSBOOK - RESONANCECHAPTER - KTG & THERMODYNAMICSEXERCISE - SECTION (D)
2 Videos
- KTG & THERMODYNAMICSBOOK - RESONANCECHAPTER - KTG & THERMODYNAMICSEXERCISE - SECTION (I)
2 Videos
- KTG & THERMODYNAMICSBOOK - RESONANCECHAPTER - KTG & THERMODYNAMICSEXERCISE - SECTION (A)
3 Videos
- KINETIC THEORY OF GASES AND THERMODYNAMICSBOOK - RESONANCECHAPTER - KINETIC THEORY OF GASES AND THERMODYNAMICSEXERCISE - Exercise
64 Videos
- MAGNETIC FIELD AND FORCESBOOK - RESONANCECHAPTER - MAGNETIC FIELD AND FORCESEXERCISE - Exercise
65 Videos
Similar Questions
The figure demonstrates the adiabatic curves for two gases, helium and carbon dioxide. Which curve corresponds to which gas?
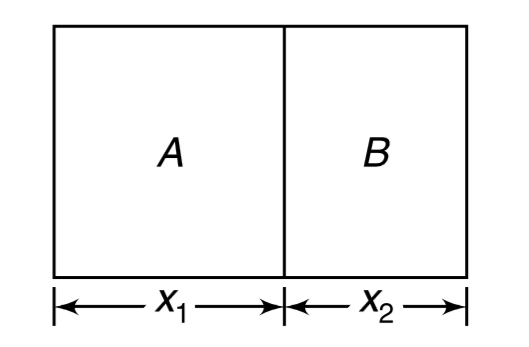
View SolutionA conducting piston separates a cylindrical tube into two compartments A and B. The two compartments contain equal mass of two different gases. The molar mass of two gases are MA=32g and MB28g. Find the ratio of lengths (X1:X2) of the two compartments in equilibrium.
View Solution
Knowledge Check
If p and q are two logical statements and A and B are two sets, then p→q corresponds to
AA⊆BBA∩BCA∪BD A cancelsube BFigure shows the adiabatic curve for n moles of an ideal gas, the bulk modulus for the gas corresponding to the point P will be
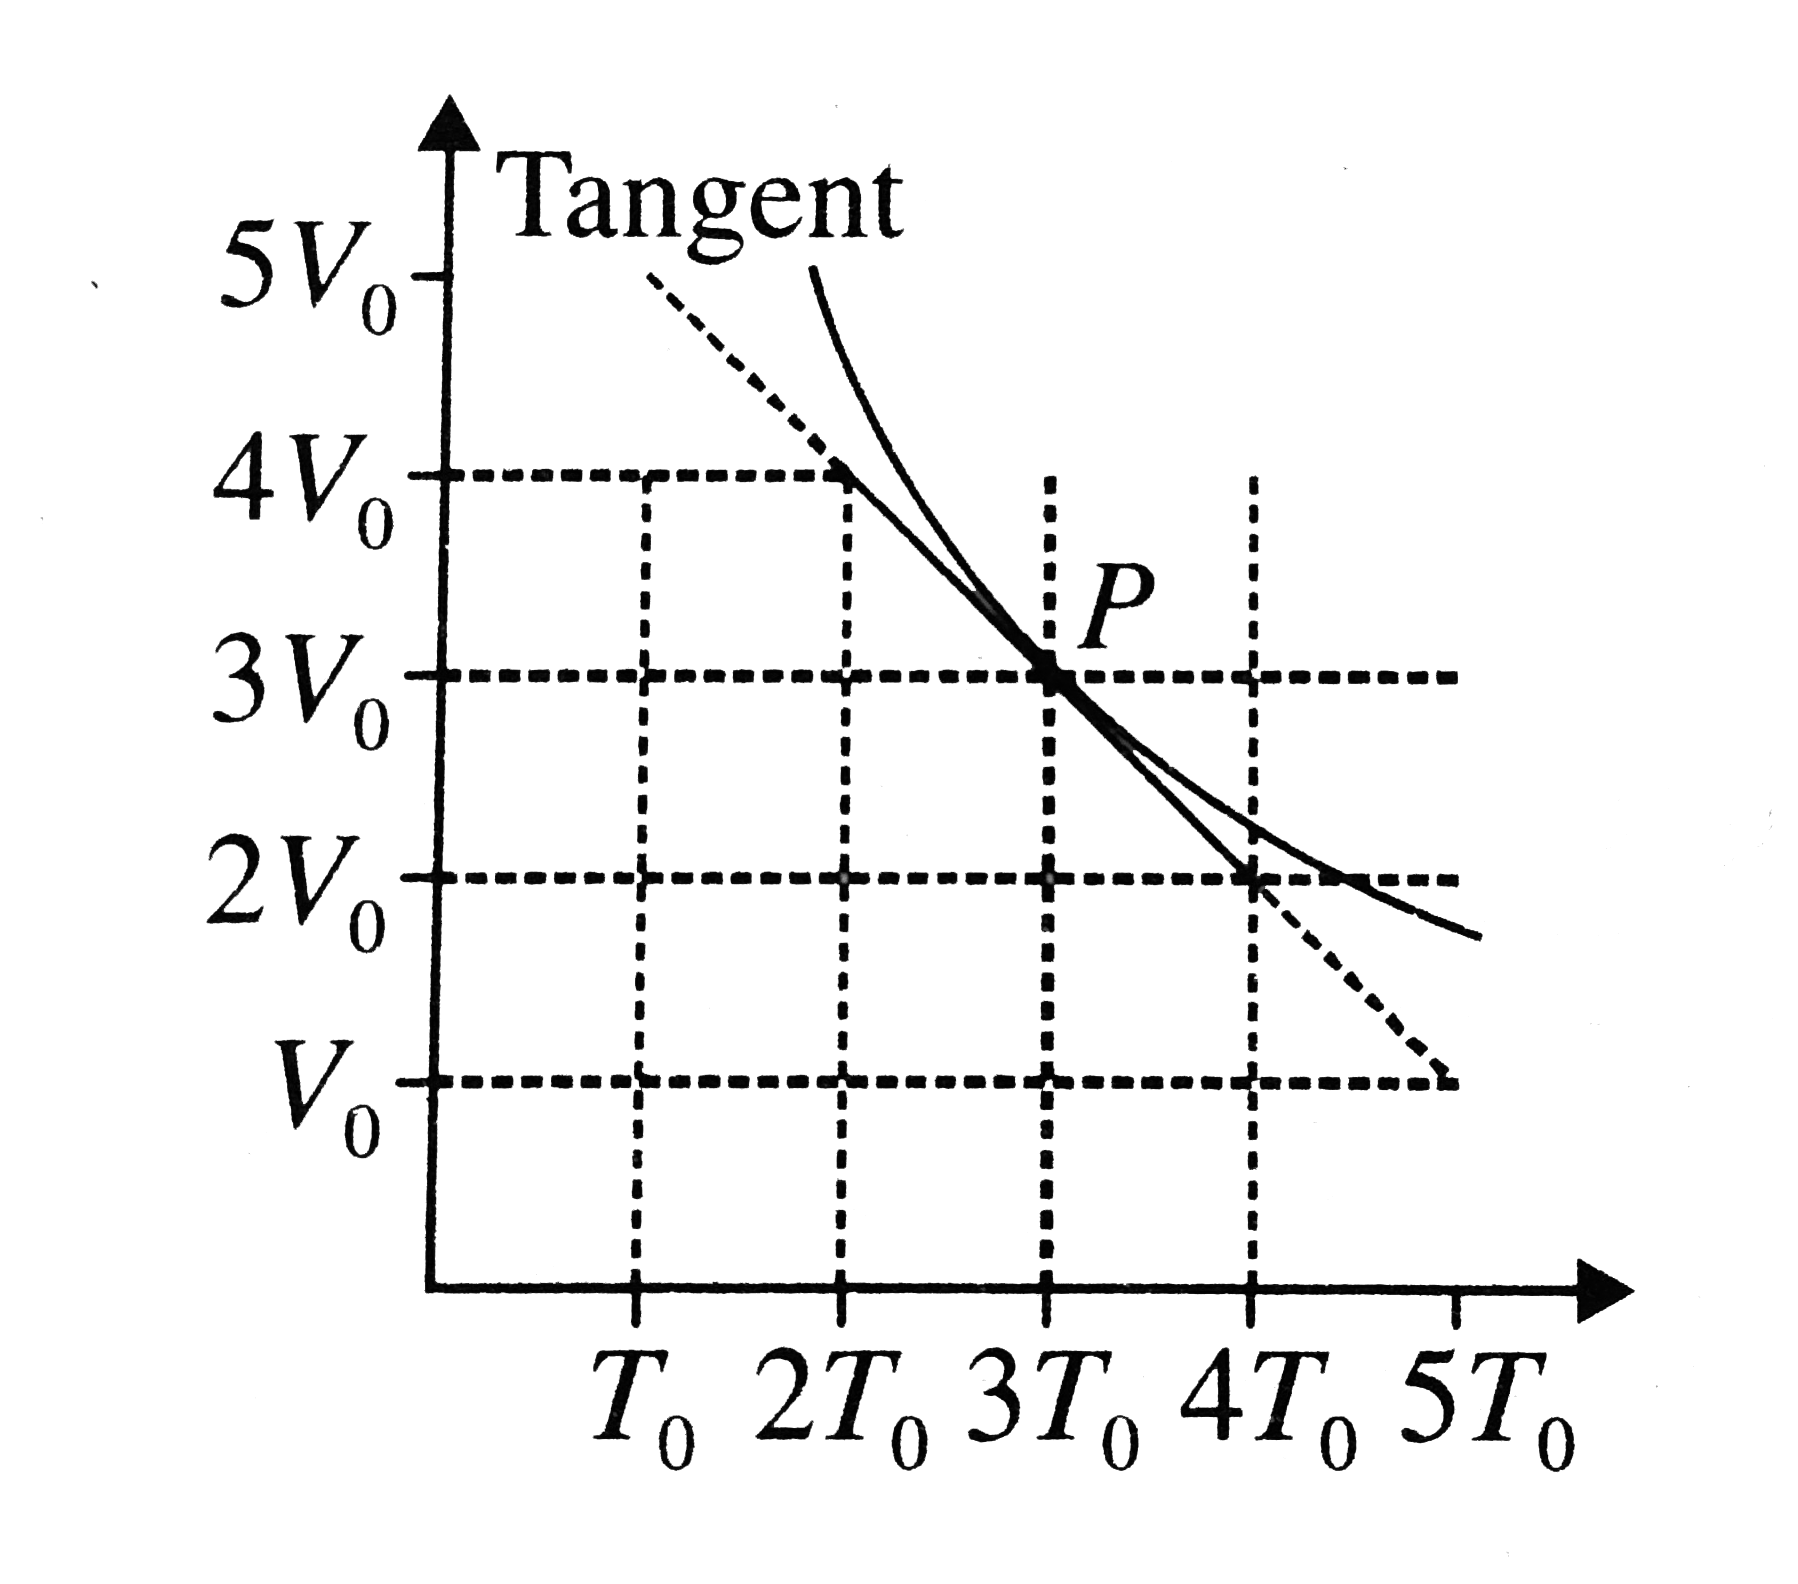 A5nRT03V0BnR(2+T0V0)CnR(1+T0V0)D2nRT0V0
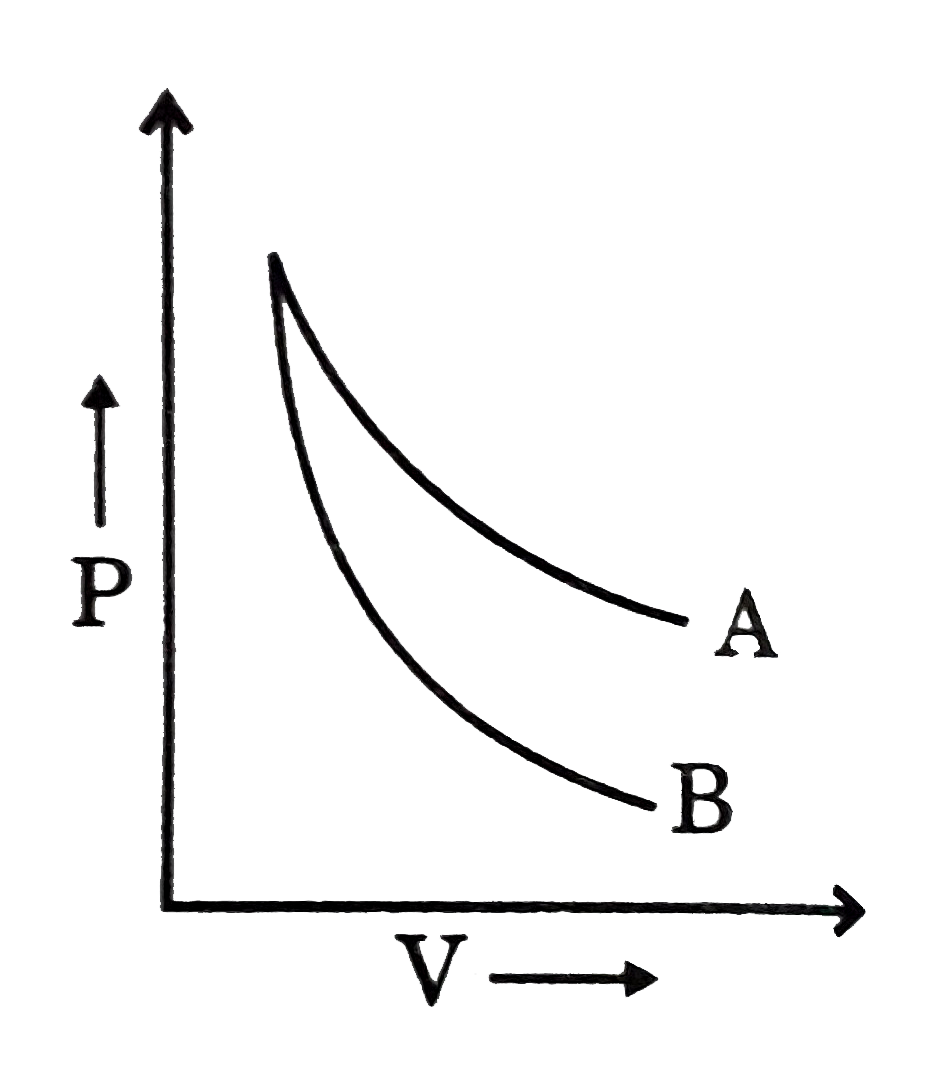
P−V plot for two gases ( assuming ideal ) during adiabatic processes are given in the fig.
Plot A and B should correspond respectively to :
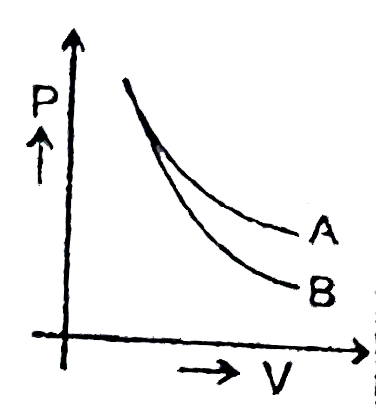 AHe and H2BH2 and HeCHe and NeDH2 and Cl2
The curves A and B in the figure shown P-V graphs for an isothermal and an adiabatic process for an idea gas. The isothermal process is represented by the curve A.
View SolutionThe sum of two vectors A and B is at right angles to their difference. Then
View SolutionP-V plots for two gases during an adiabatic process are given in the figure:
Plot A and plot B should correspond to : (Assume ideal behaviour)

View SolutionP-V plot for two gases (assuming ideal) during adiabatic processes are given in the figure. Plot A and plot B should correspond respectively to :
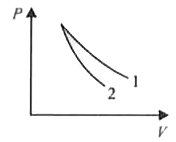
View SolutionP−V plots for two gases during P4 adiabatic process are shown in the figure. Plots 1 and 2 should correspond respectively to
View Solution
